08/November – COVID-19 Time varying reproduction numbers estimation for Portugal
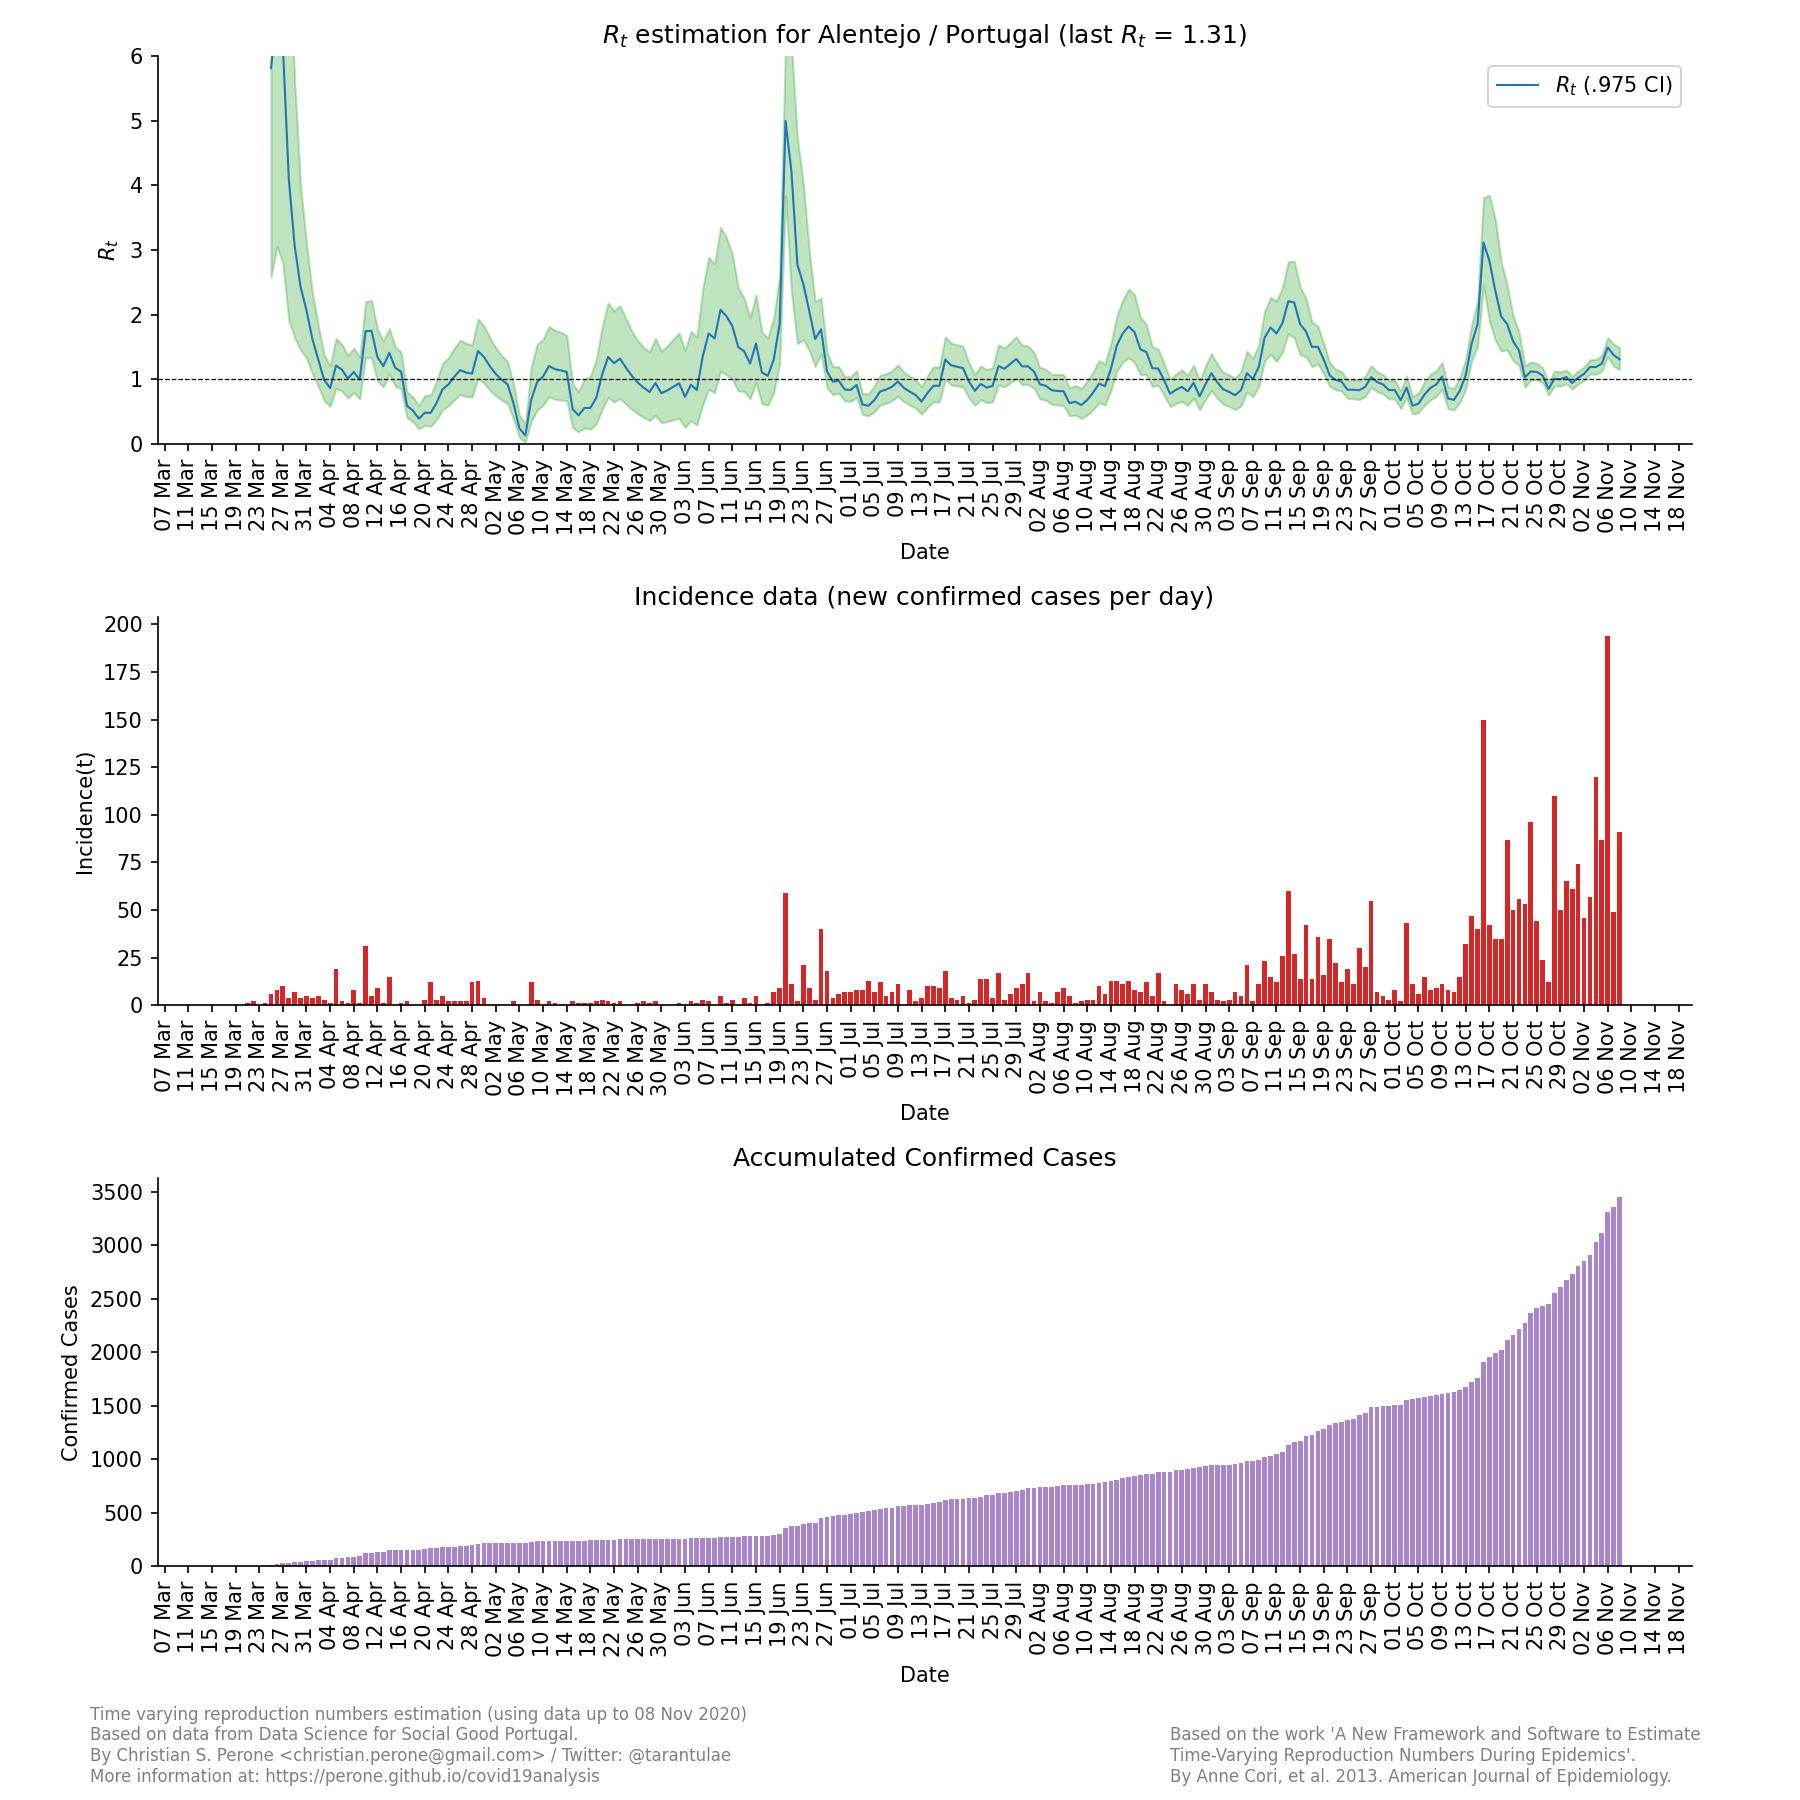
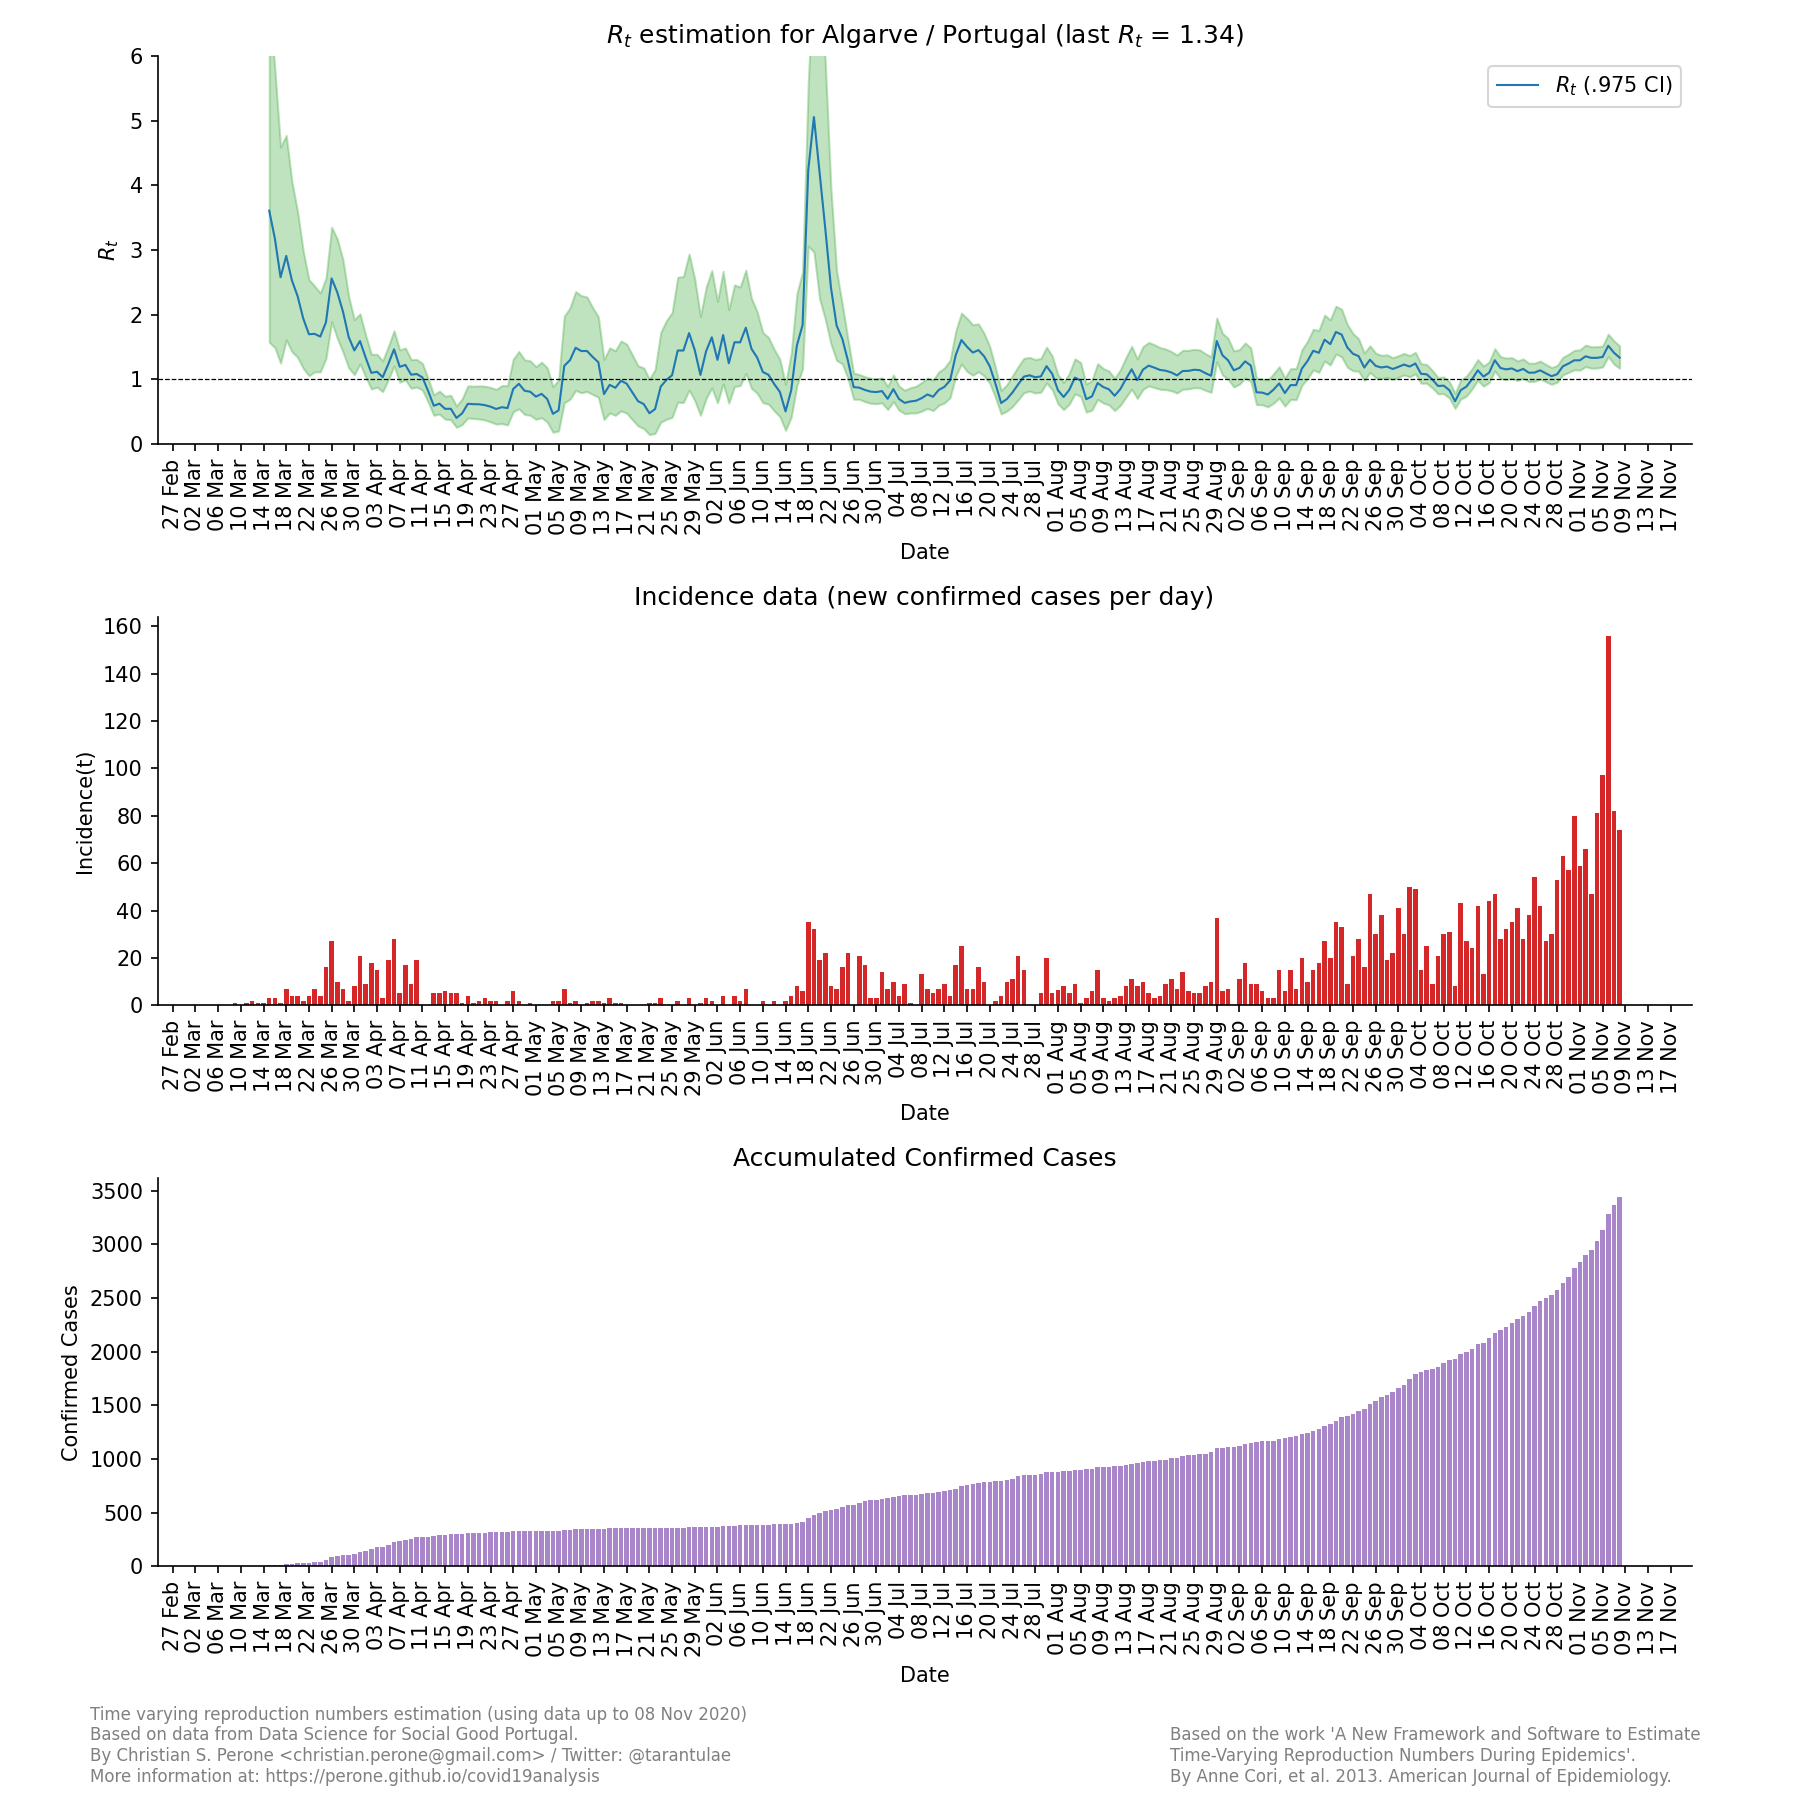
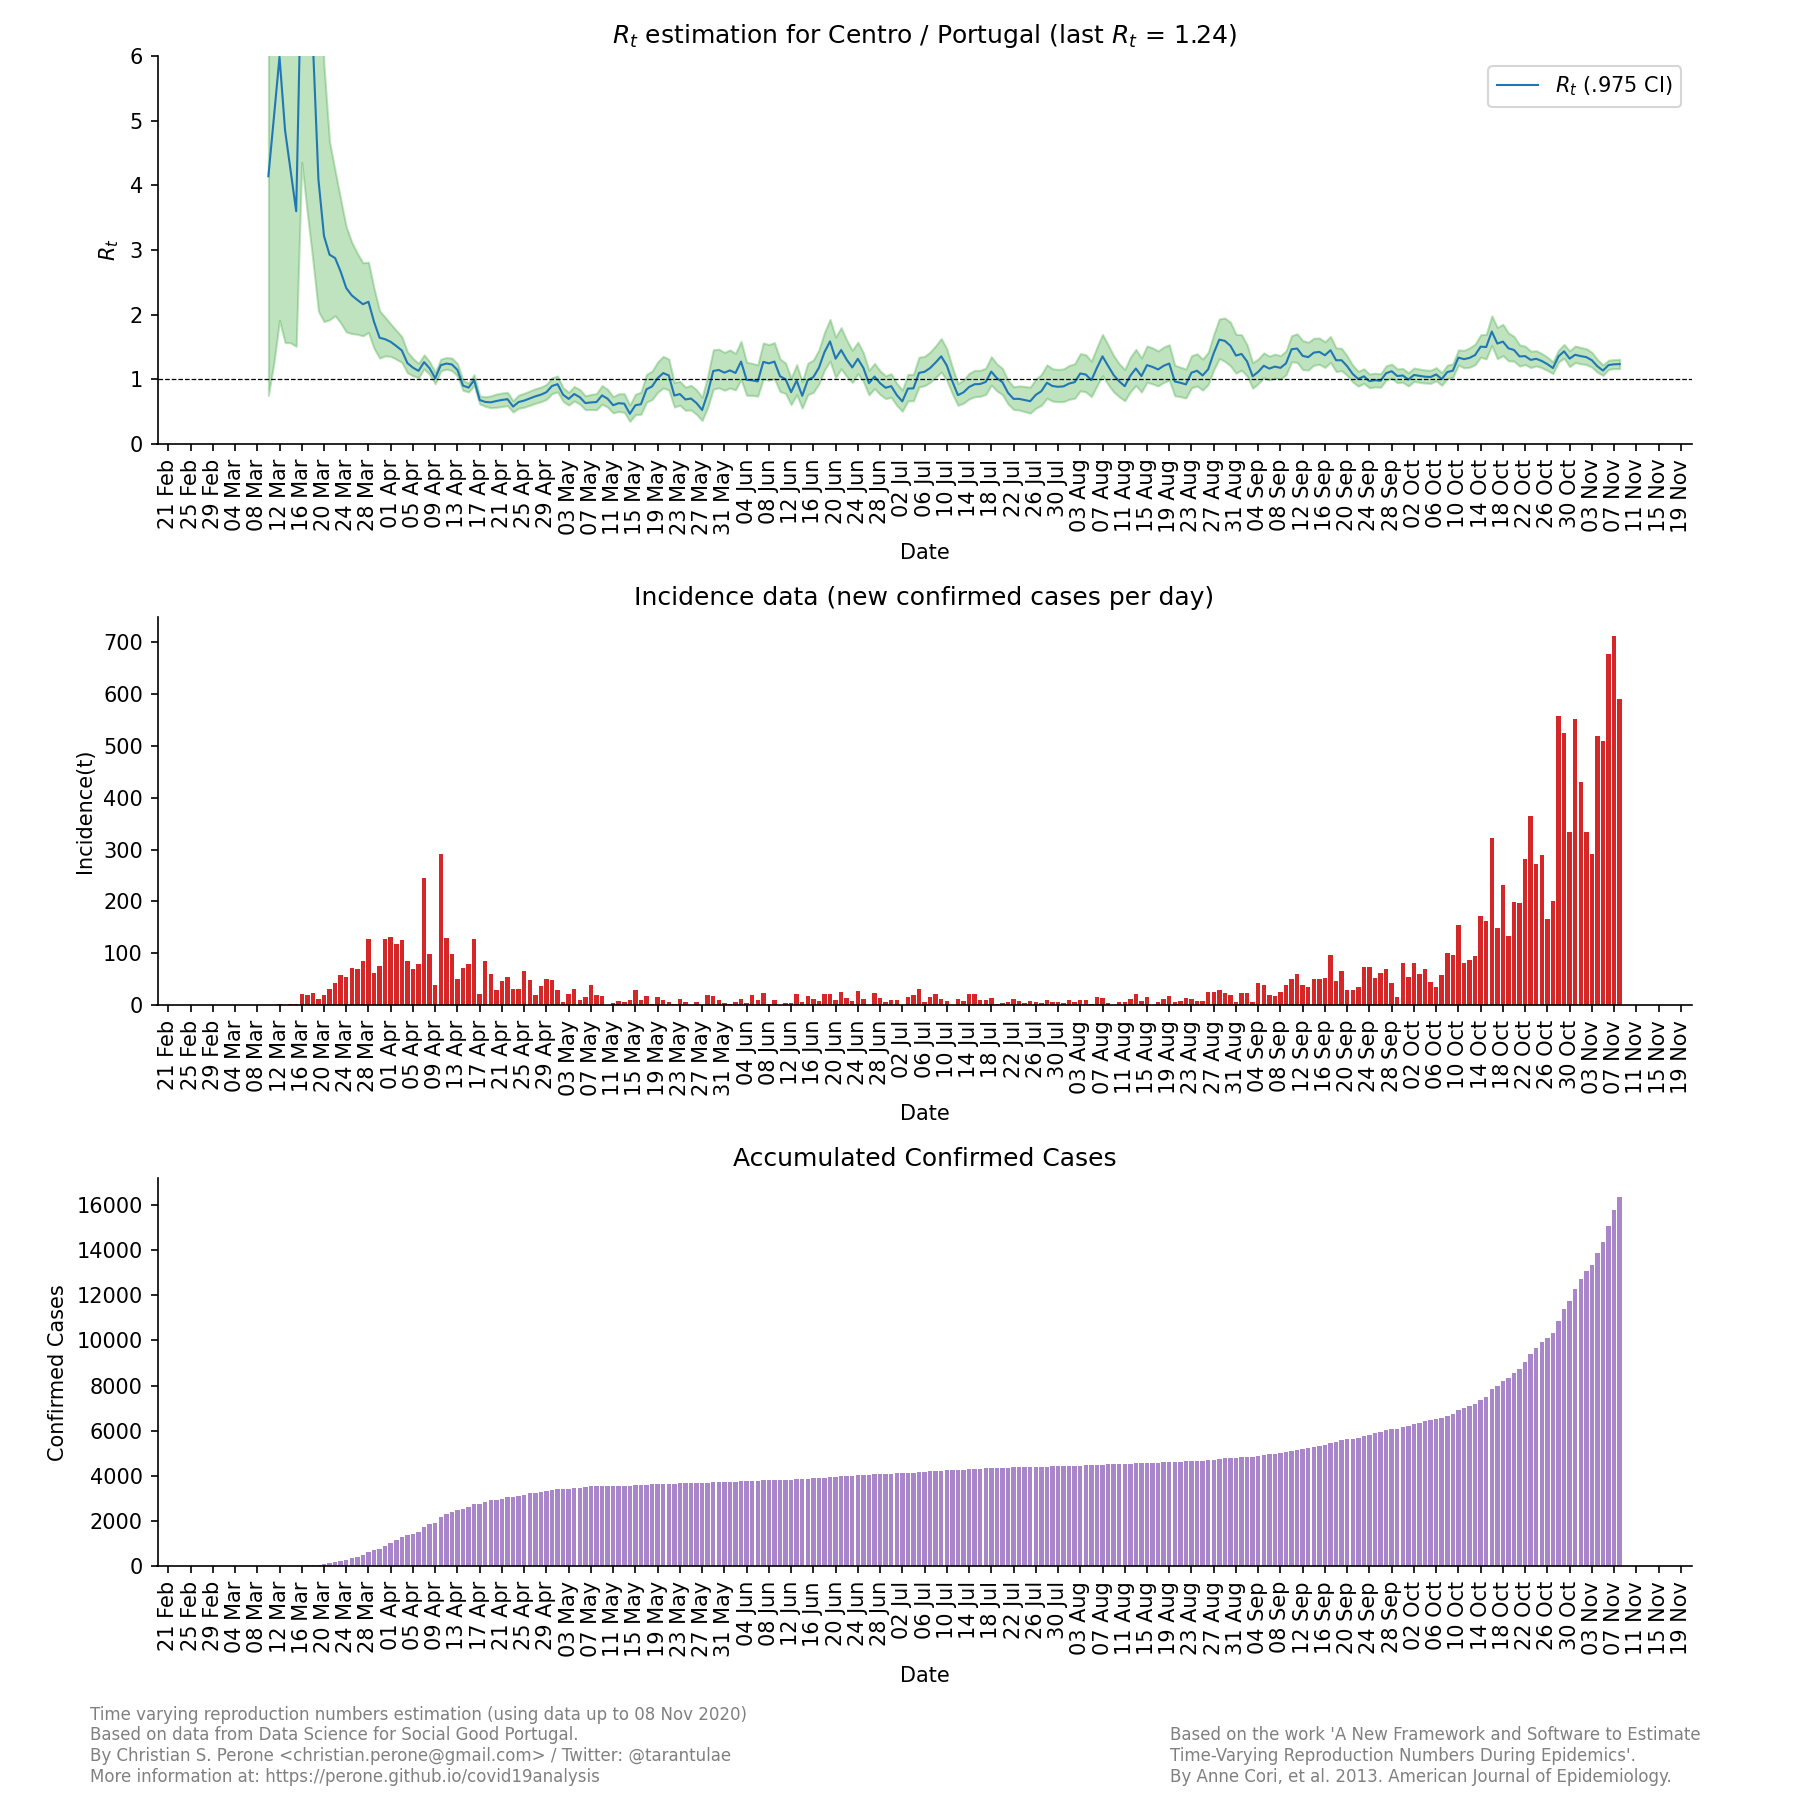
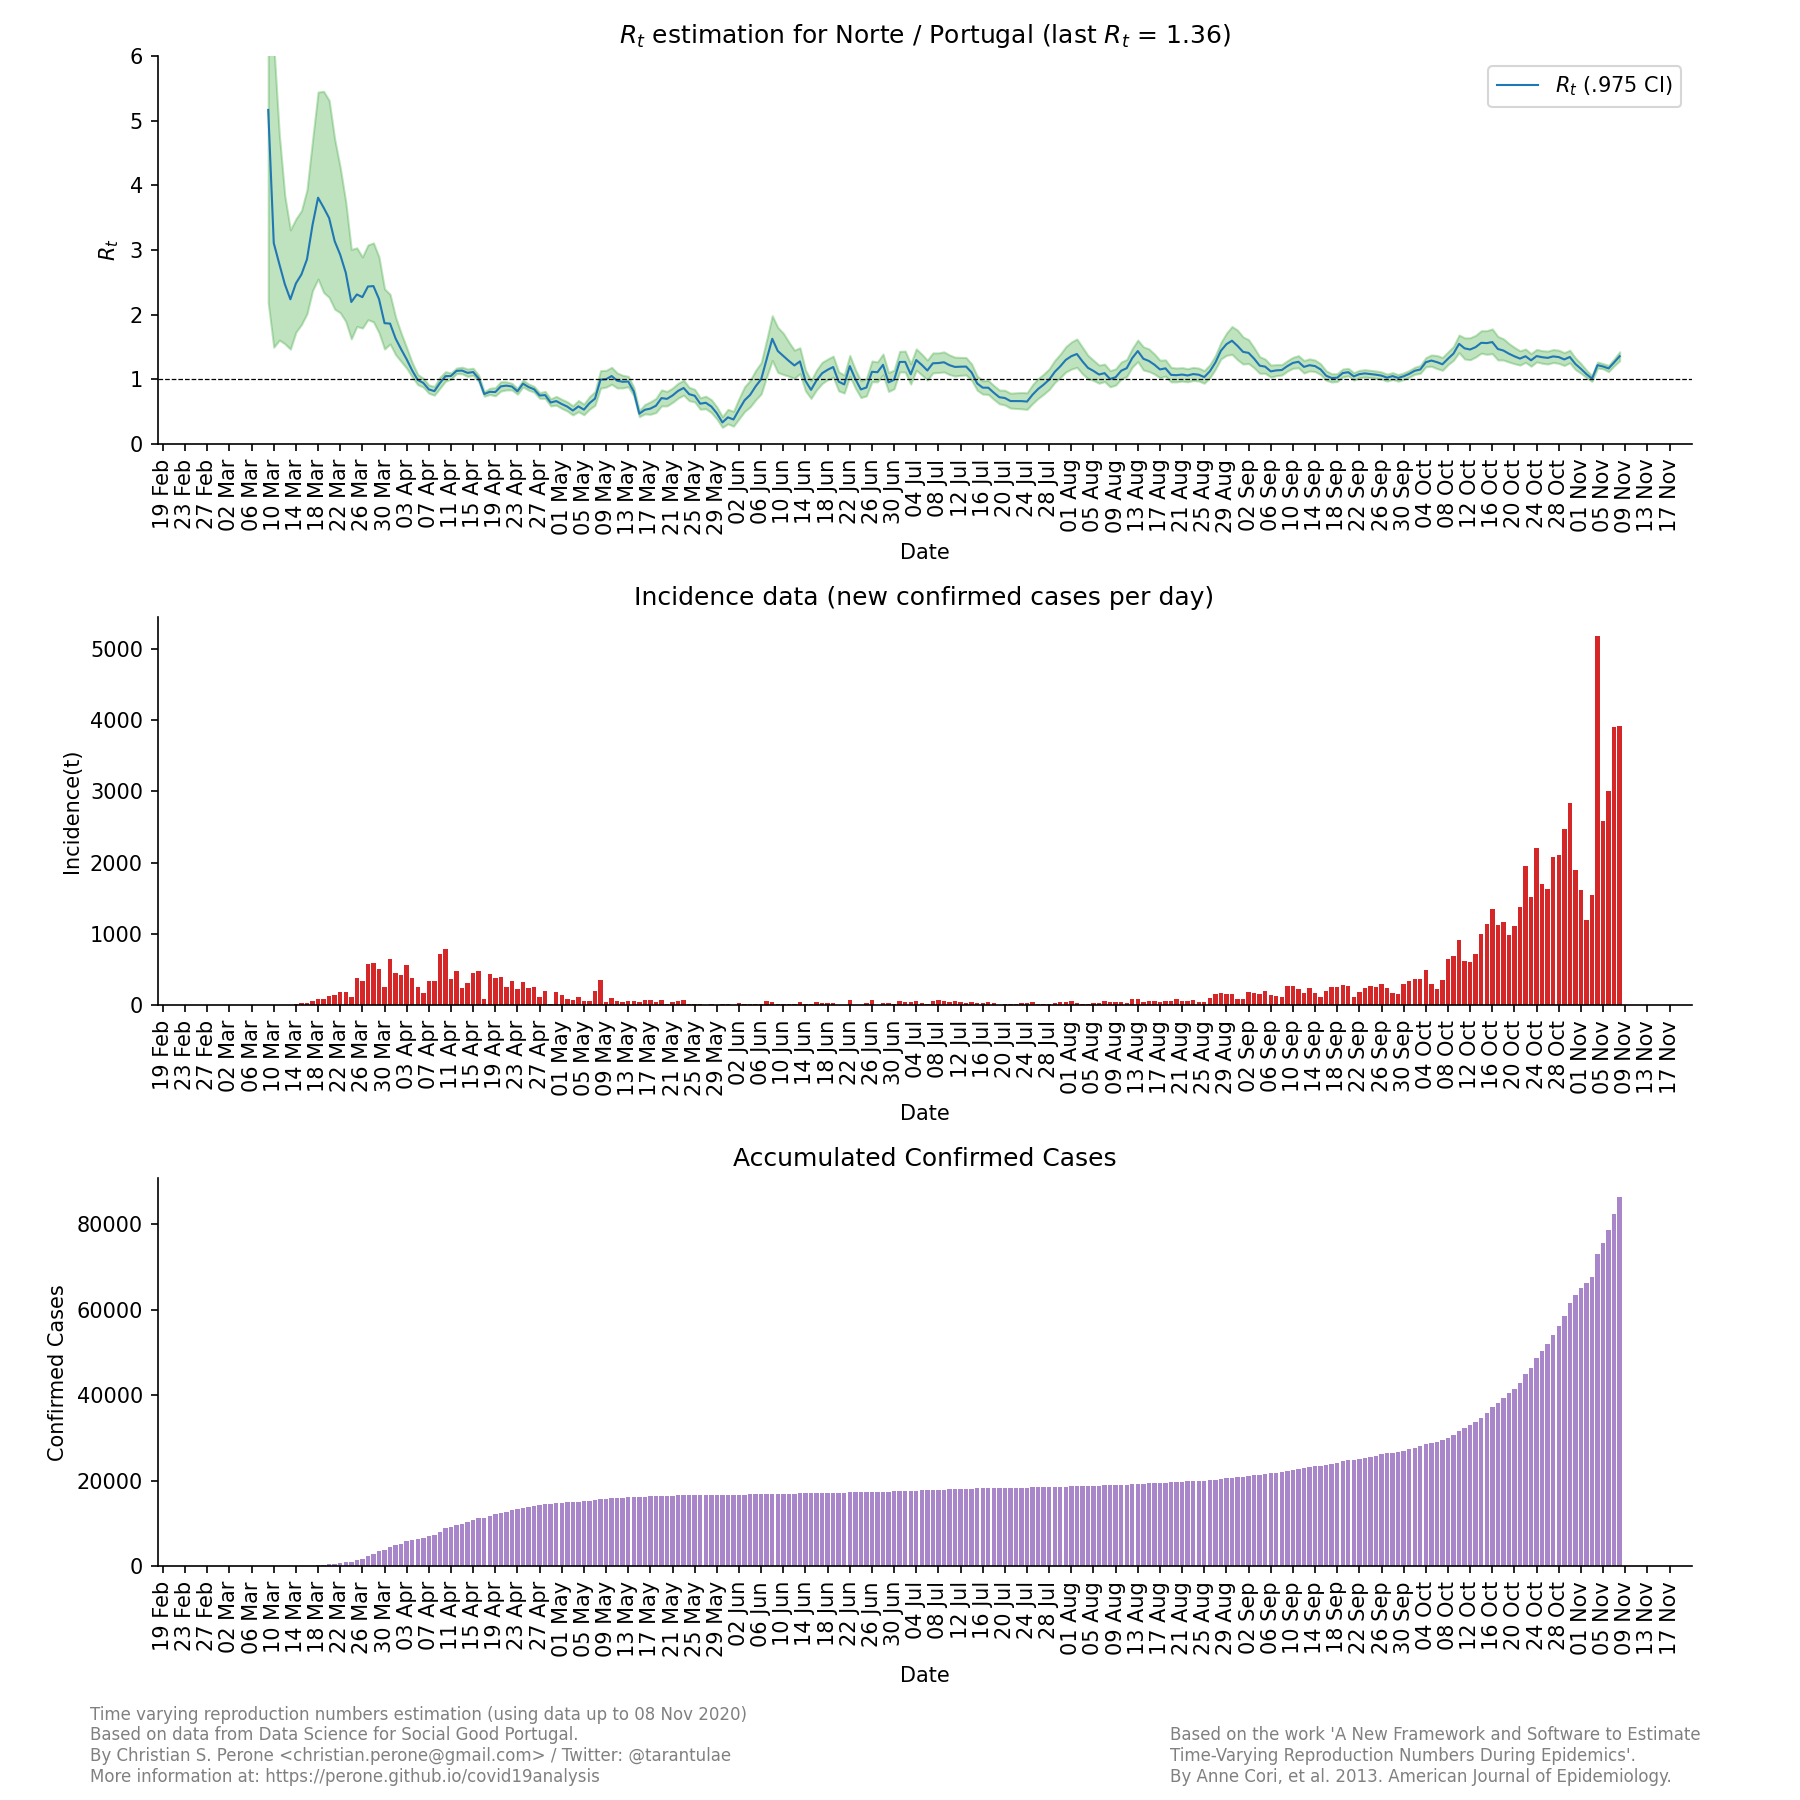
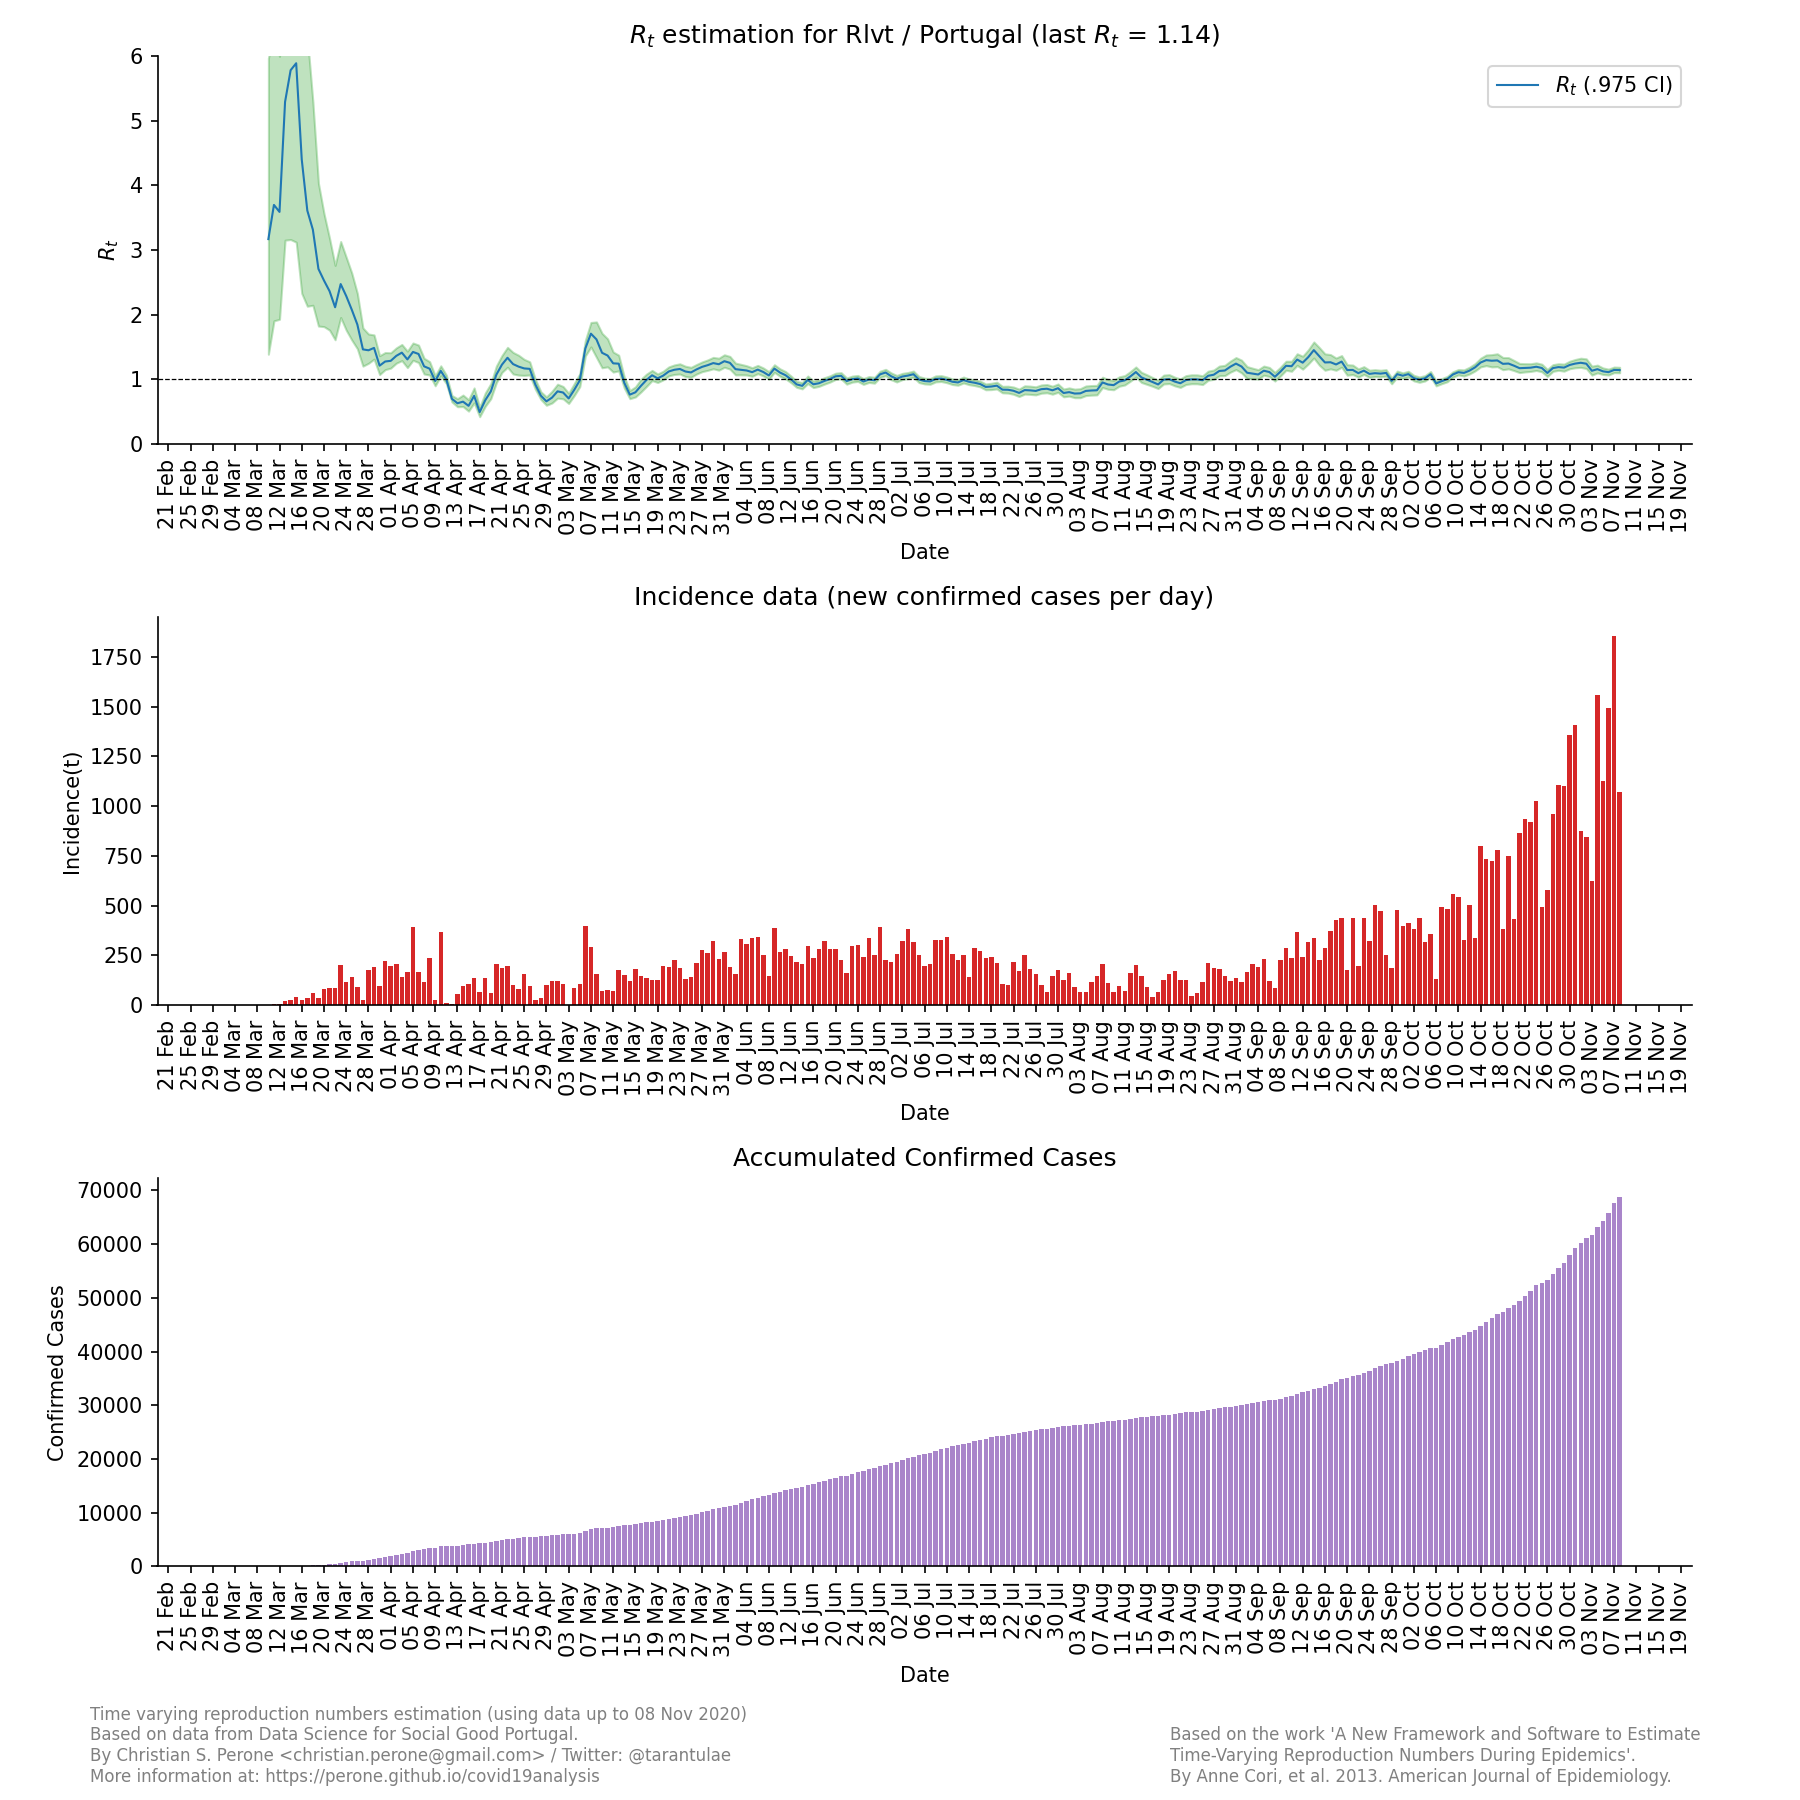
These plots show the estimation of the instantaneous reproduction number for all the regions in continental Portugal. These reports uses the method described in the work A New Framework and Software to Estimate Time-Varying Reproduction Numbers During Epidemics. We used the serial interval parameters similar to the ones used by CMMID with a \(\mu = 4.7 (3.7 - 6.0)\) and \(\sigma = 2.9 (1.9 - 4.9)\).
Note
This plot uses official data Data Science for Social Good Portugal, reports until 08/November. This method is sensitive to changes in COVID-19 testing procedures and the level of effort used to detect cases. Therefore, changes in the testing efforts will introduce bias if the testing practices are not kept consistent. So please keep in mind these limitations, that are often not stated in many analysis around there. Imported cases weren’t also considered in this analysis, neither the delay of the symptoms onset and reporting. I tried many times to enter in contact with DGS to understand why sometimes accumulated cases decrease from ony day to another, but they never answered, therefore I do linear interpolation when I have negative incidence.
Summary for the last instantaneous reproduction number estimate
Map for the accumulated cases
Map for the last instantaneous reproduction number estimate
Map of states with mean reproduction number R(t) > 1.0
Map for the accumulated deaths by COVID-19
Summary for the last instantaneous reproduction number estimate
Last update: 08/November

Summary table for the last instantaneous reproduction number estimate
| Region | Mean Estimated R (CI 0.975) |
|---|---|
| norte | 1.36 (1.29 - 1.43) |
| algarve | 1.34 (1.17 - 1.52) |
| alentejo | 1.31 (1.15 - 1.49) |
| centro | 1.24 (1.17 - 1.31) |
| rlvt | 1.14 (1.10 - 1.19) |
Region: Alentejo
Region: Algarve
Region: Centro
Region: Norte
Region: Rlvt
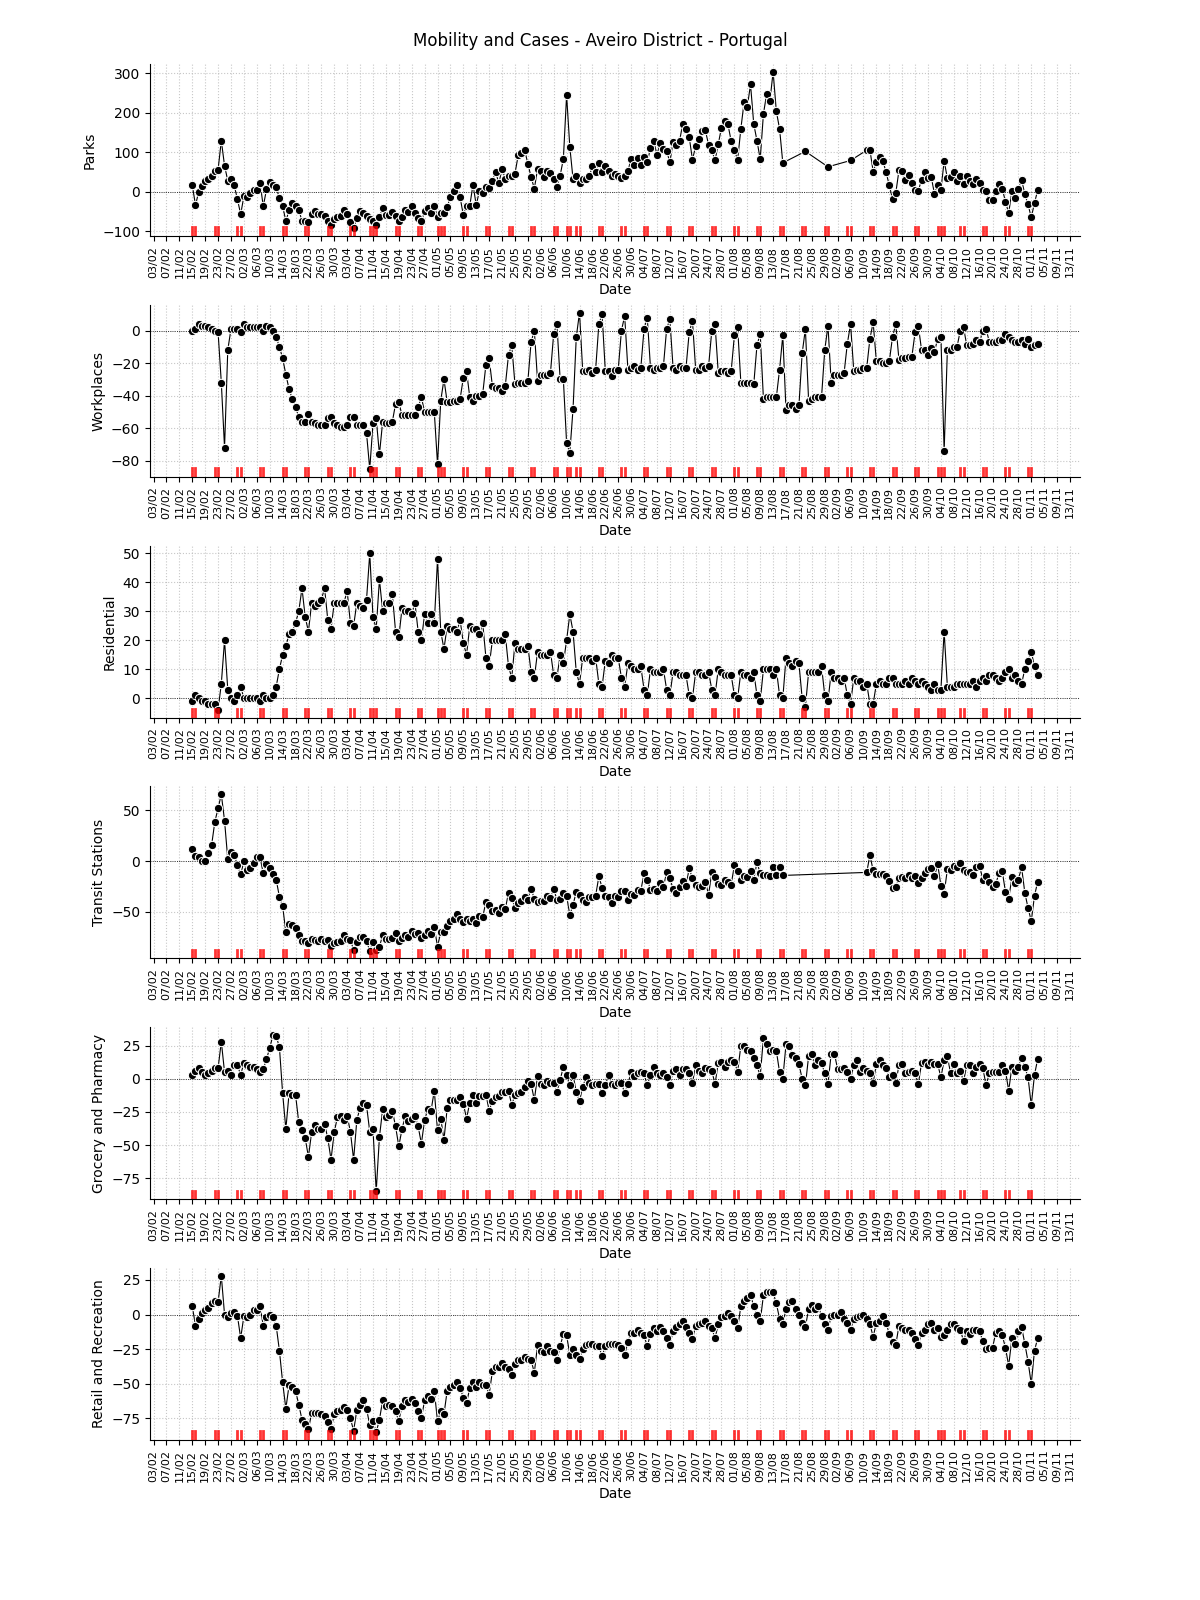
Mobility region: Aveiro District
Mobility data for the sub-region
Note
This plot uses official mobility data from Google Community Mobility Reports. The red markers on the x-axis are weekends or holidays.
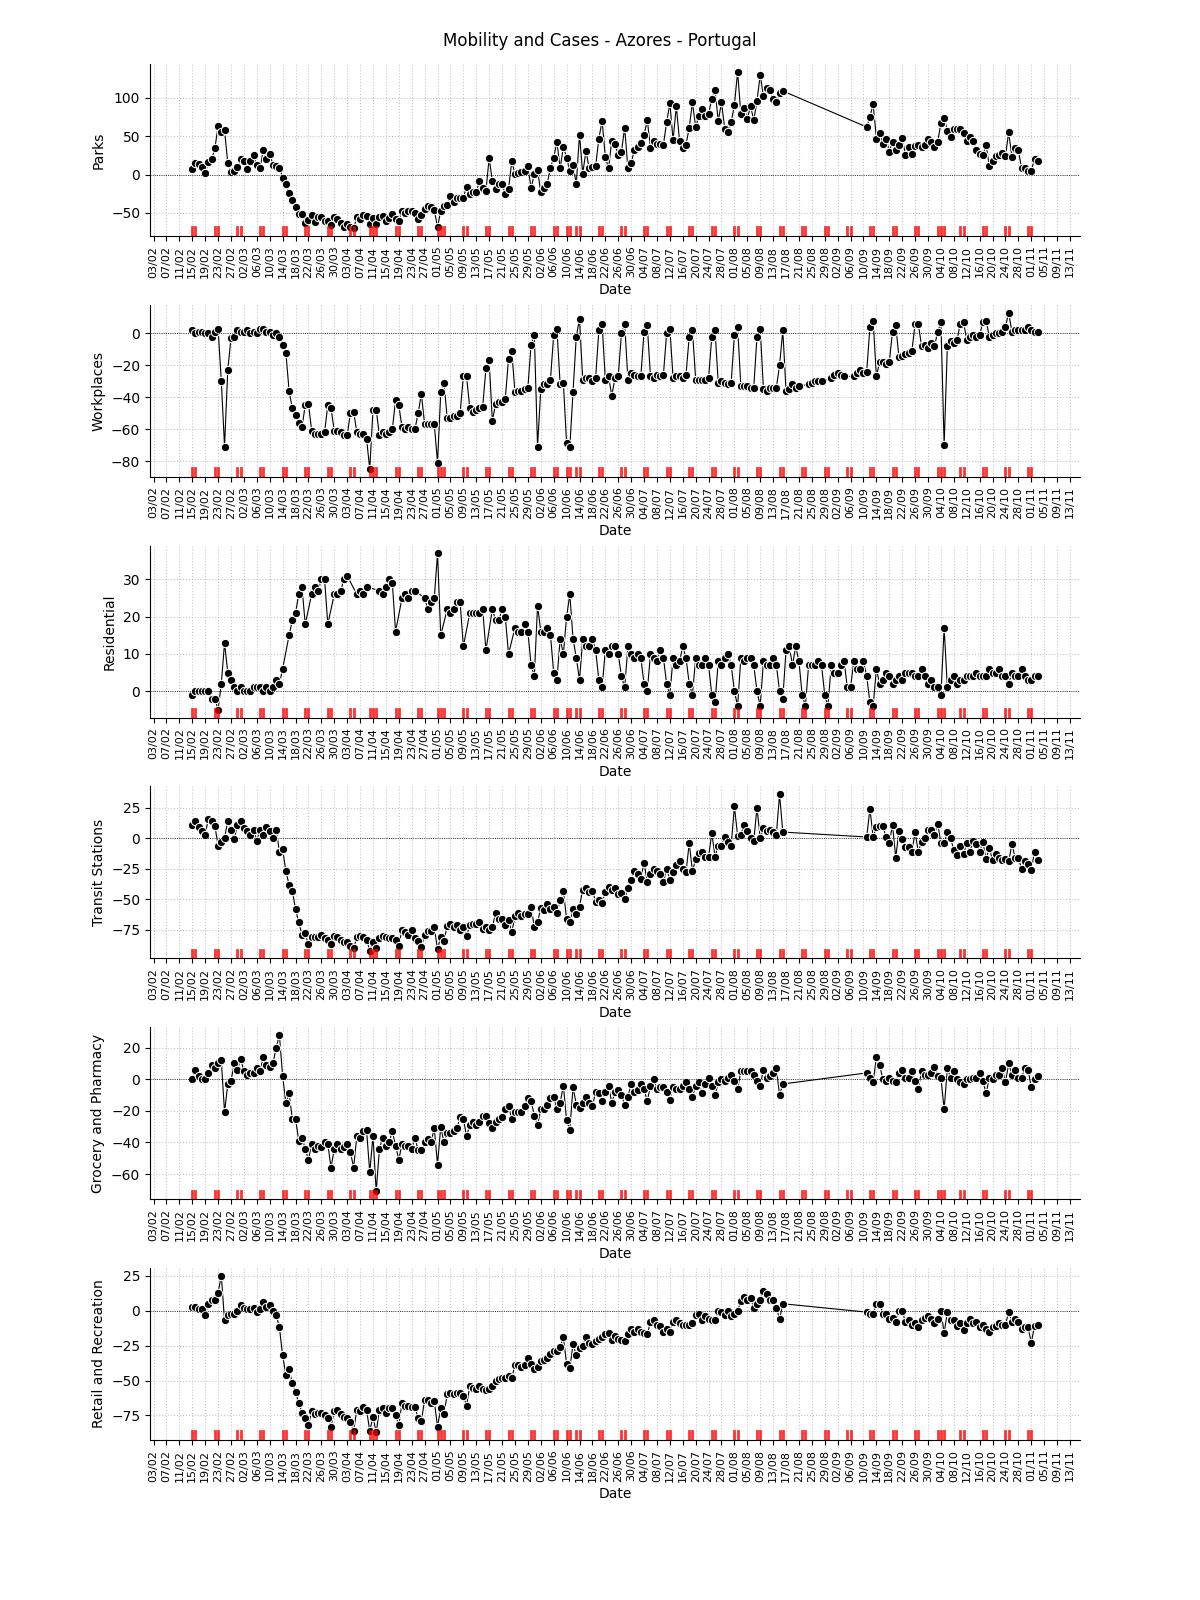
Mobility region: Azores
Mobility data for the sub-region
Note
This plot uses official mobility data from Google Community Mobility Reports. The red markers on the x-axis are weekends or holidays.
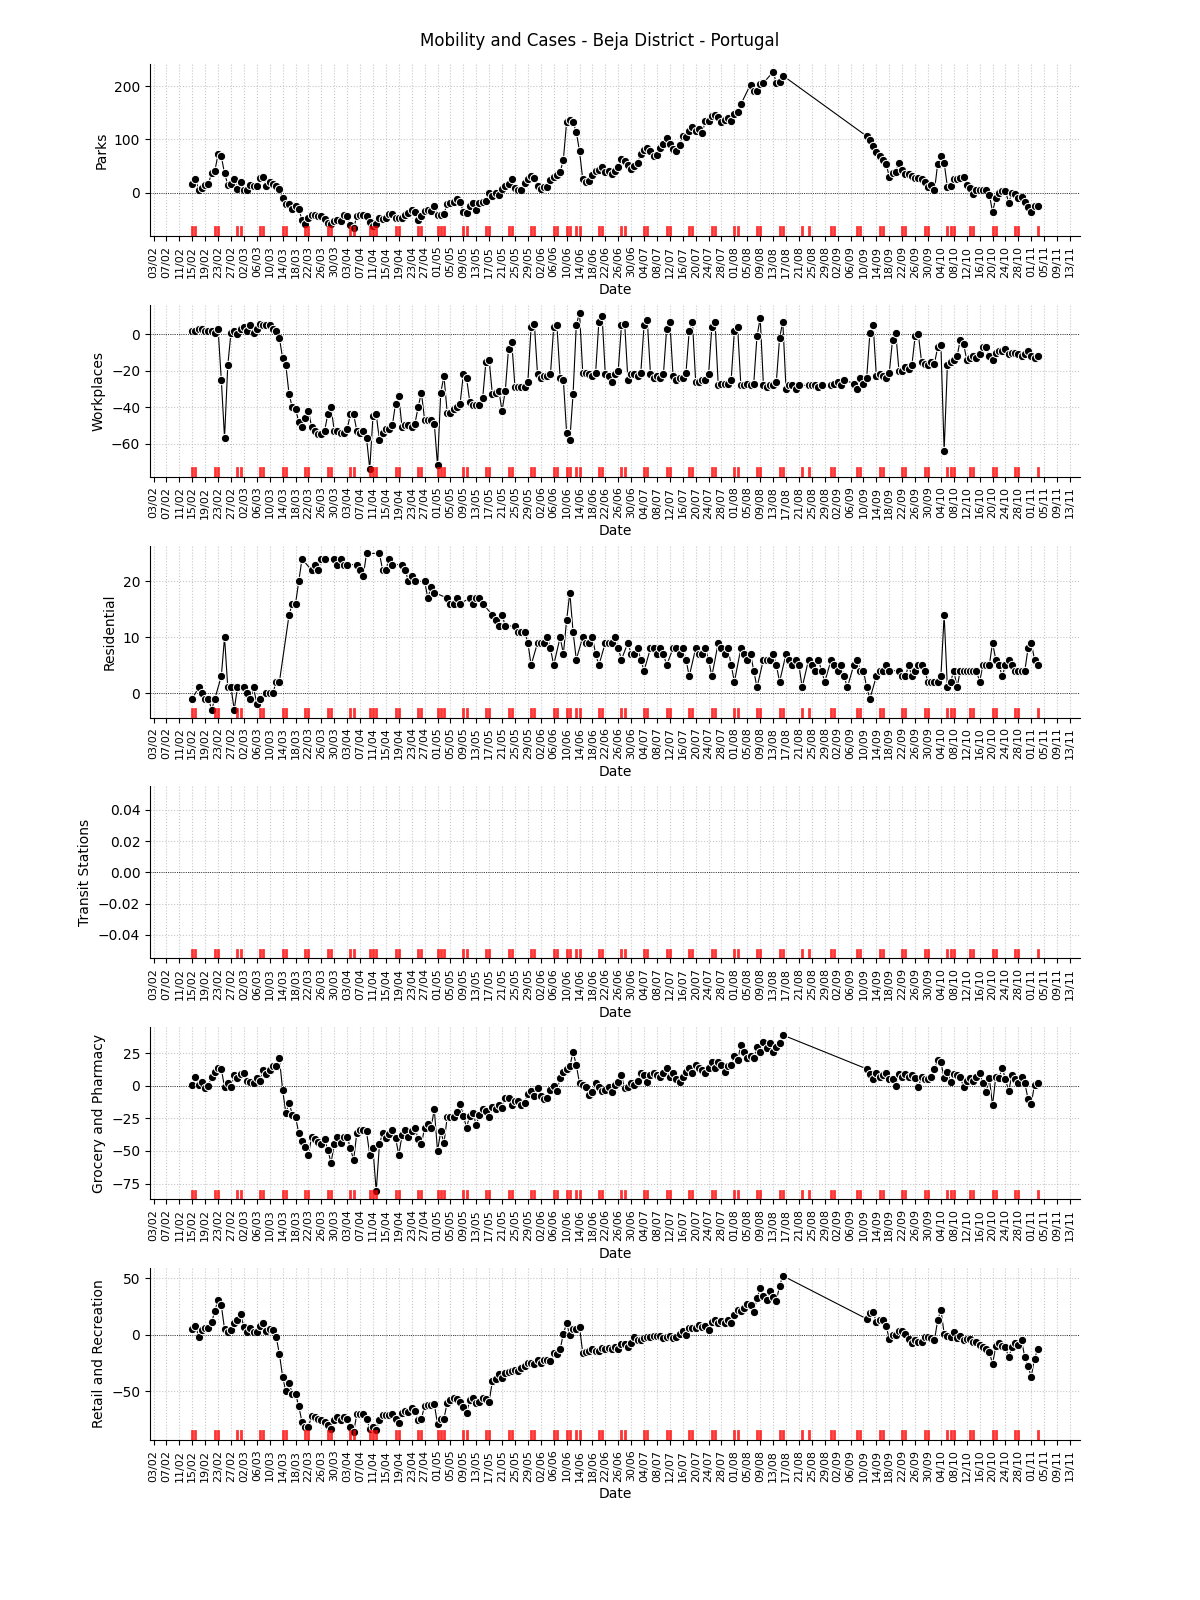
Mobility region: Beja District
Mobility data for the sub-region
Note
This plot uses official mobility data from Google Community Mobility Reports. The red markers on the x-axis are weekends or holidays.
Mobility region: Braga
Mobility data for the sub-region
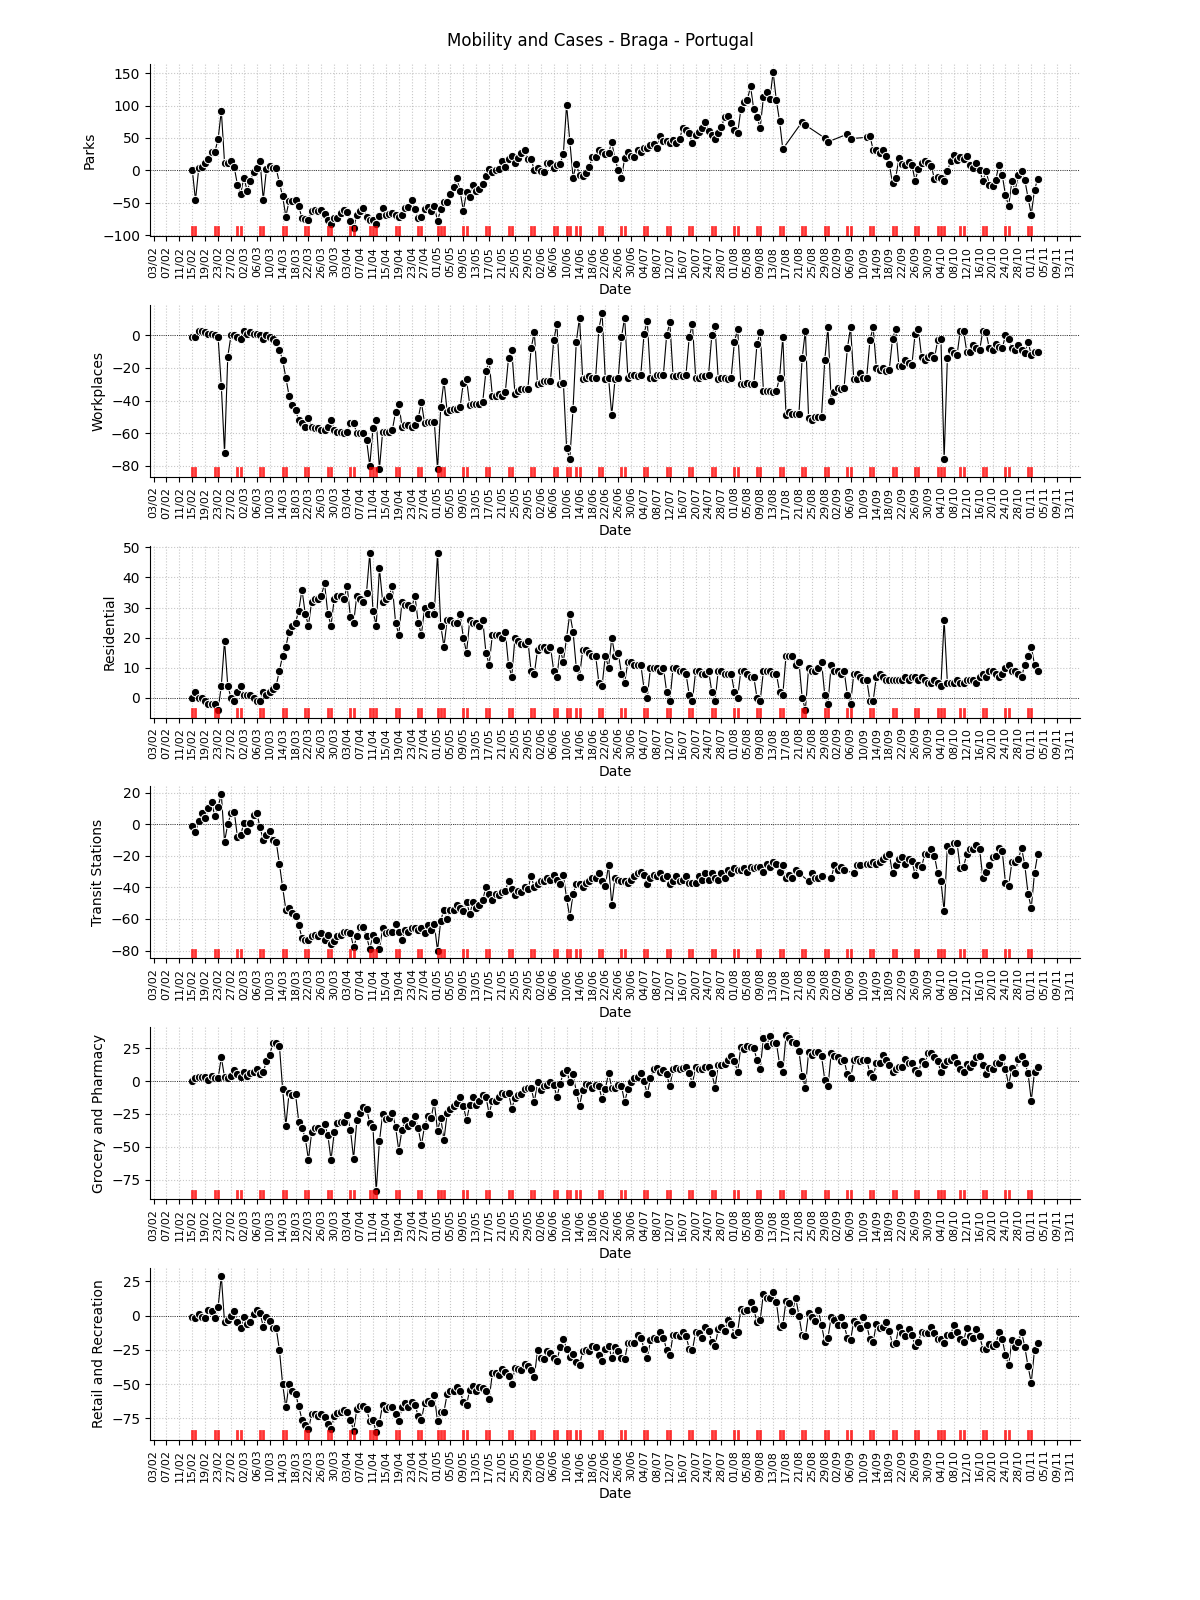
Note
This plot uses official mobility data from Google Community Mobility Reports. The red markers on the x-axis are weekends or holidays.
Mobility region: Bragança District
Mobility data for the sub-region
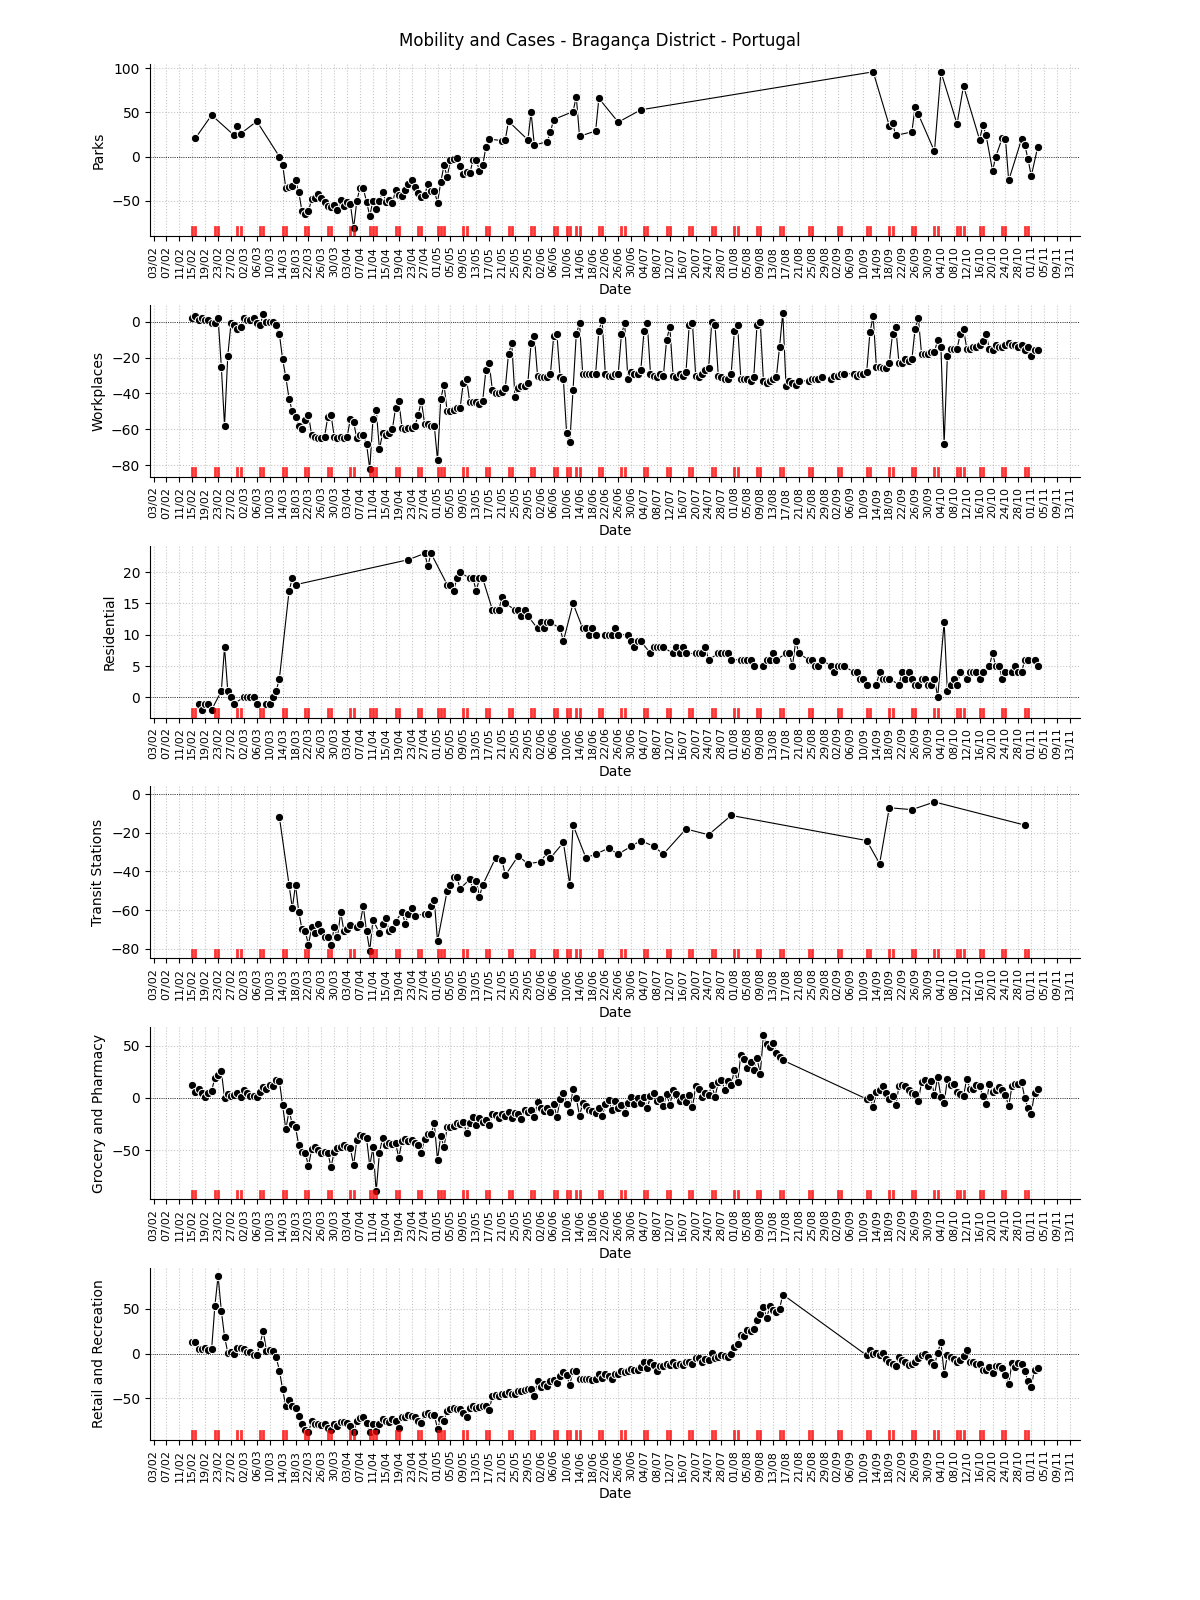
Note
This plot uses official mobility data from Google Community Mobility Reports. The red markers on the x-axis are weekends or holidays.
Mobility region: Castelo Branco District
Mobility data for the sub-region
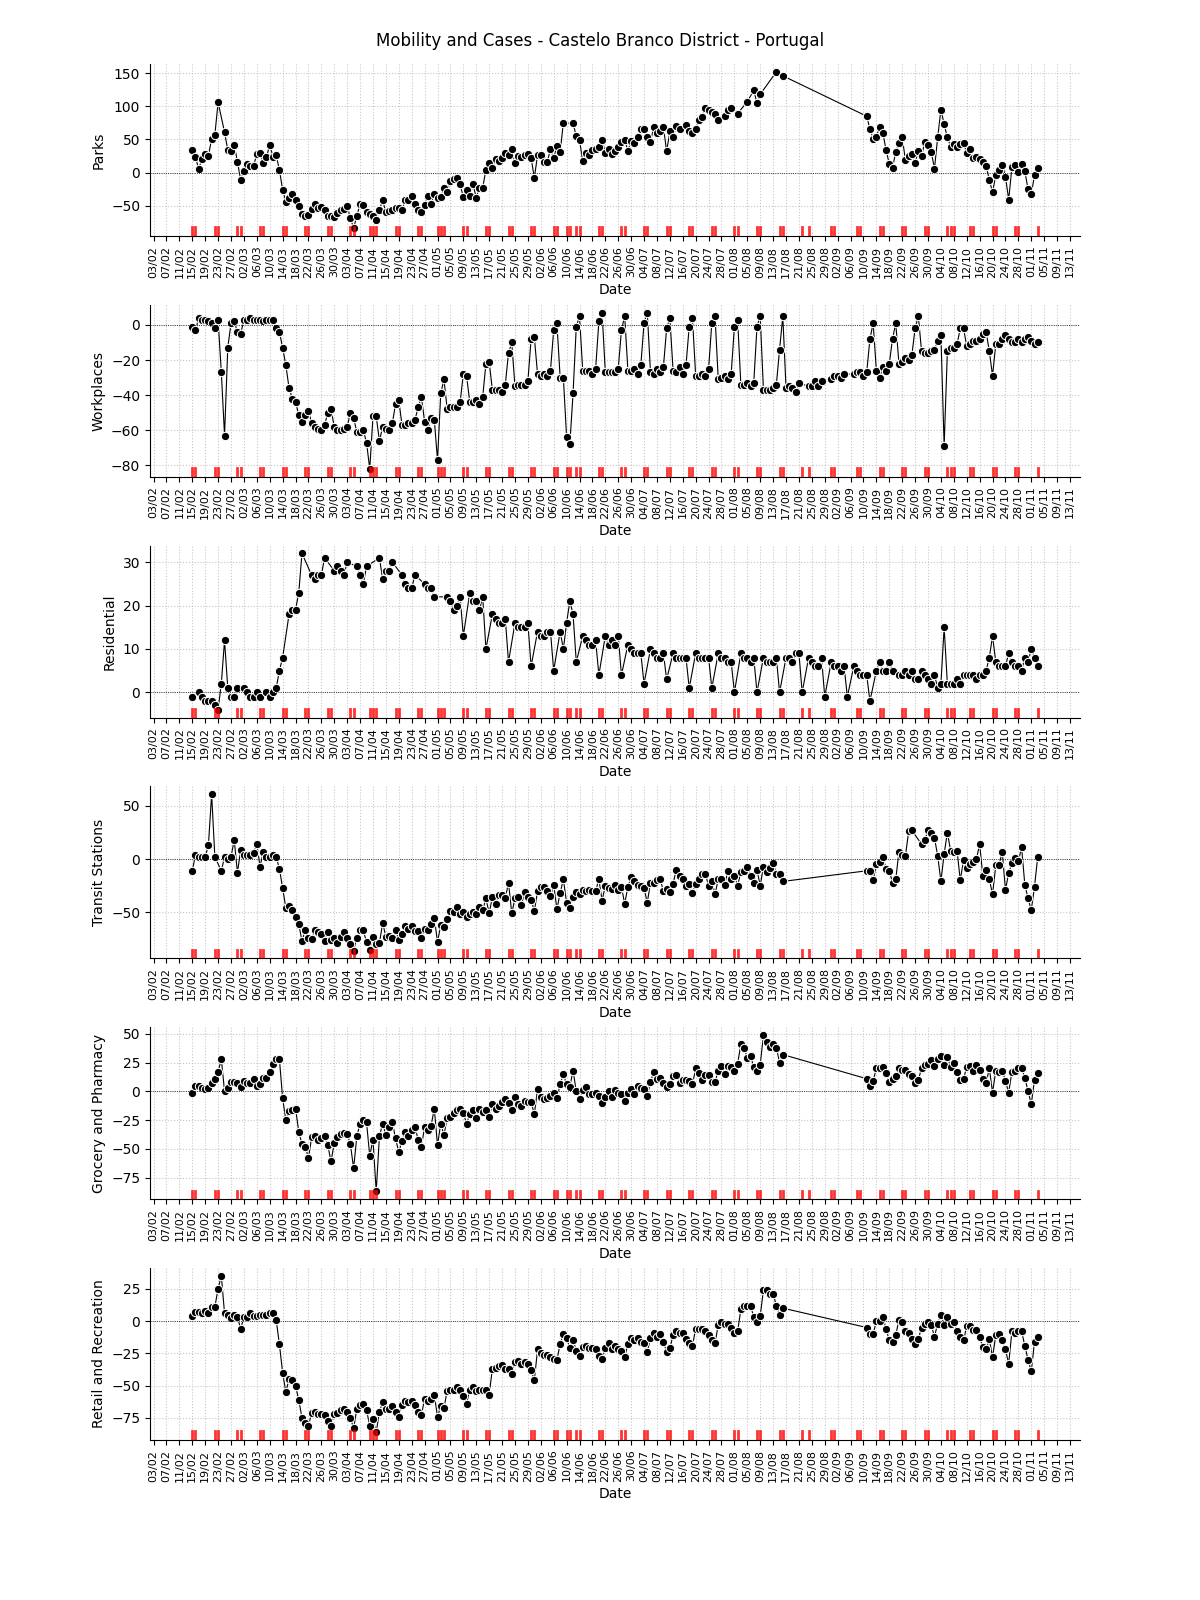
Note
This plot uses official mobility data from Google Community Mobility Reports. The red markers on the x-axis are weekends or holidays.
Mobility region: Coimbra District
Mobility data for the sub-region
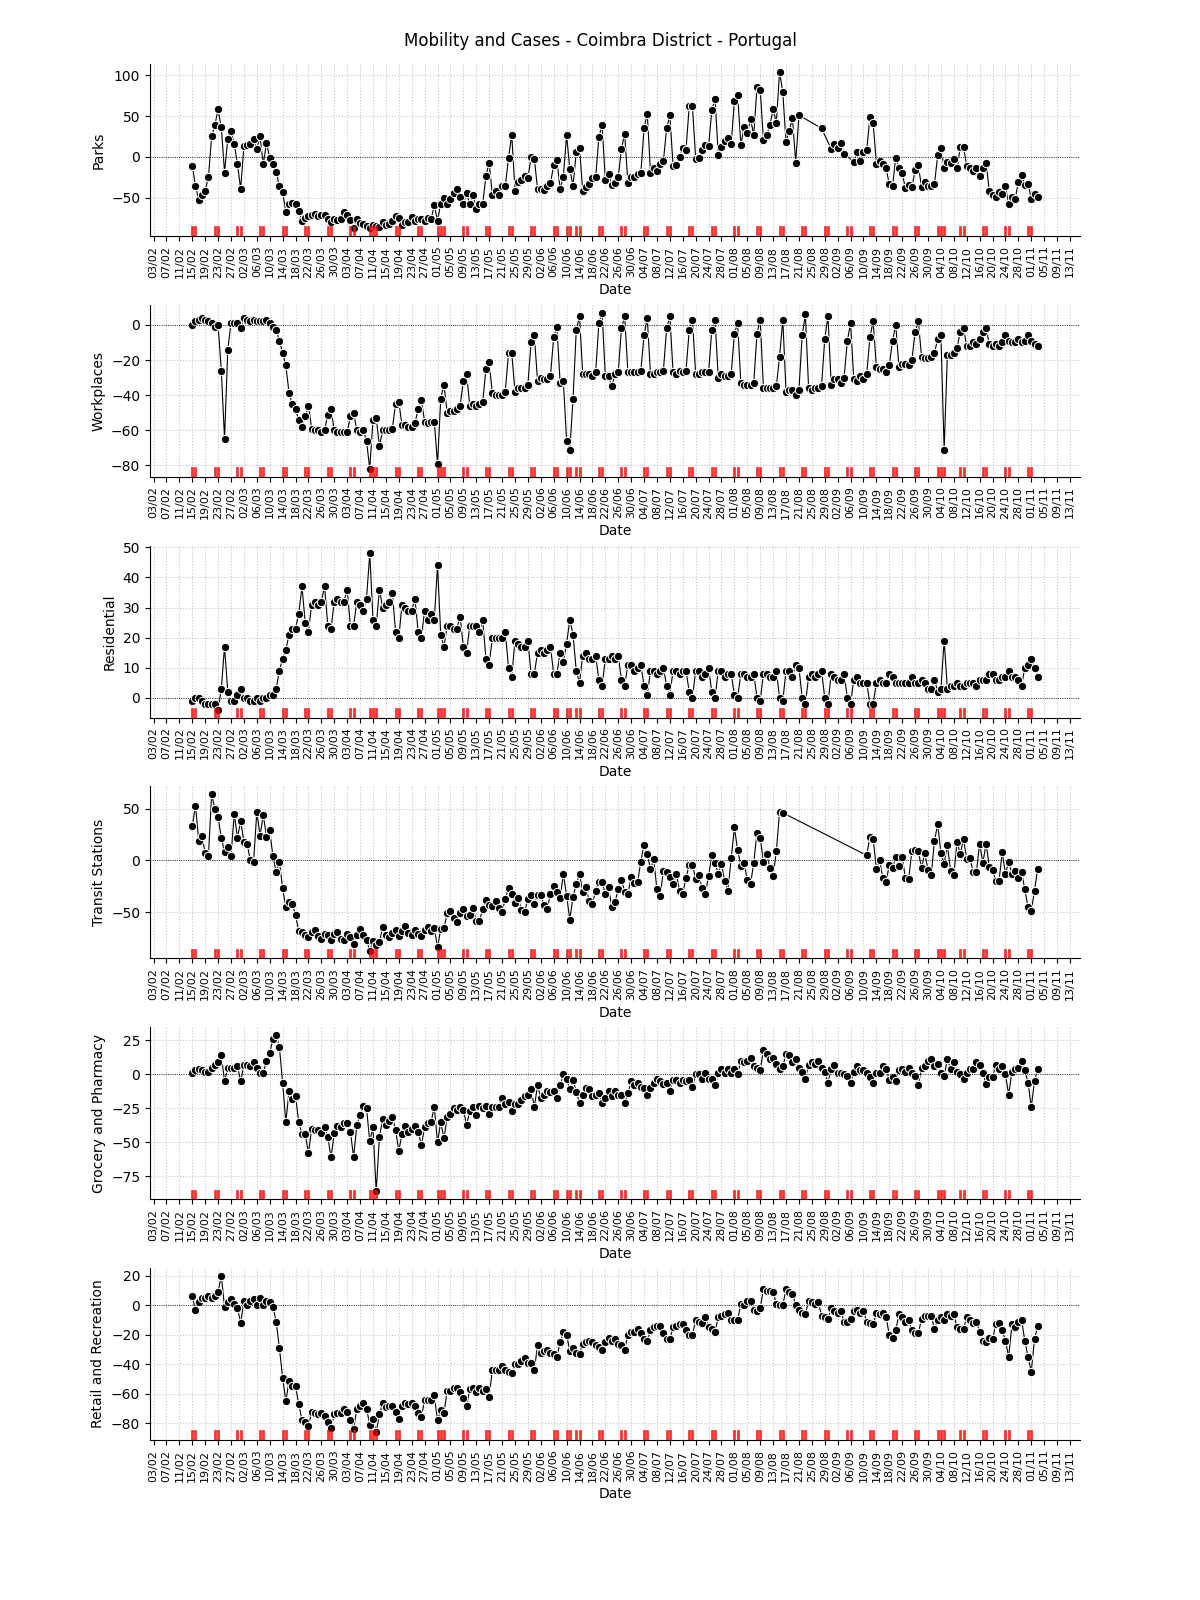
Note
This plot uses official mobility data from Google Community Mobility Reports. The red markers on the x-axis are weekends or holidays.
Mobility region: Évora District
Mobility data for the sub-region
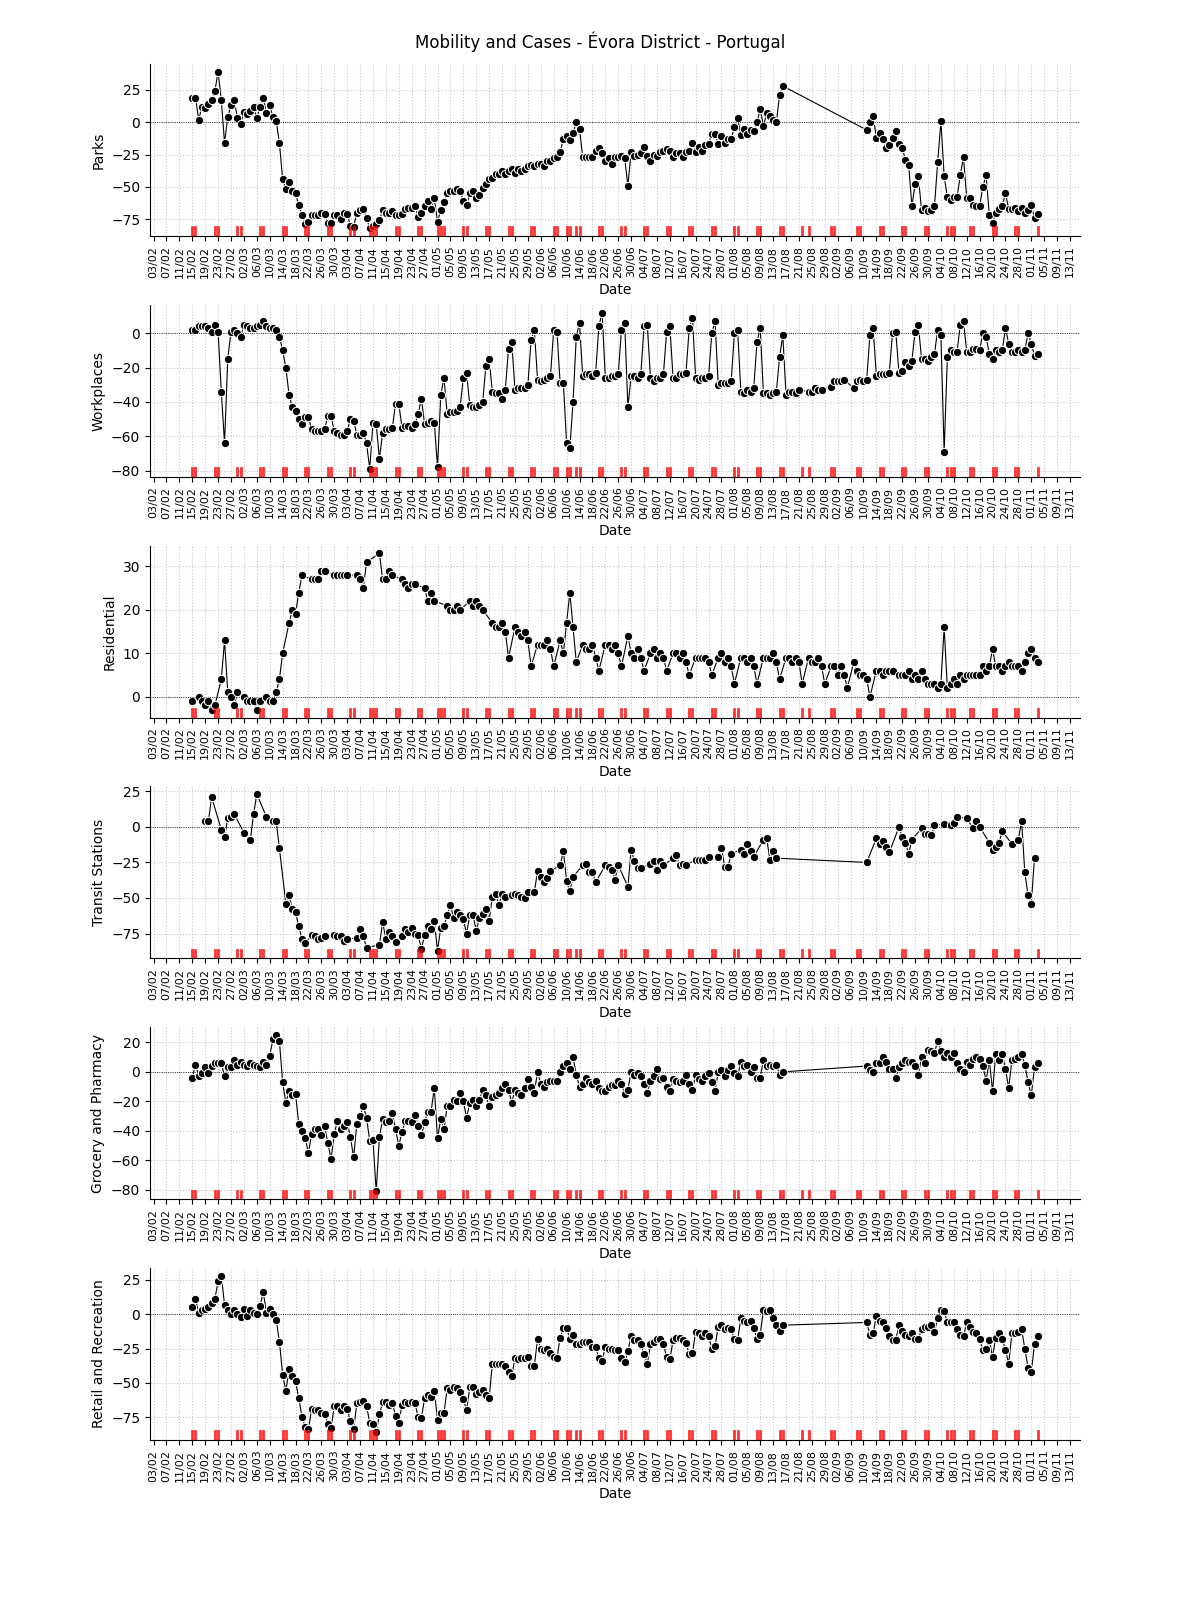
Note
This plot uses official mobility data from Google Community Mobility Reports. The red markers on the x-axis are weekends or holidays.
Mobility region: Faro District
Mobility data for the sub-region
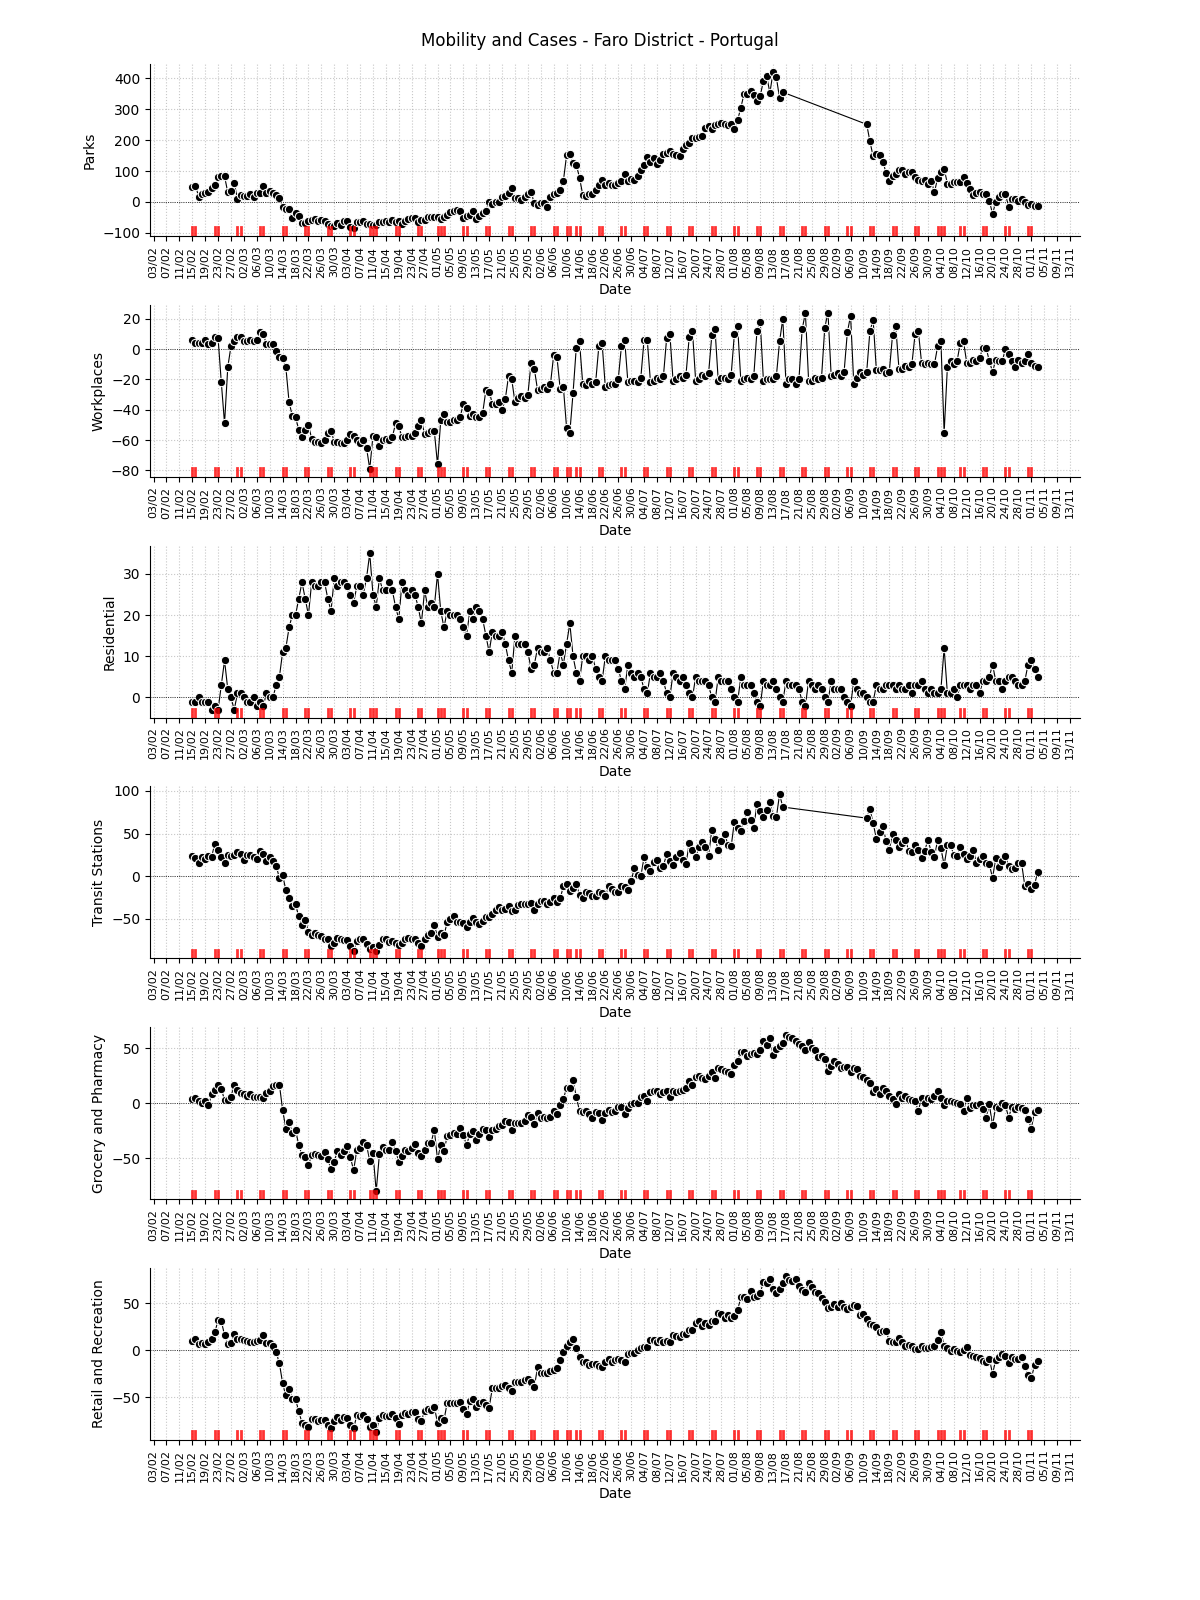
Note
This plot uses official mobility data from Google Community Mobility Reports. The red markers on the x-axis are weekends or holidays.
Mobility region: Guarda District
Mobility data for the sub-region
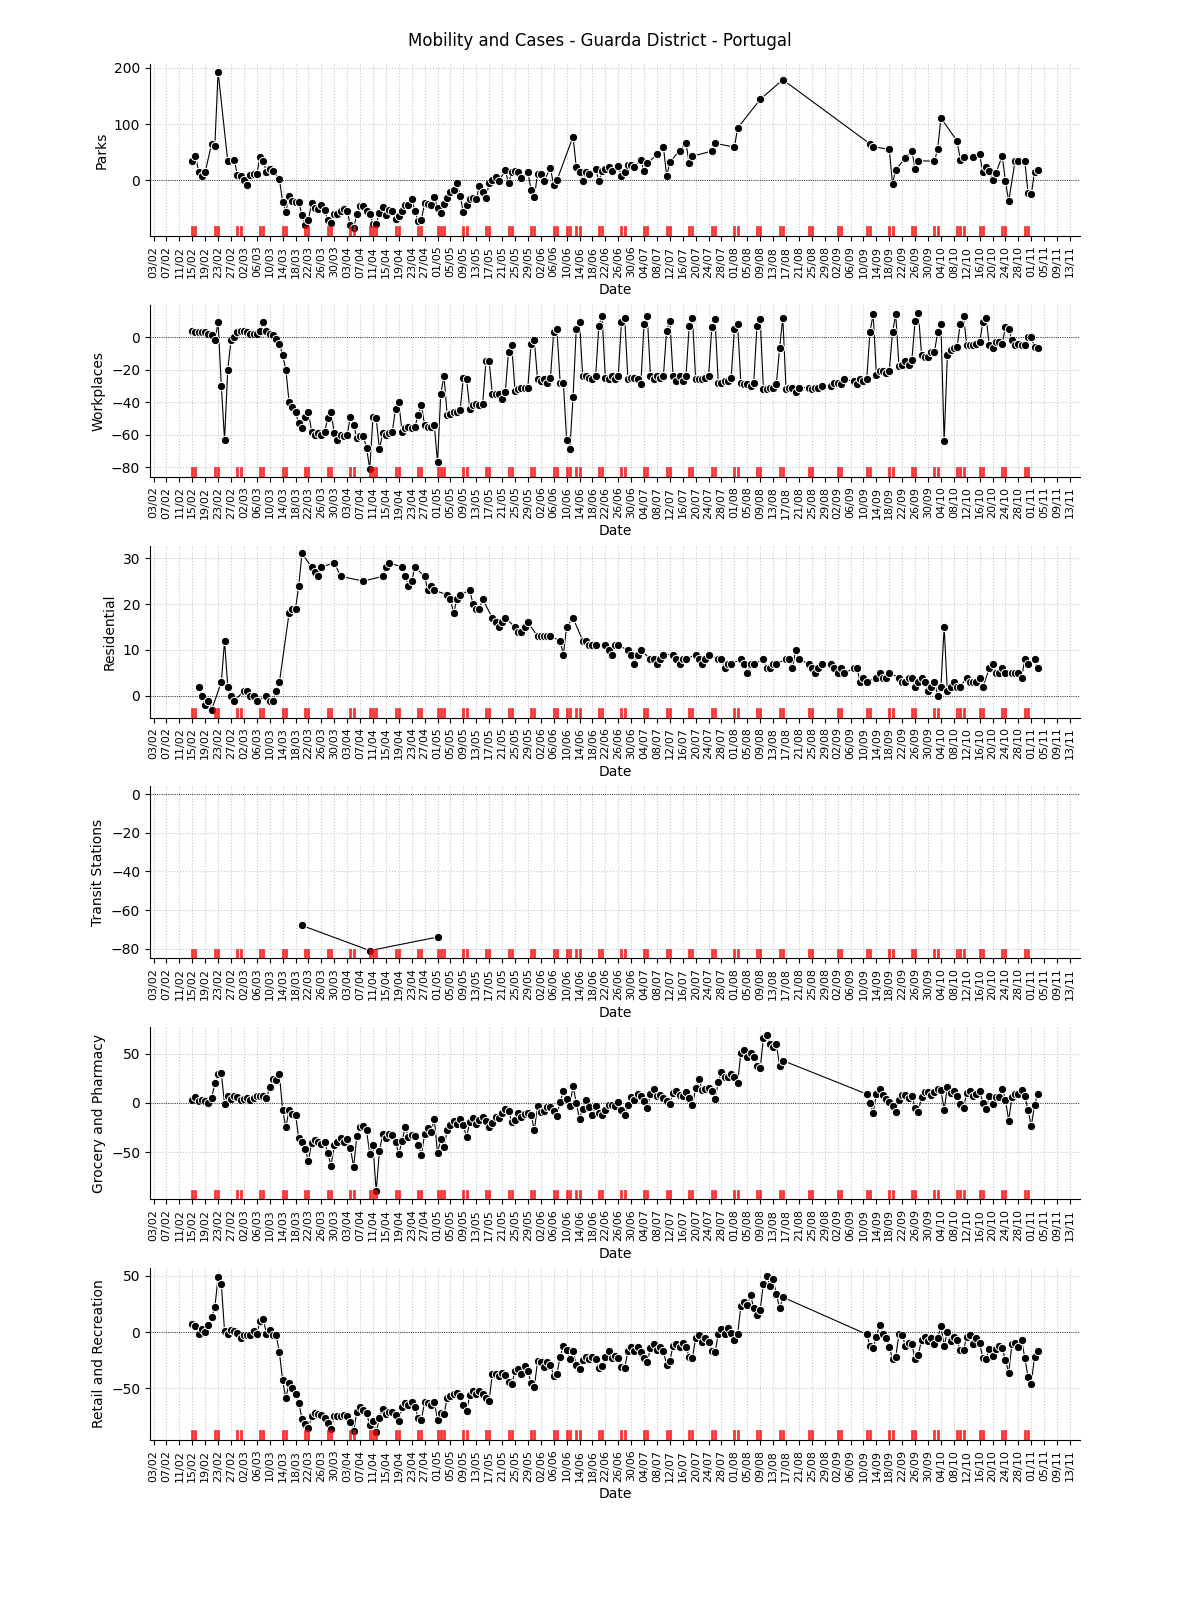
Note
This plot uses official mobility data from Google Community Mobility Reports. The red markers on the x-axis are weekends or holidays.
Mobility region: Leiria District
Mobility data for the sub-region
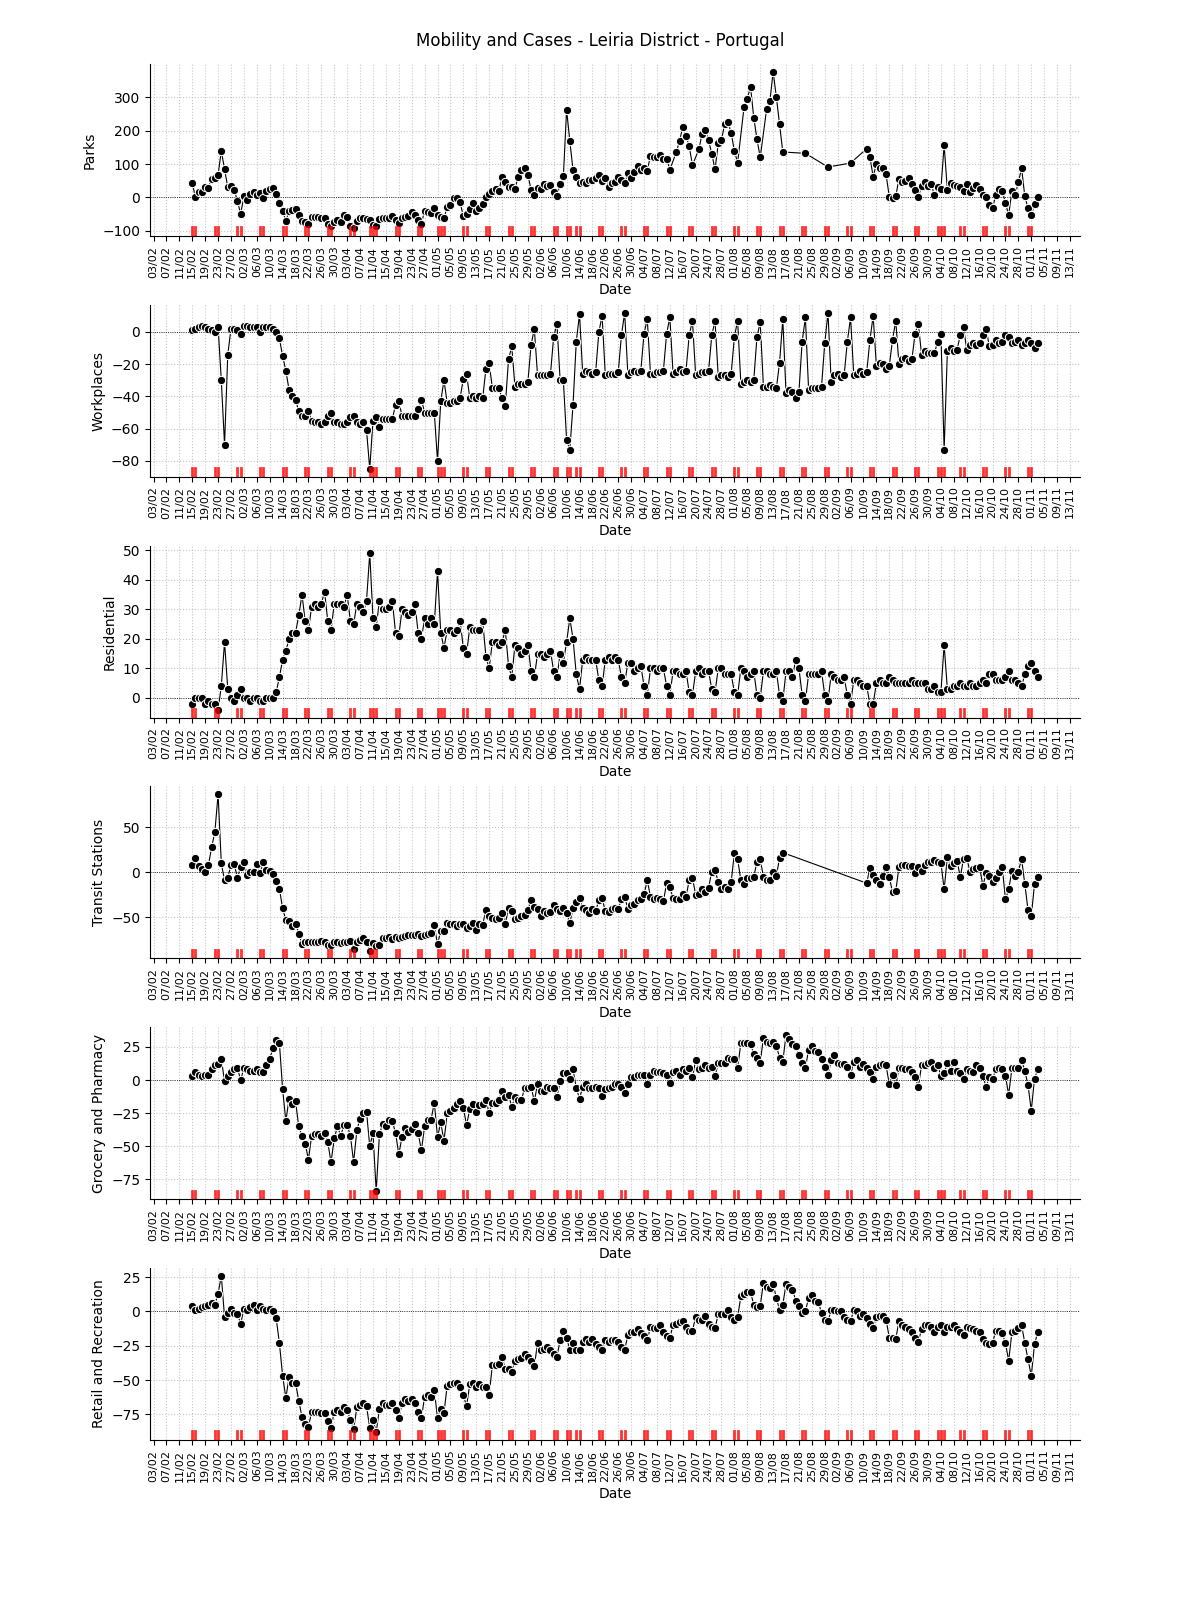
Note
This plot uses official mobility data from Google Community Mobility Reports. The red markers on the x-axis are weekends or holidays.
Mobility region: Lisbon
Mobility data for the sub-region
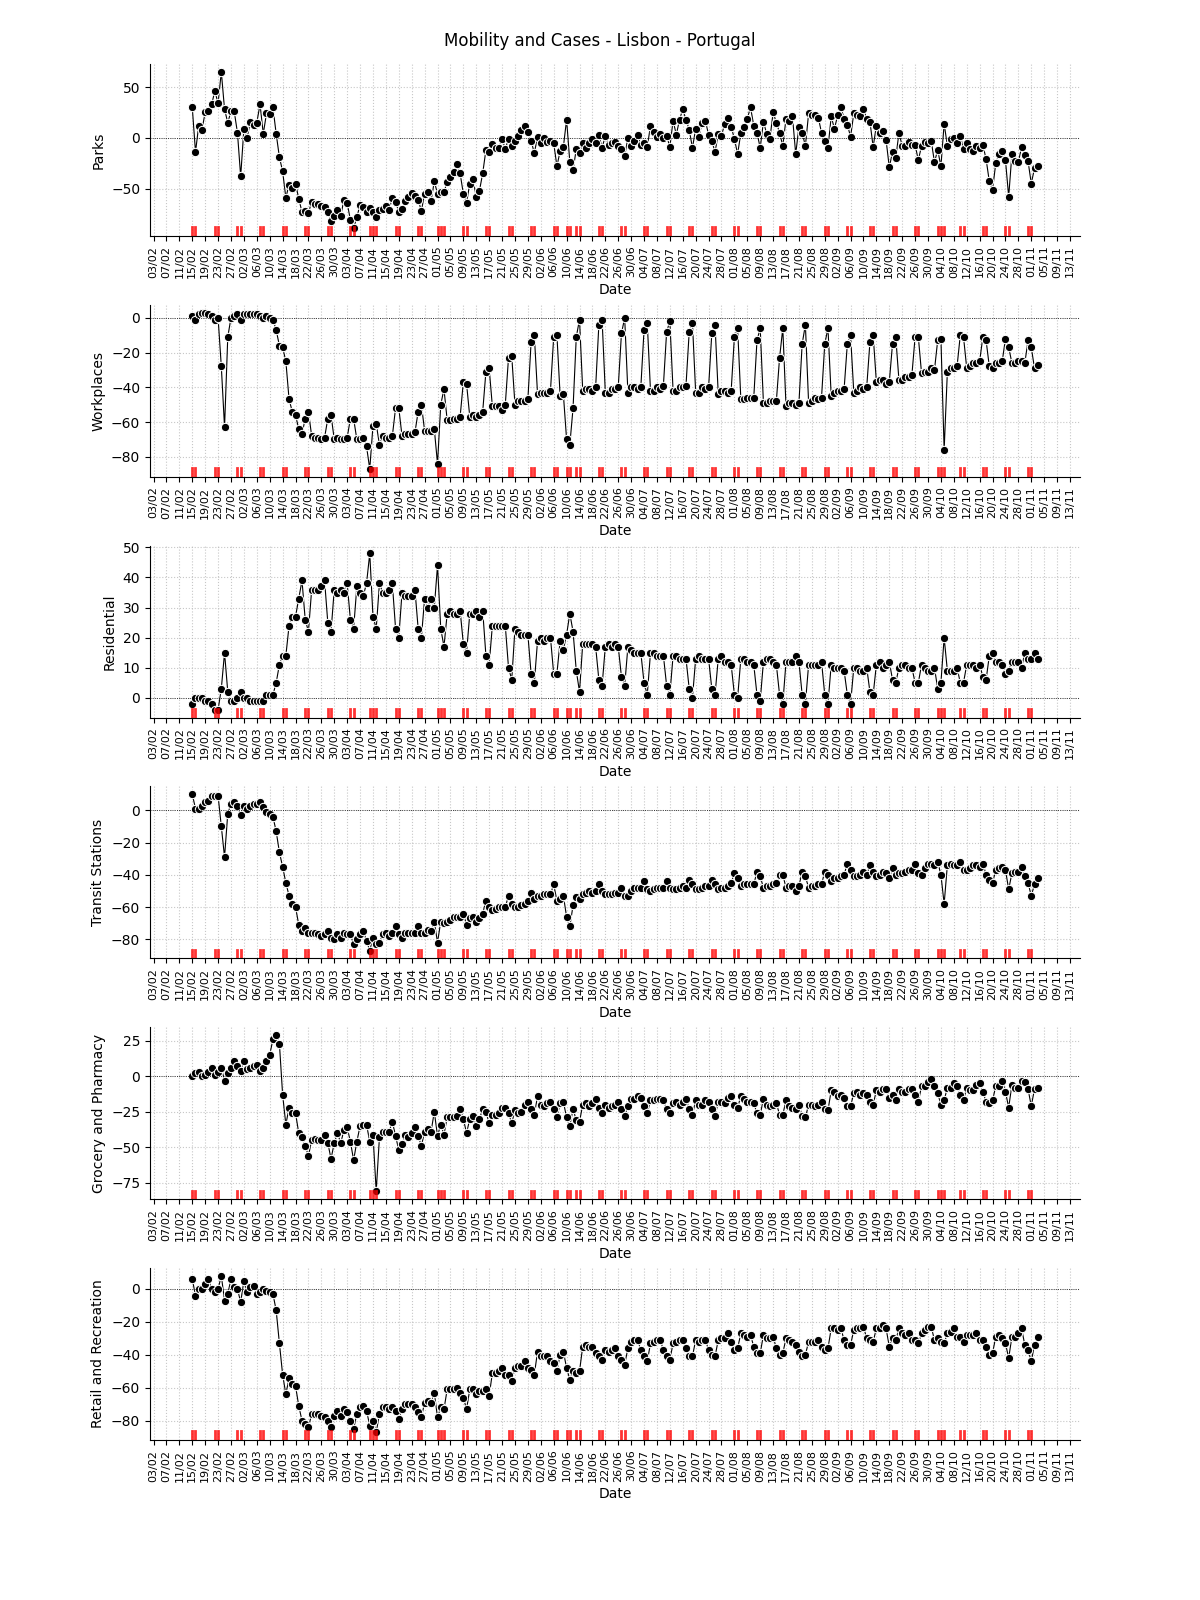
Note
This plot uses official mobility data from Google Community Mobility Reports. The red markers on the x-axis are weekends or holidays.
Mobility region: Madeira
Mobility data for the sub-region
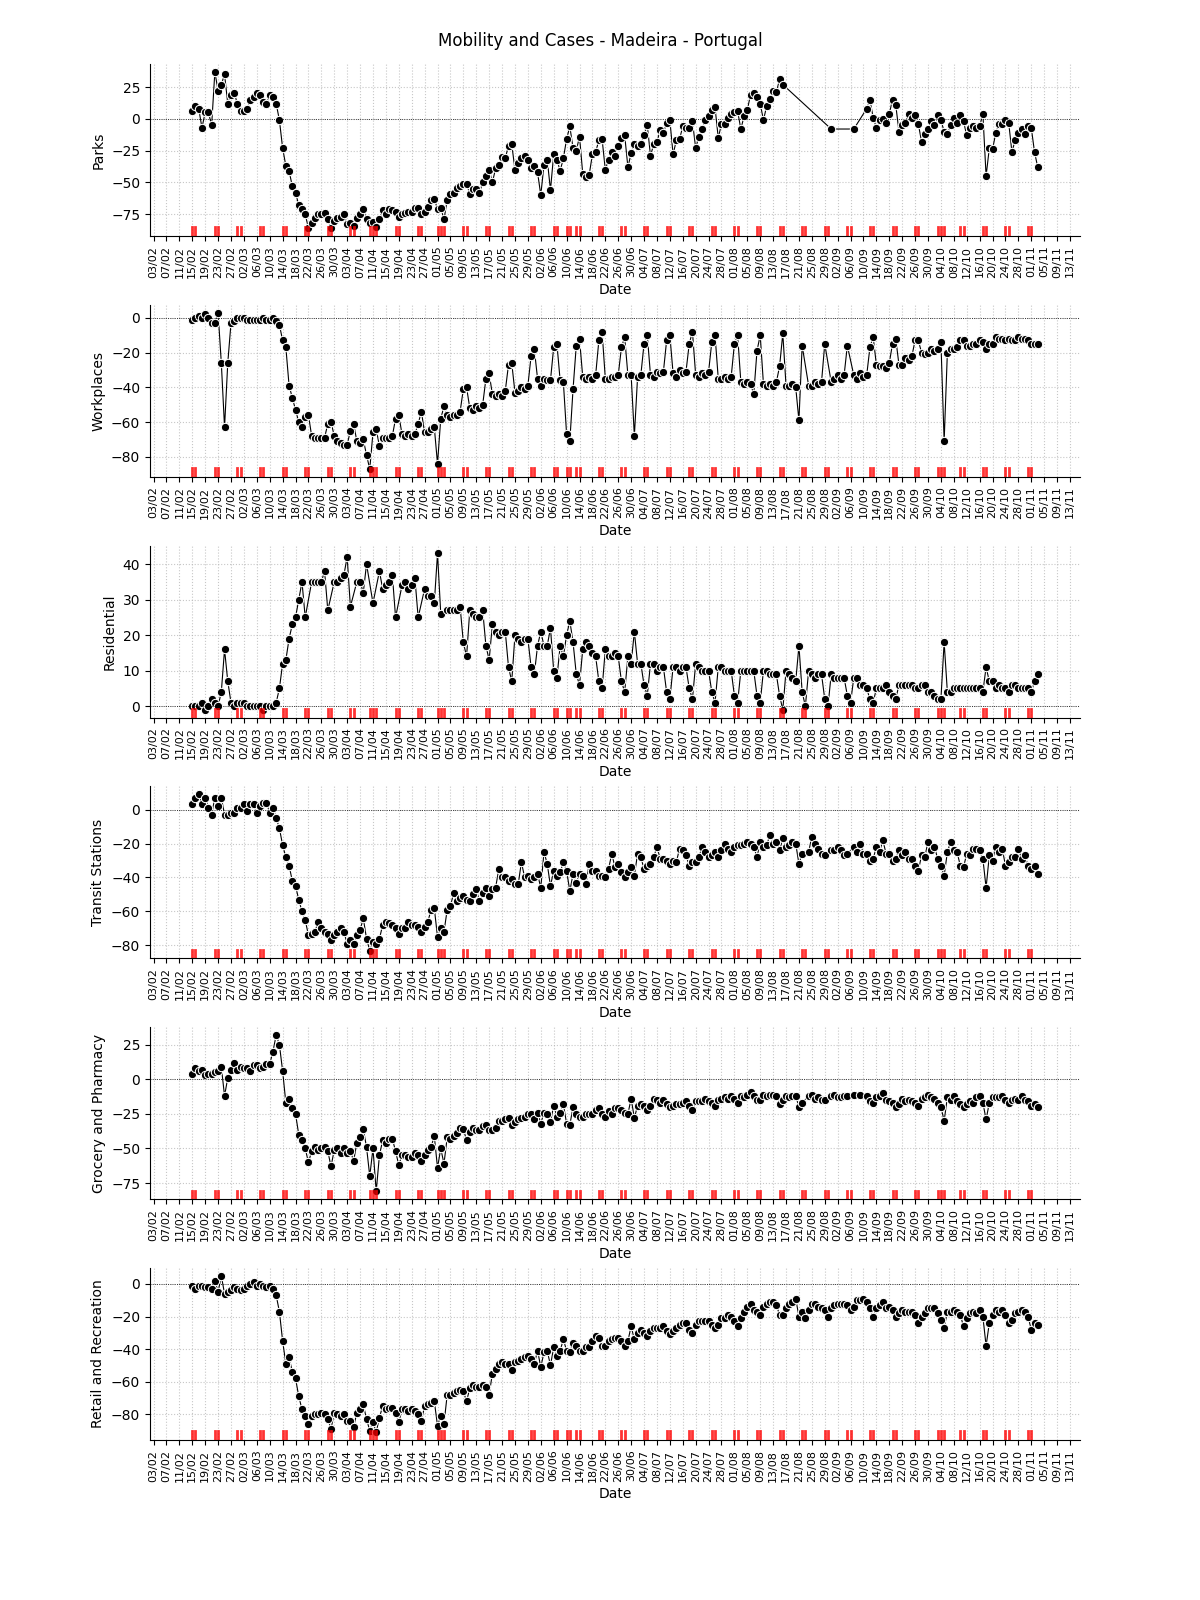
Note
This plot uses official mobility data from Google Community Mobility Reports. The red markers on the x-axis are weekends or holidays.
Mobility region: Portalegre District
Mobility data for the sub-region
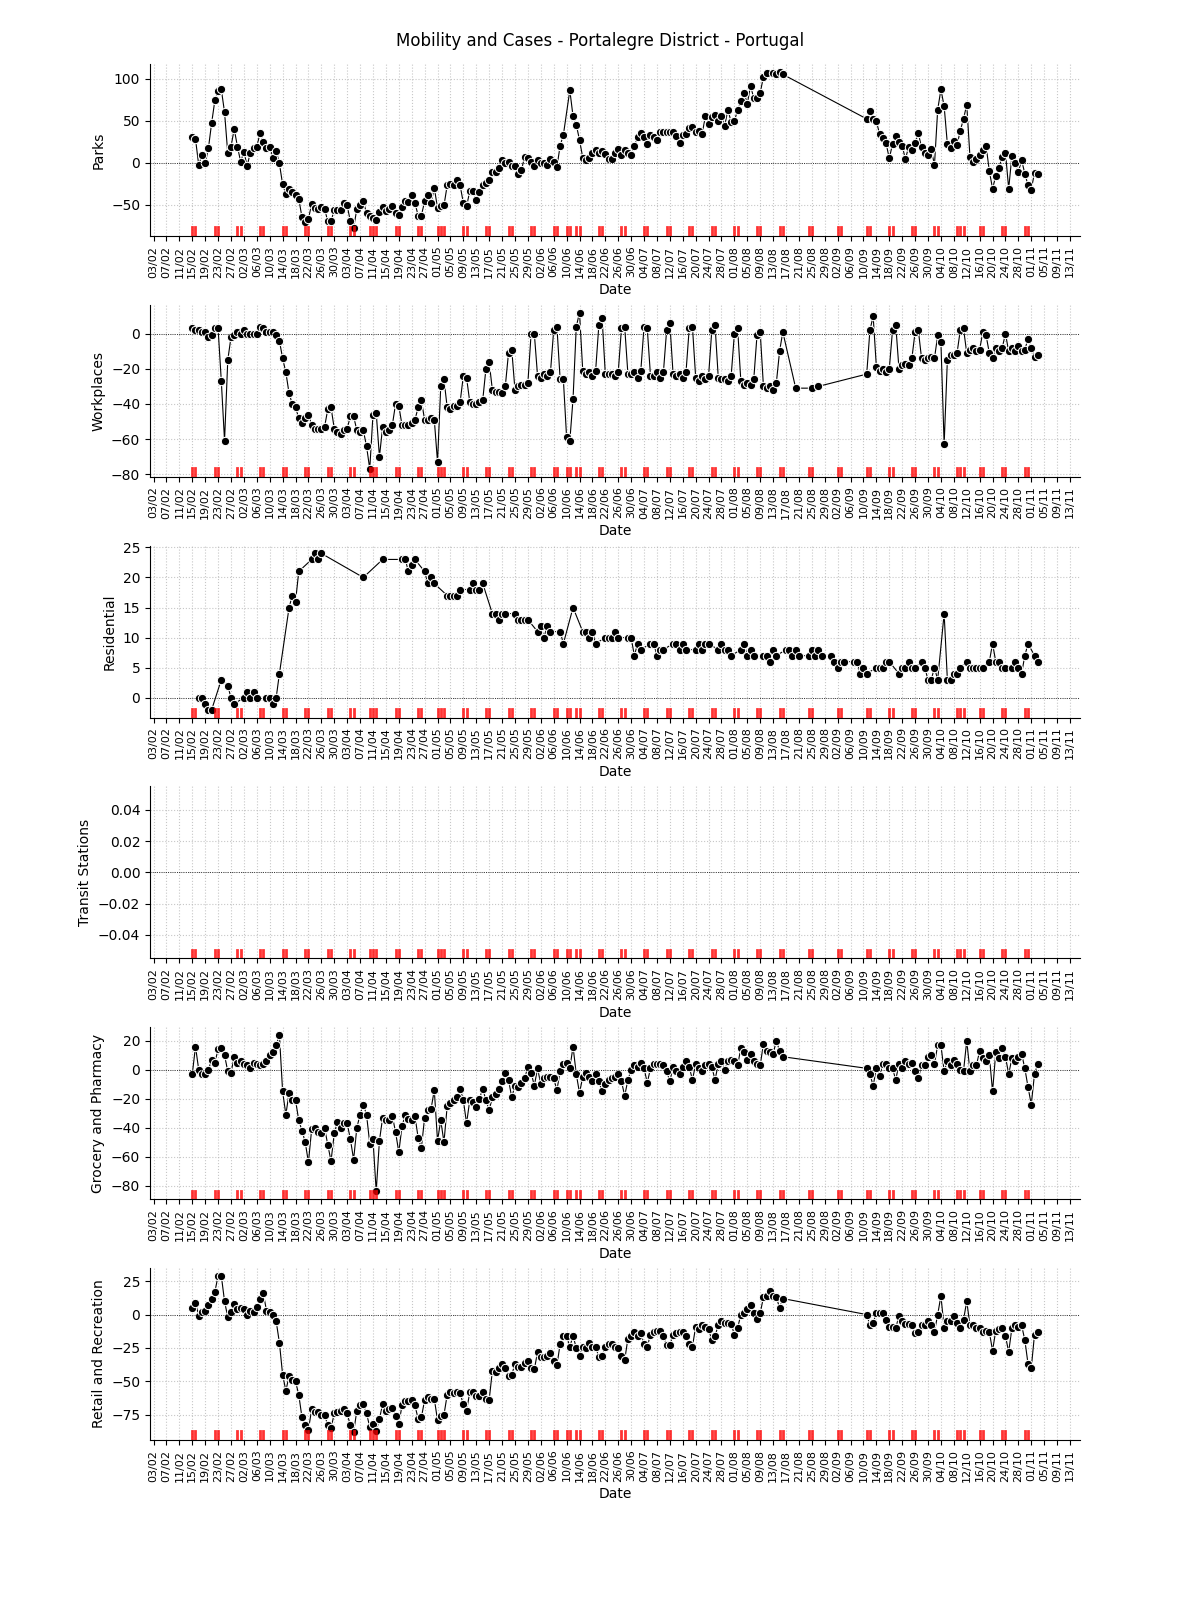
Note
This plot uses official mobility data from Google Community Mobility Reports. The red markers on the x-axis are weekends or holidays.
Mobility region: Porto District
Mobility data for the sub-region
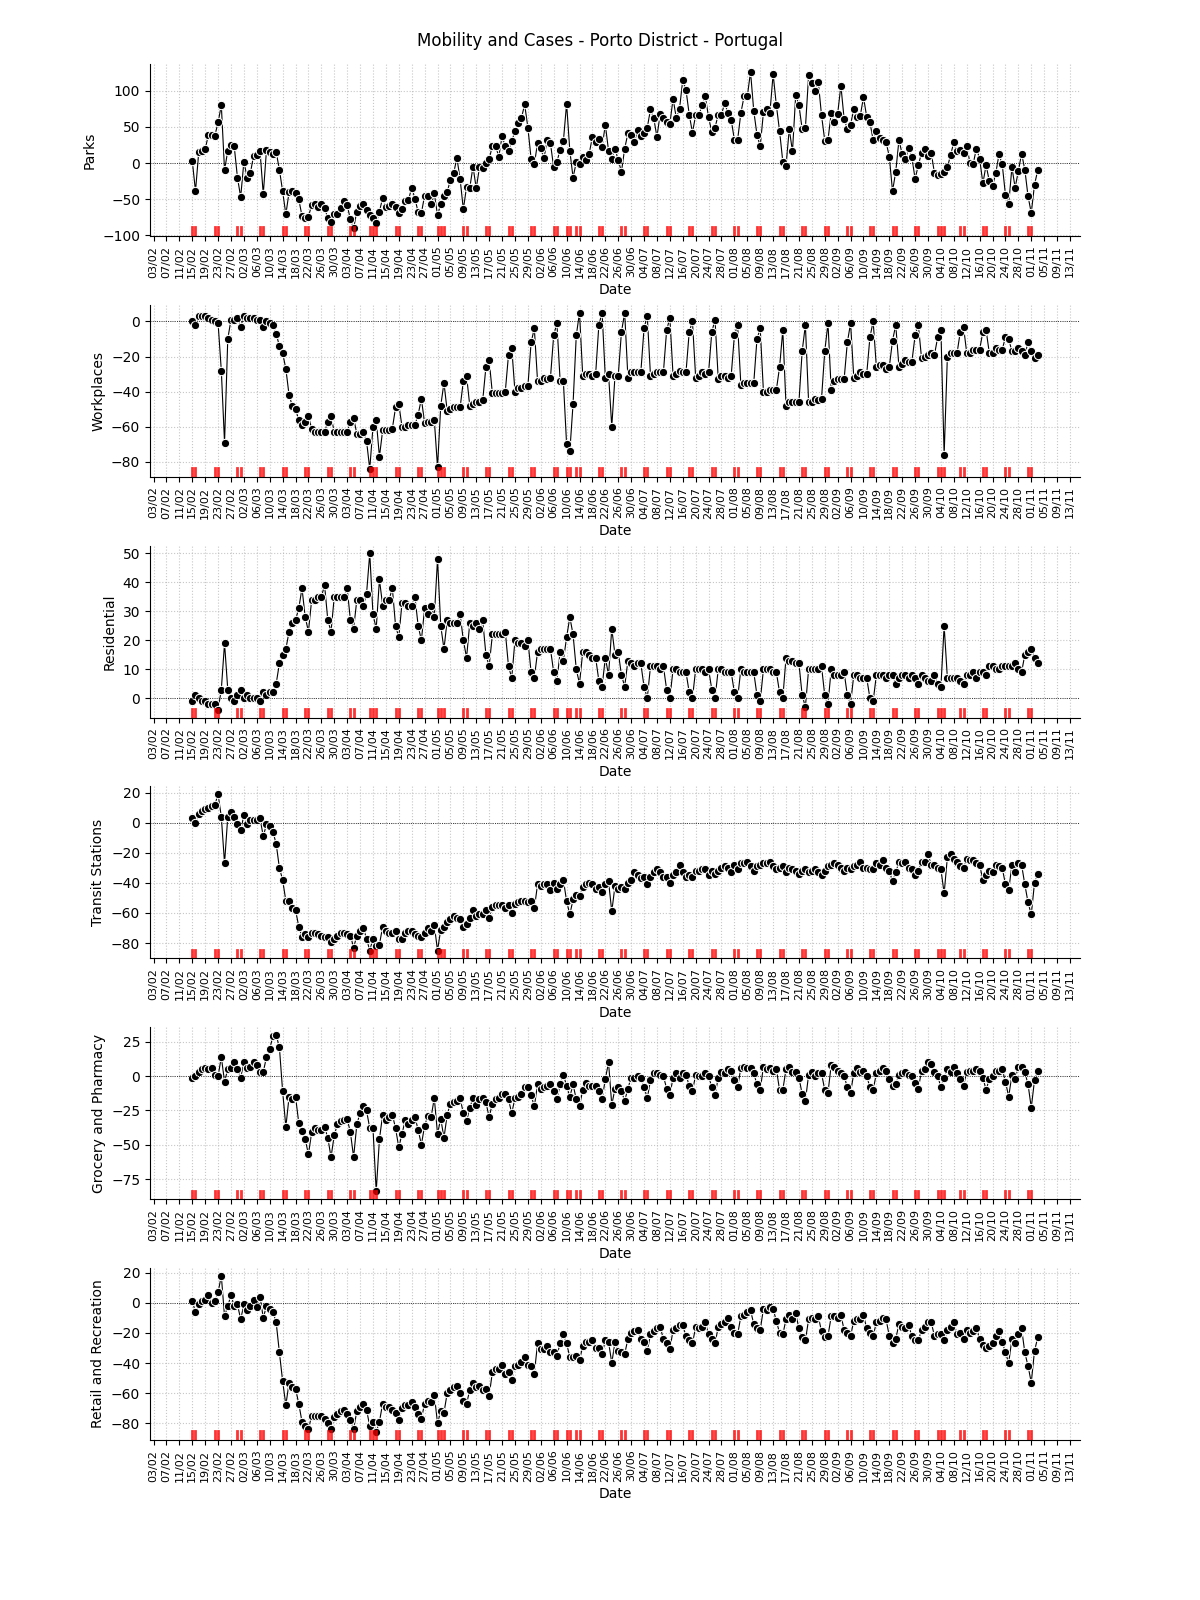
Note
This plot uses official mobility data from Google Community Mobility Reports. The red markers on the x-axis are weekends or holidays.
Mobility region: Santarém District
Mobility data for the sub-region
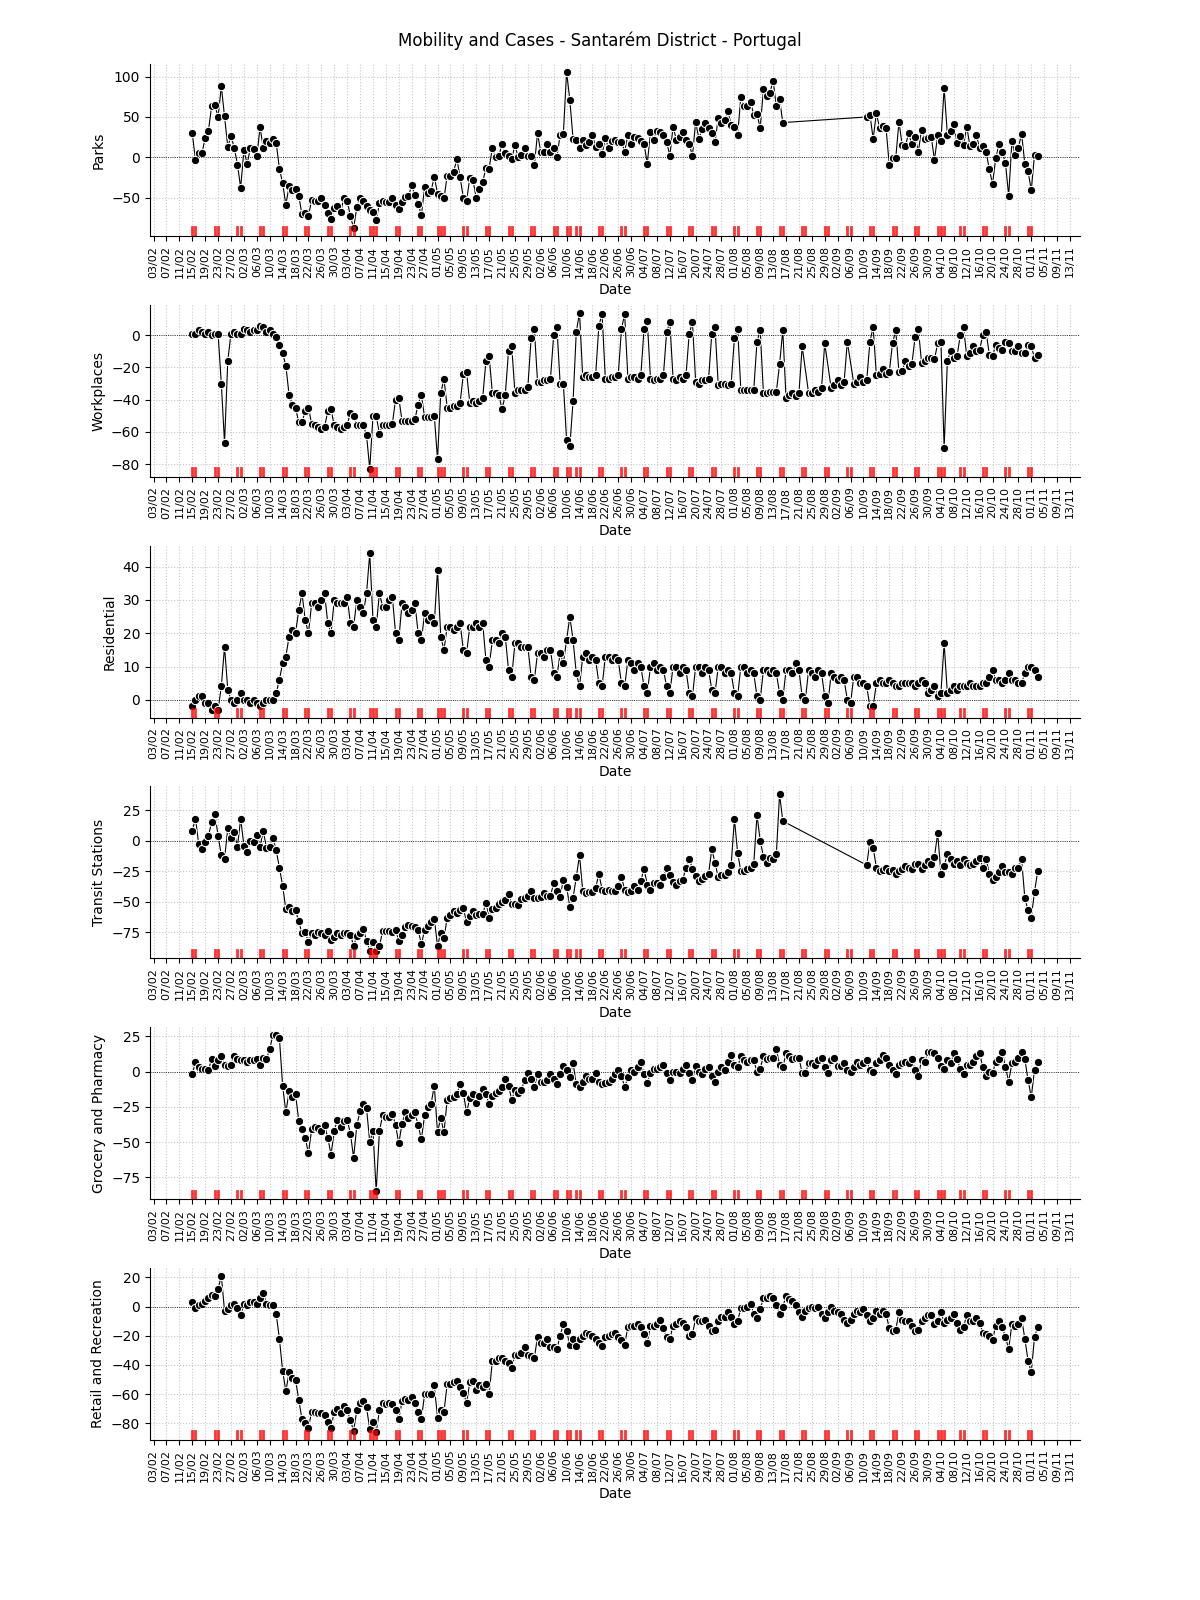
Note
This plot uses official mobility data from Google Community Mobility Reports. The red markers on the x-axis are weekends or holidays.
Mobility region: Setubal
Mobility data for the sub-region
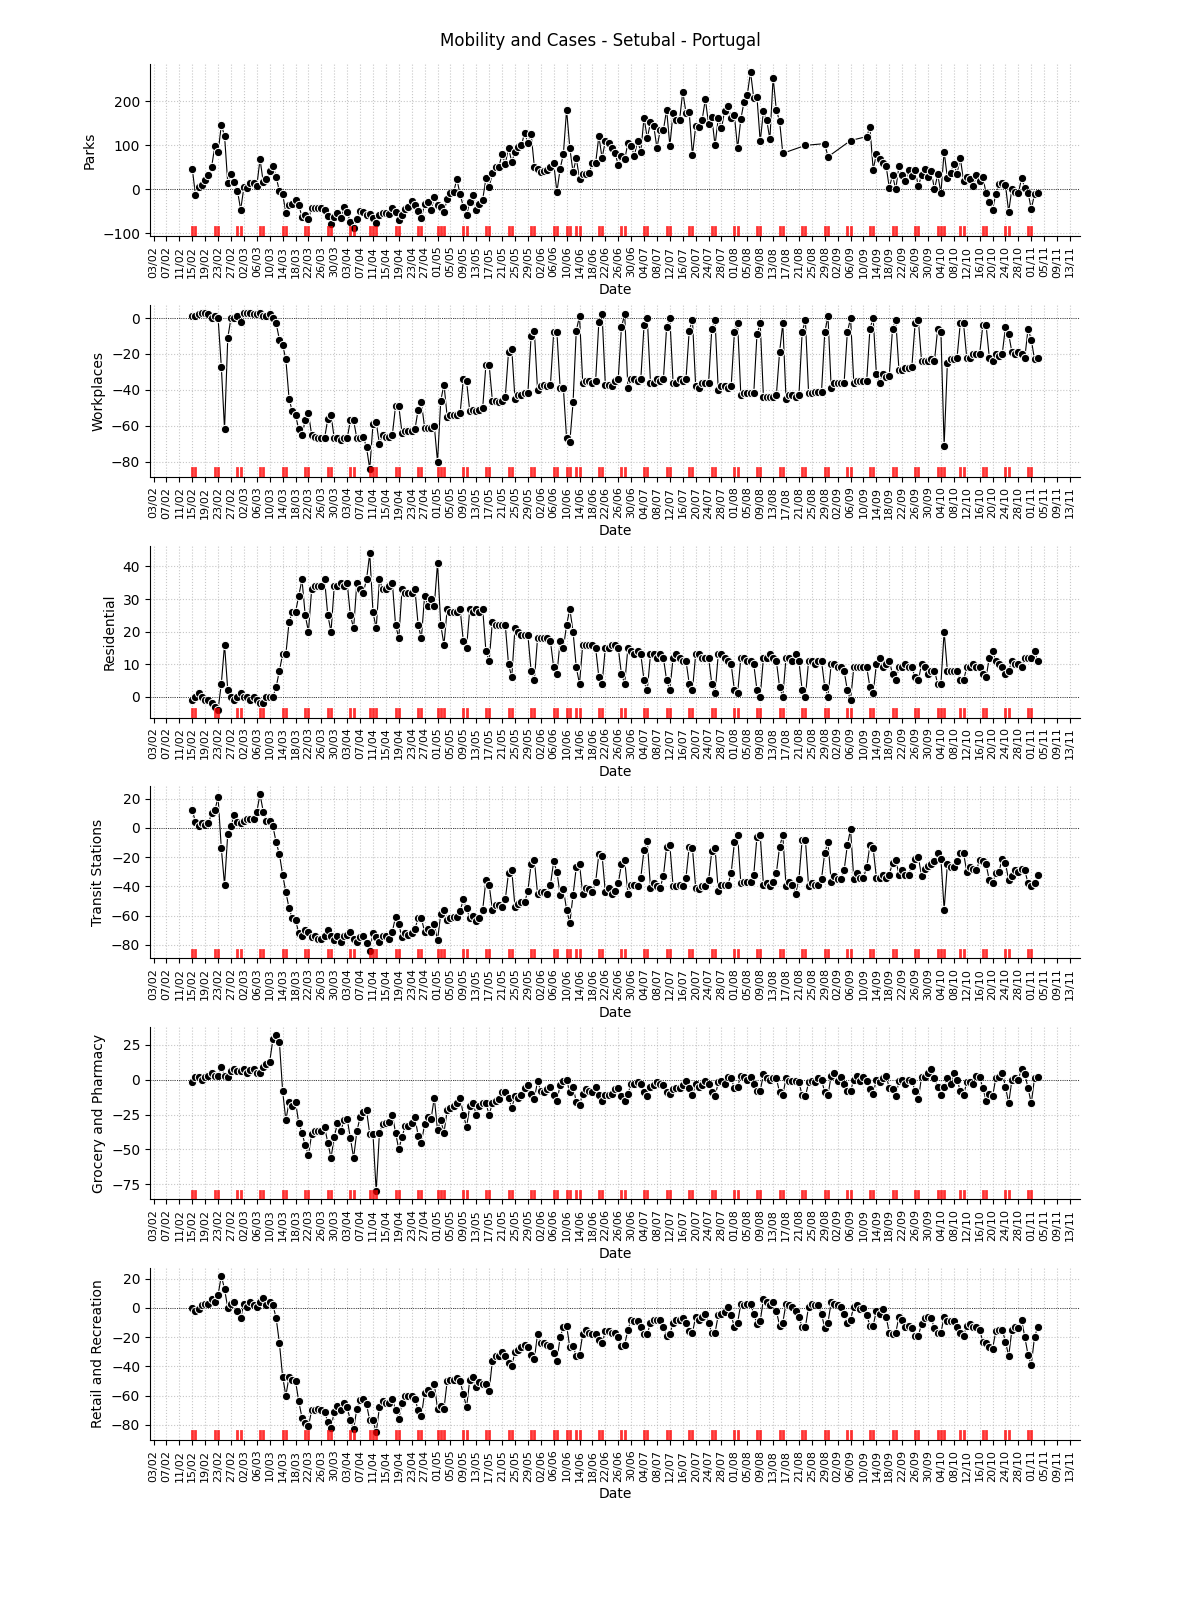
Note
This plot uses official mobility data from Google Community Mobility Reports. The red markers on the x-axis are weekends or holidays.
Mobility region: Viana do Castelo District
Mobility data for the sub-region
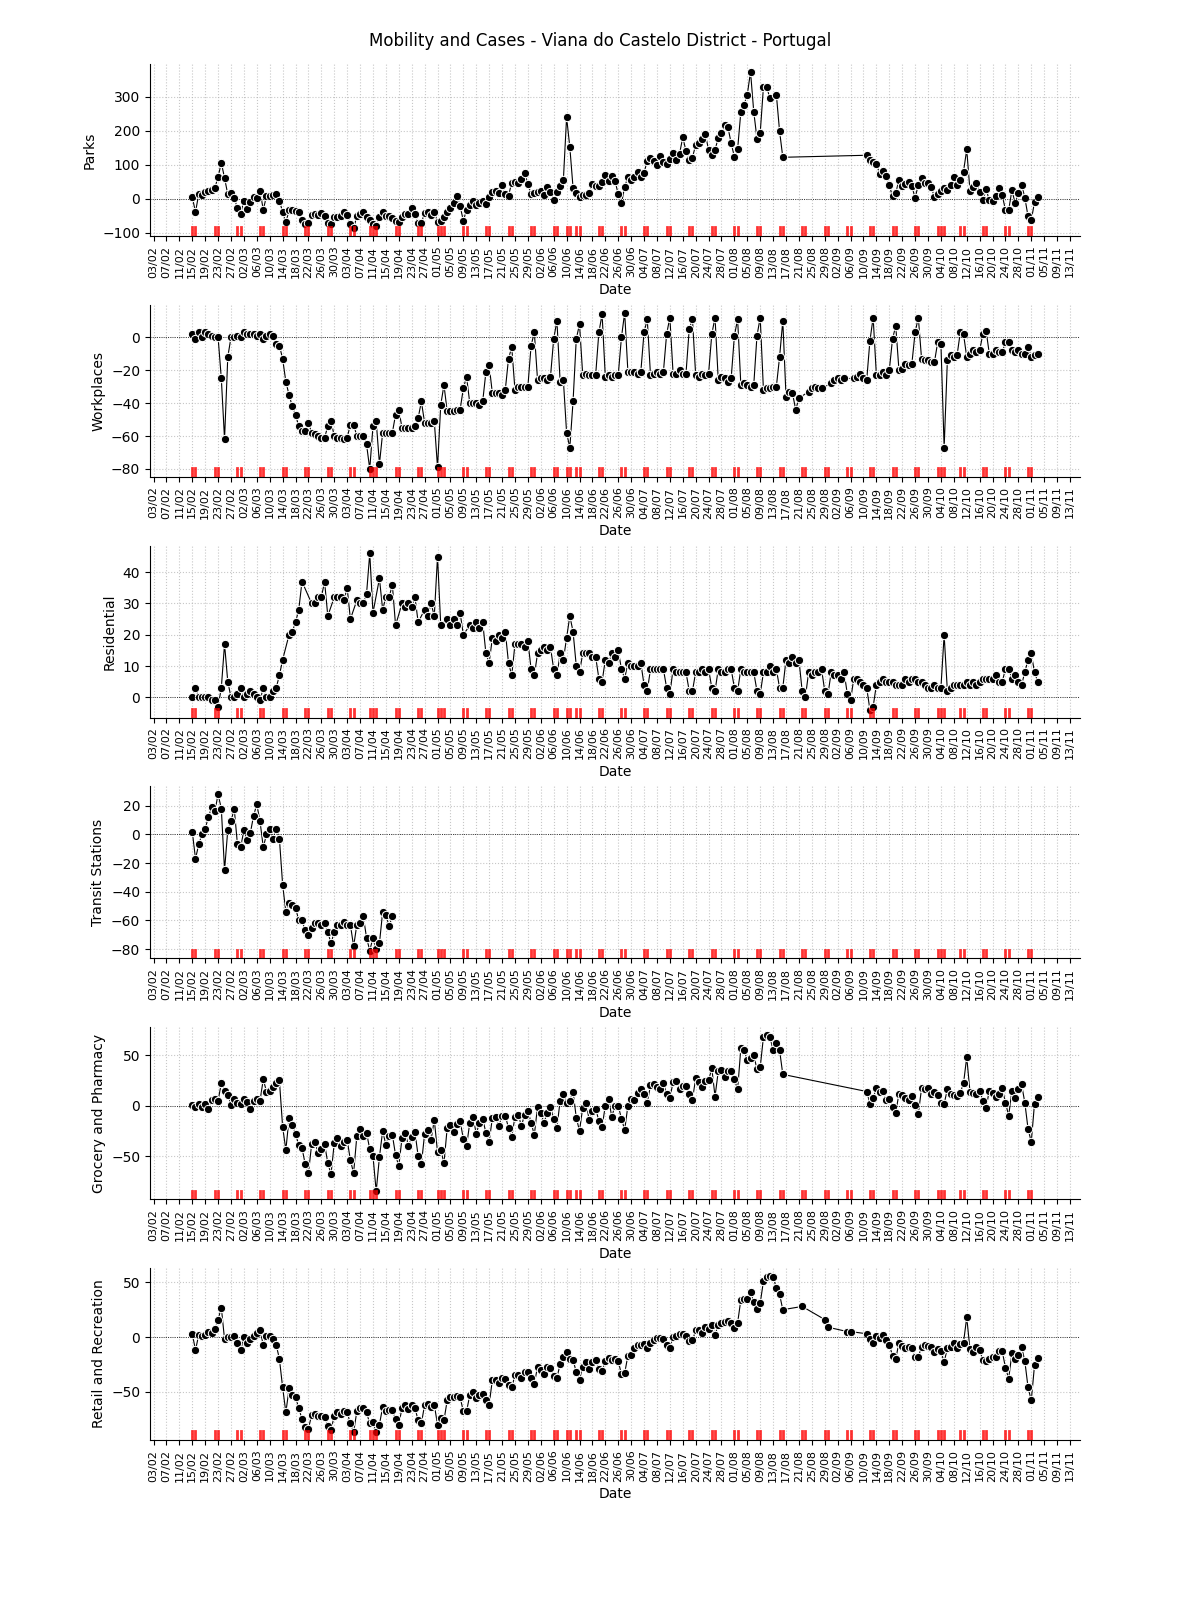
Note
This plot uses official mobility data from Google Community Mobility Reports. The red markers on the x-axis are weekends or holidays.
Mobility region: Vila Real District
Mobility data for the sub-region
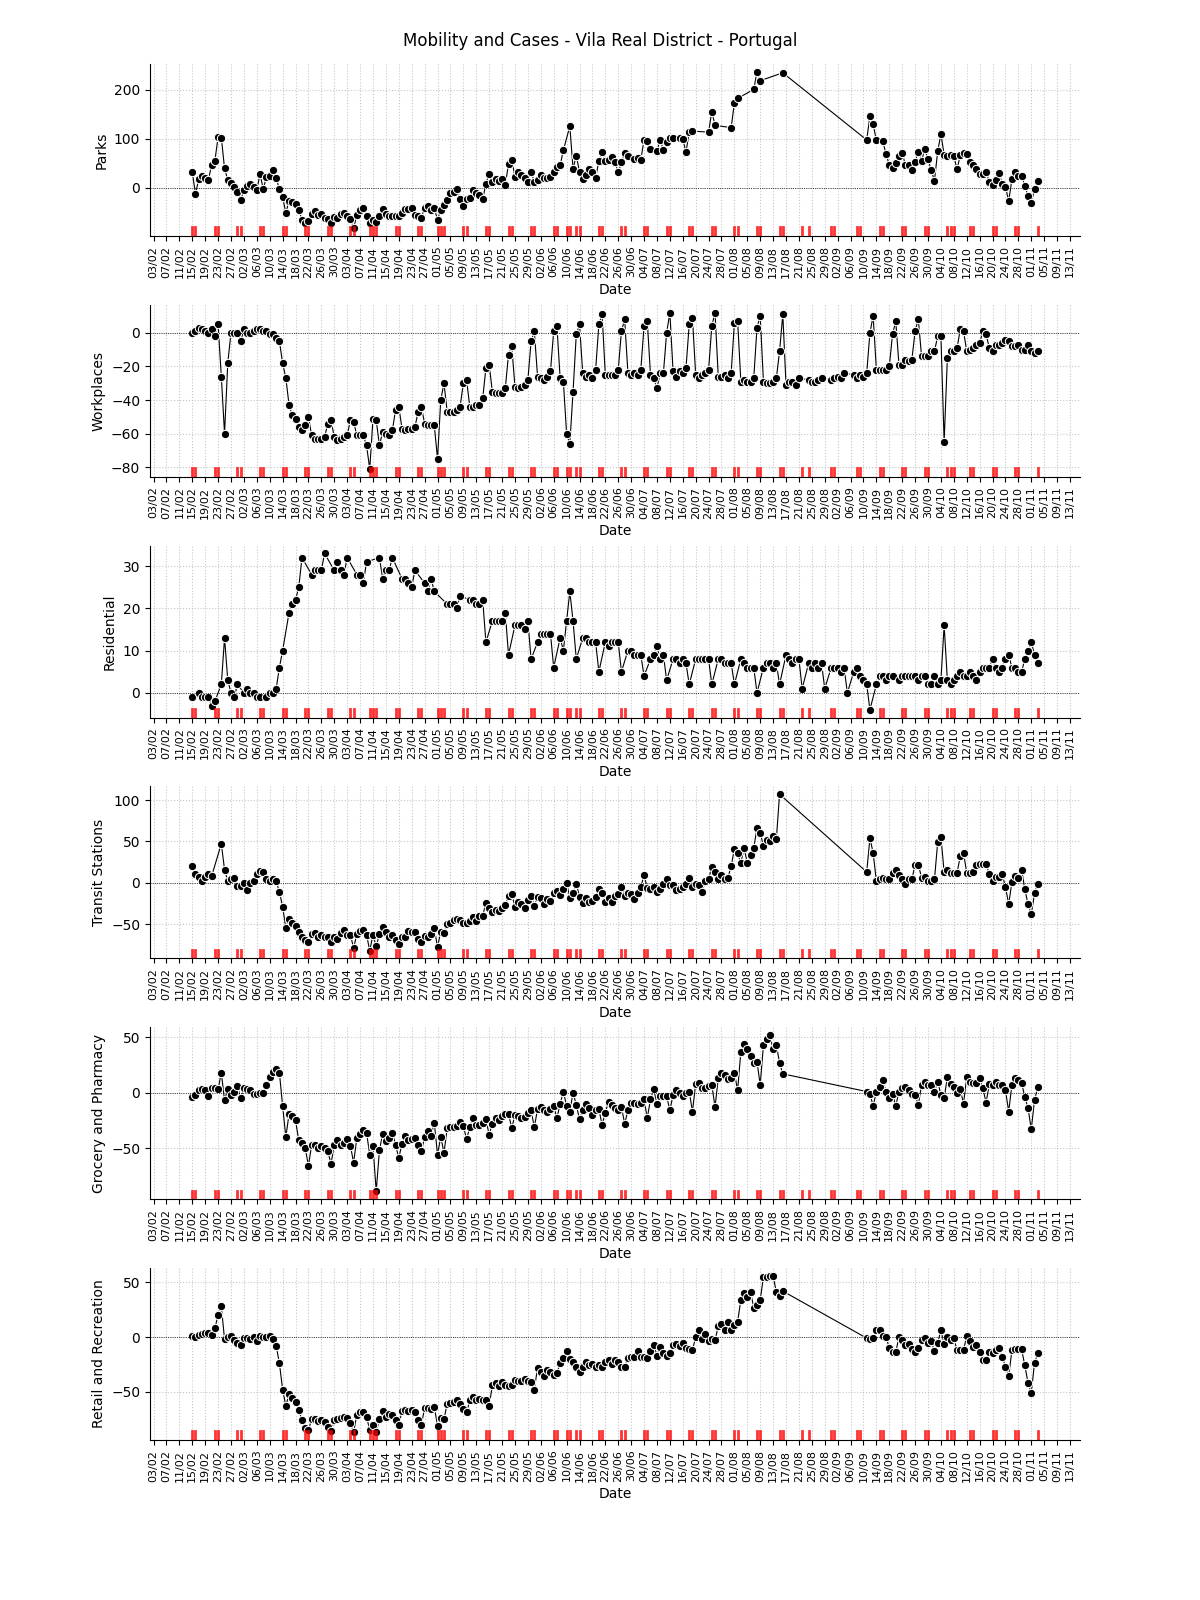
Note
This plot uses official mobility data from Google Community Mobility Reports. The red markers on the x-axis are weekends or holidays.
Mobility region: Viseu District
Mobility data for the sub-region
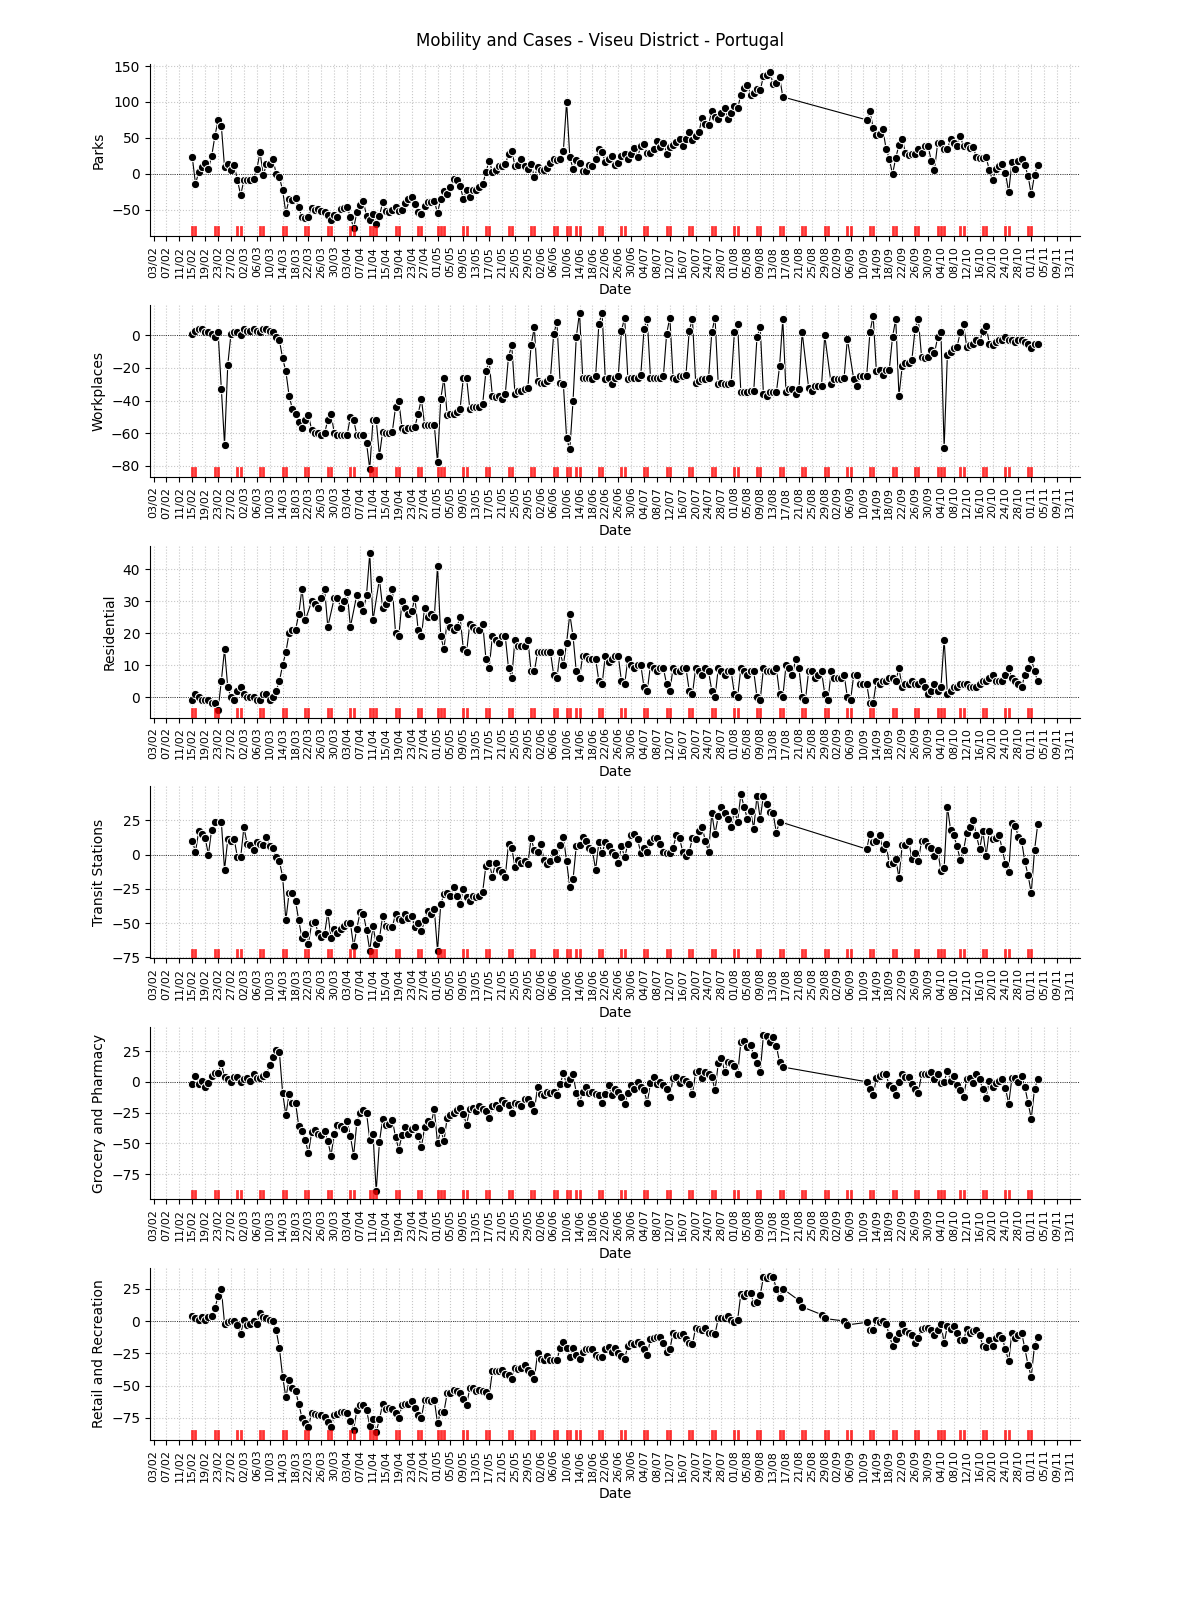
Note
This plot uses official mobility data from Google Community Mobility Reports. The red markers on the x-axis are weekends or holidays.