18/May – Symptom regression for each state in Brazil
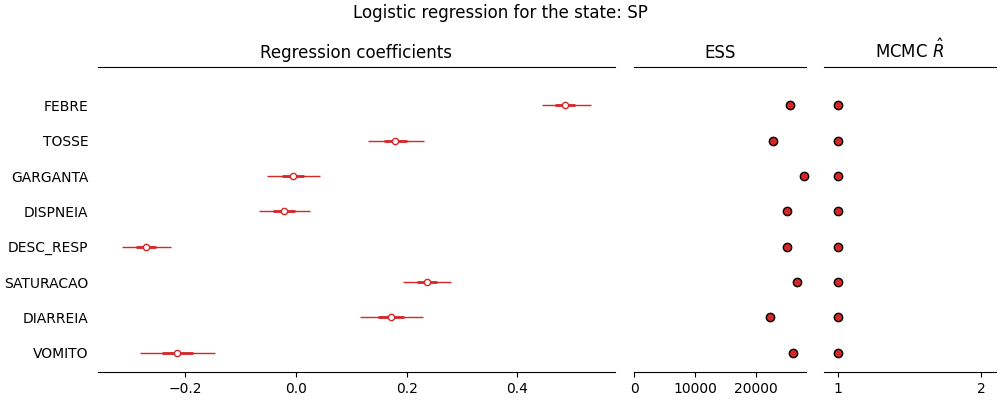
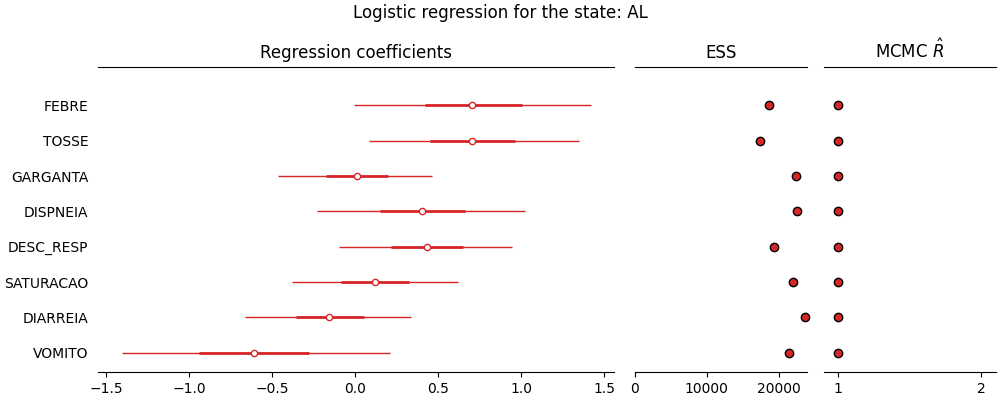
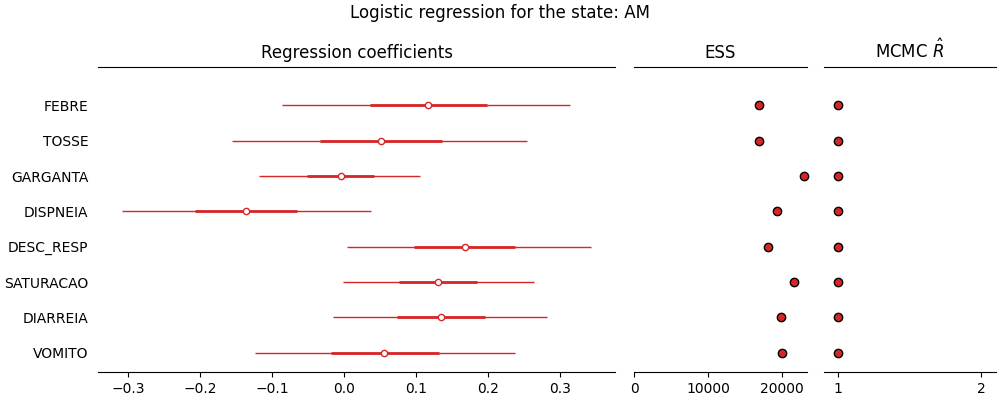
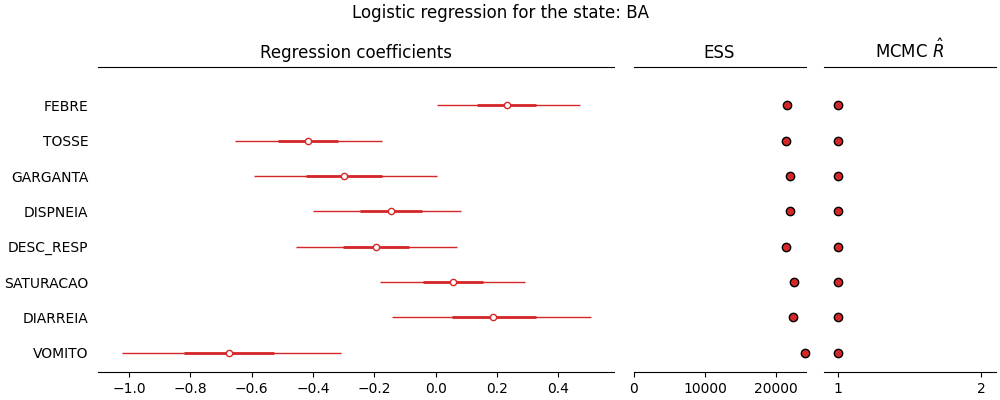
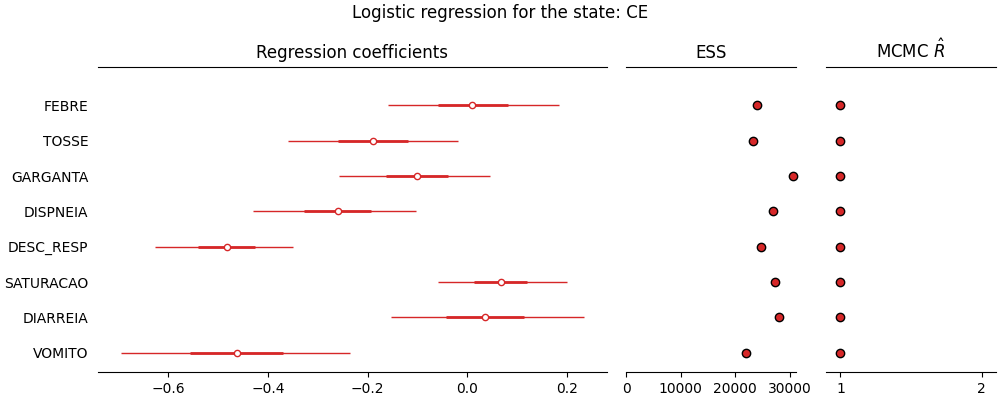
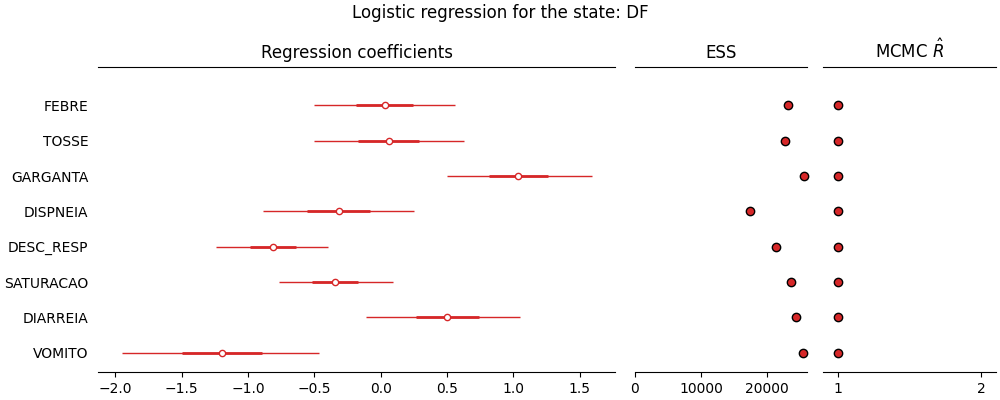
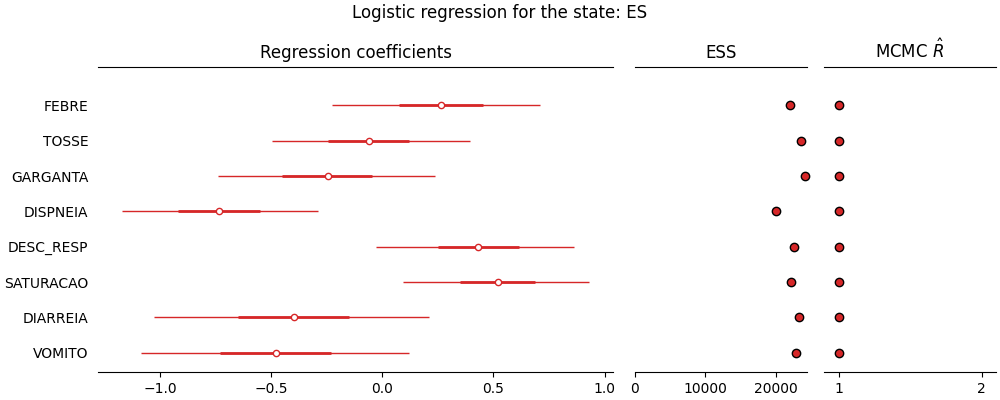
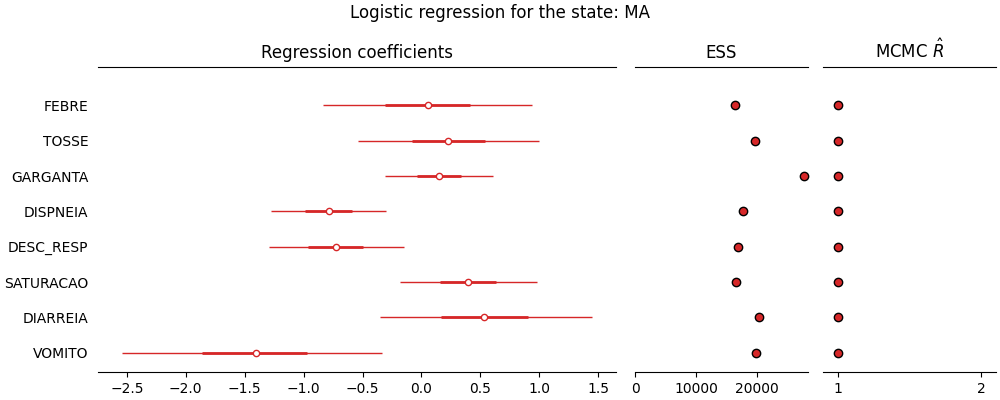
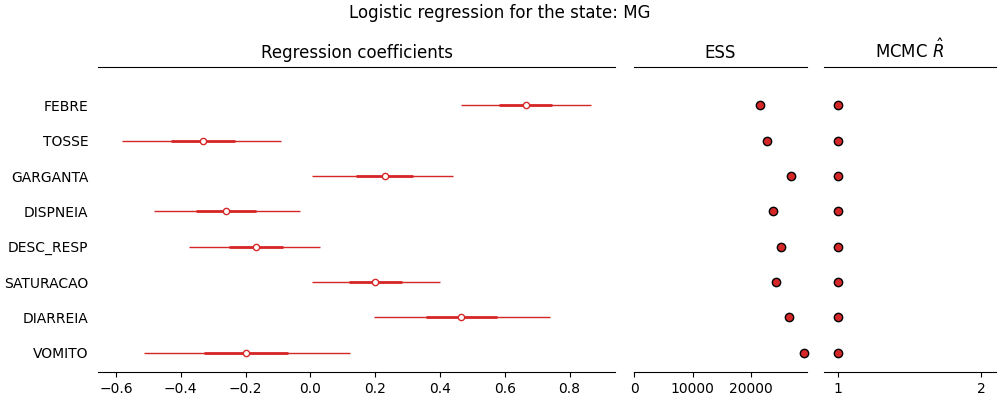
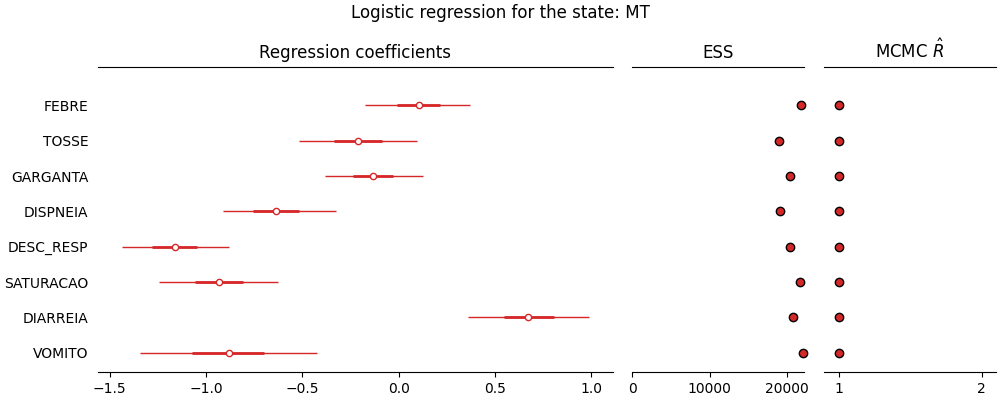
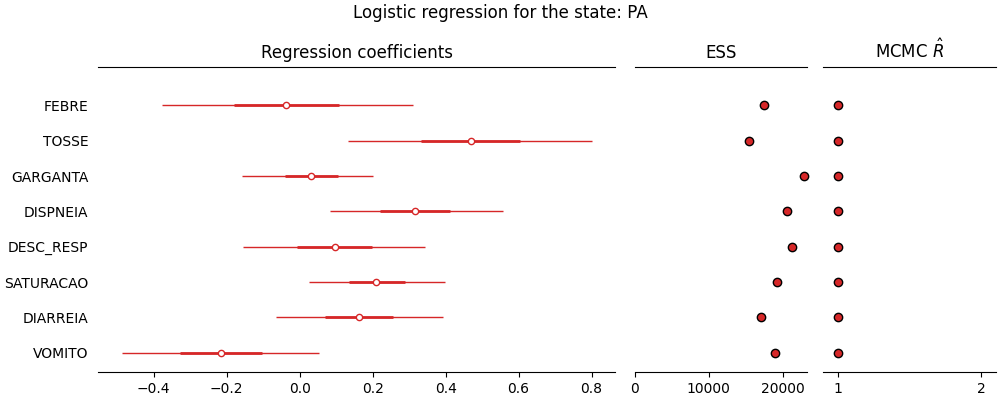
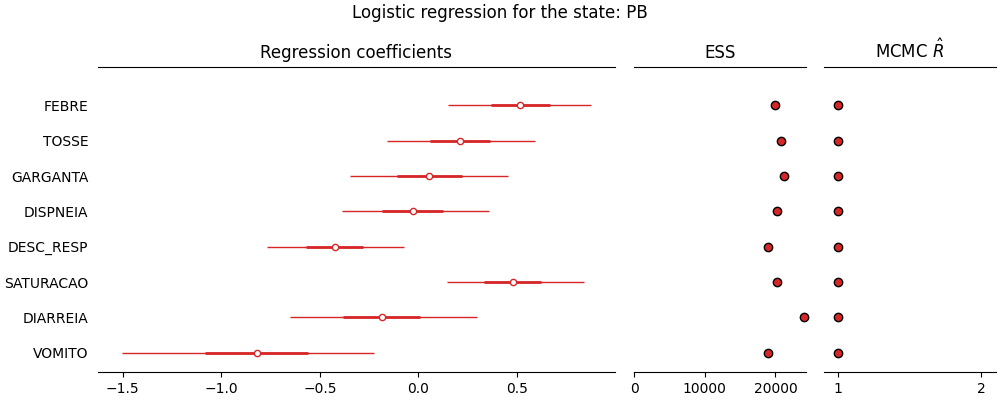
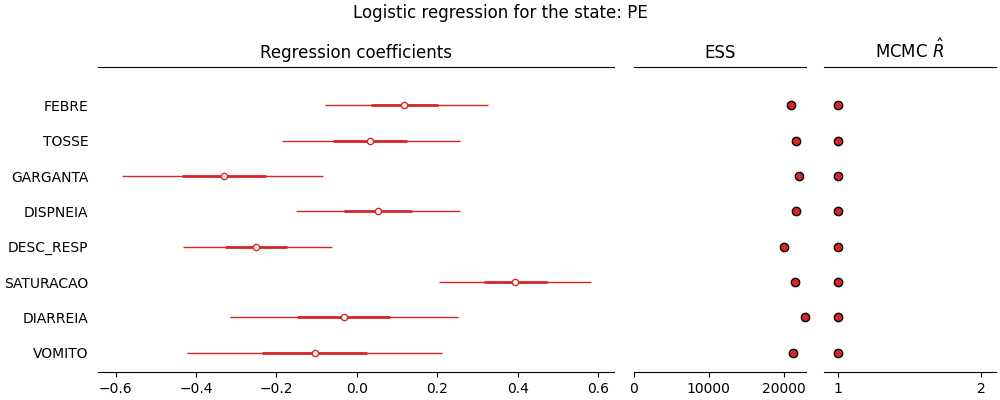
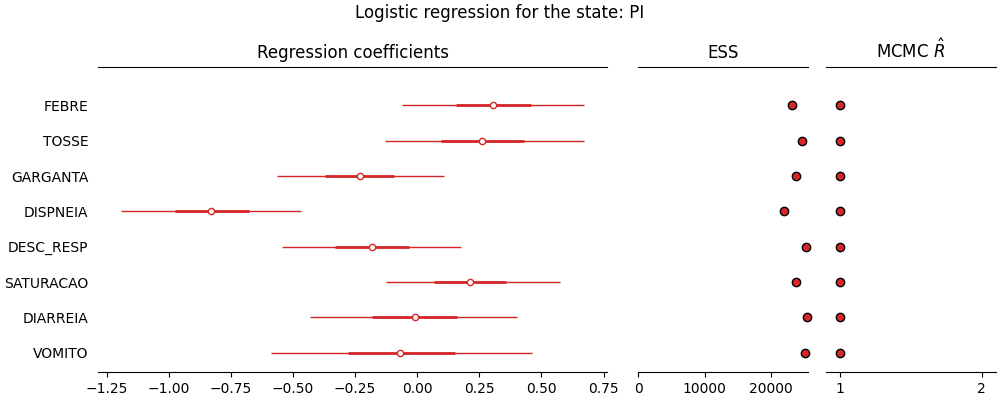
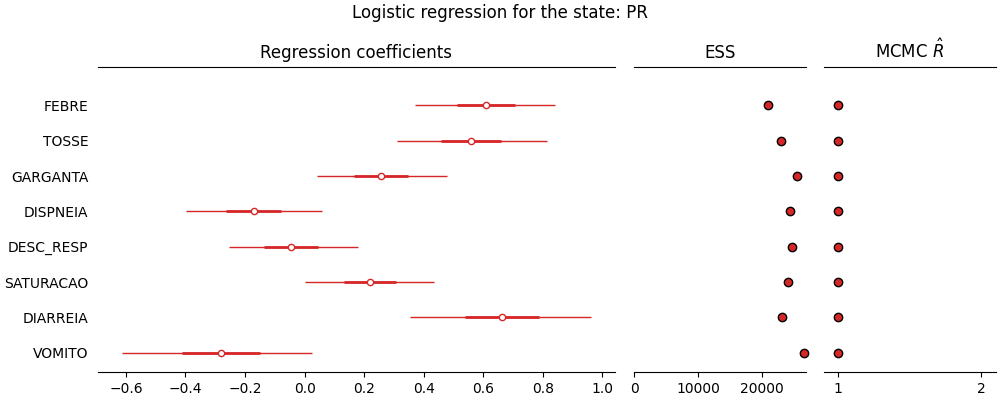
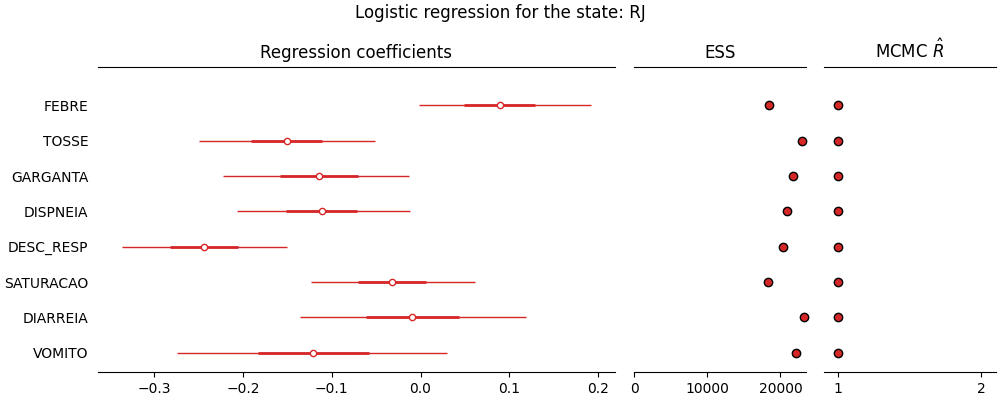
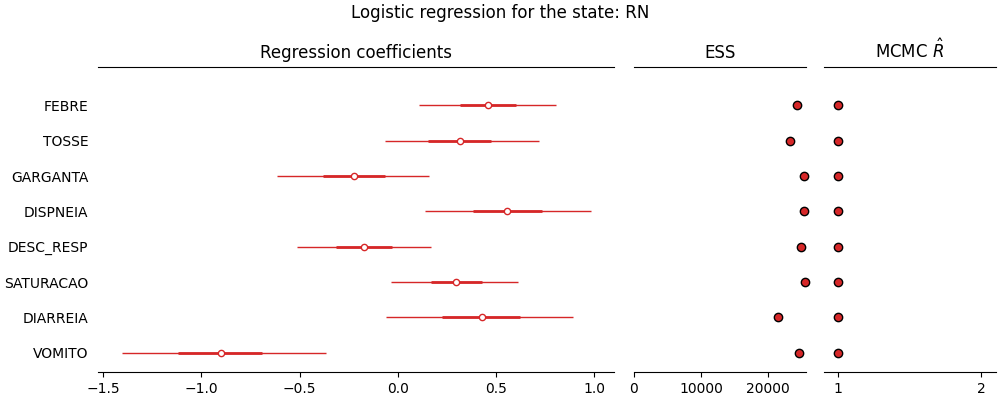
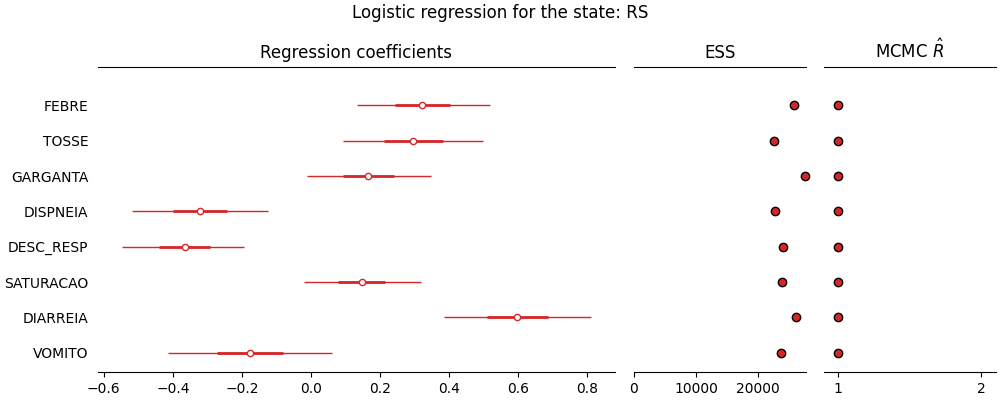
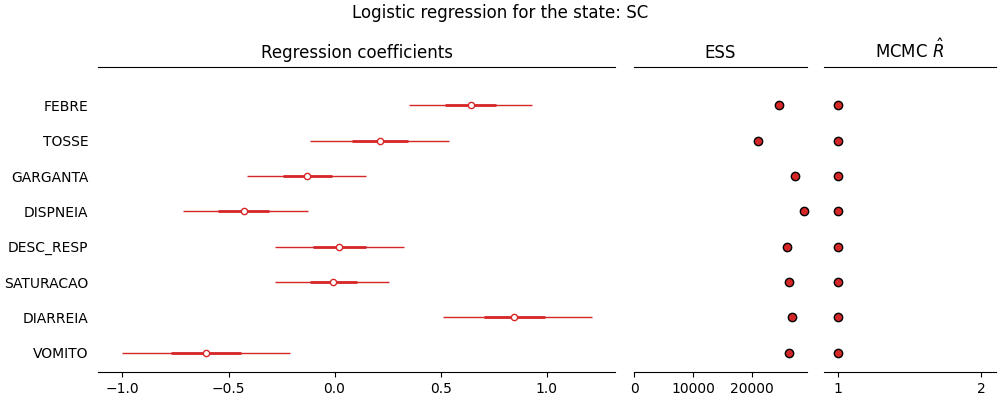
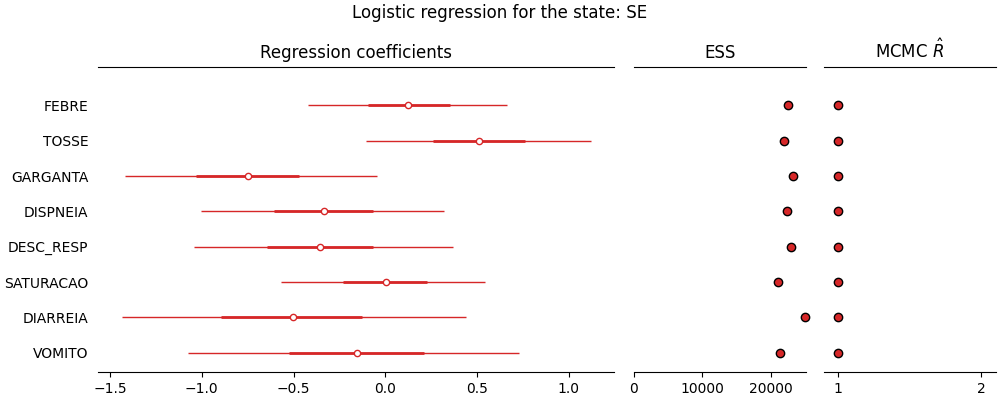
This is a bayesian logistic regression with a bernoulli likelihood for the outcome of
the patient (positive/not positive for COVID-19) based on the reported symptoms covariates.
A HMC MCMC procedure was employed to estimate the model with 2 independent chains. On the
left panel of the plots you’ll find the regression coefficients and their uncertainties. On
the middle panel you’ll find the Effective Sample Size of the MCMC sampling and on the right
panel you’ll find the MCMC Rhat diagnostic metric.
Some important points:
Only states with more than 100 cases reported on SIVEP system were used in the
estimation;
SIVEP data doesn’t include all testing done for all states and all cities;
SIVEP data is observational data and correlation doesn’t imply causation, this
analysis is only a predictive model for the outcome being Positive/Not Positive
for COVID-19 based on the reported symptoms;
For more information about what each symptom means, please look at the SIVEP
data dictionary;
Note
This plot uses official data from SIVEP system in Brazil, the maximum of the
notification date for this data was 18/May.
State: Alagoas / AL
Regression plot for Alagoas / Brazil
State: Amazonas / AM
Regression plot for Amazonas / Brazil
State: Bahia / BA
Regression plot for Bahia / Brazil
State: Ceará / CE
Regression plot for Ceará / Brazil
State: Distrito Federal / DF
Regression plot for Distrito Federal / Brazil
State: Espírito Santo / ES
Regression plot for Espírito Santo / Brazil
State: Goiás / GO
Regression plot for Goiás / Brazil

State: Maranhão / MA
Regression plot for Maranhão / Brazil
State: Minas Gerais / MG
Regression plot for Minas Gerais / Brazil
State: Mato Grosso / MT
Regression plot for Mato Grosso / Brazil
State: Pará / PA
Regression plot for Pará / Brazil
State: Paraíba / PB
Regression plot for Paraíba / Brazil
State: Pernambuco / PE
Regression plot for Pernambuco / Brazil
State: Piauí / PI
Regression plot for Piauí / Brazil
State: Paraná / PR
Regression plot for Paraná / Brazil
State: Rio de Janeiro / RJ
Regression plot for Rio de Janeiro / Brazil
State: Rio Grande do Norte / RN
Regression plot for Rio Grande do Norte / Brazil
State: Rio Grande do Sul / RS
Regression plot for Rio Grande do Sul / Brazil
State: Santa Catarina / SC
Regression plot for Santa Catarina / Brazil
State: Sergipe / SE
Regression plot for Sergipe / Brazil
State: São Paulo / SP
Regression plot for São Paulo / Brazil