04/May – Symptom onset to confirmation delay estimation for states in Brazil
Since the generation time of a virus is very difficult to estimate, most studies rely on the serial interval which is estimated from the interval between clinical onsets. Given that most analysis use the serial interval, it is paramount to have an estimate of the precise onset dates of the symptoms. This work tries to provide a early estimation of this delay for each state in Brazil.
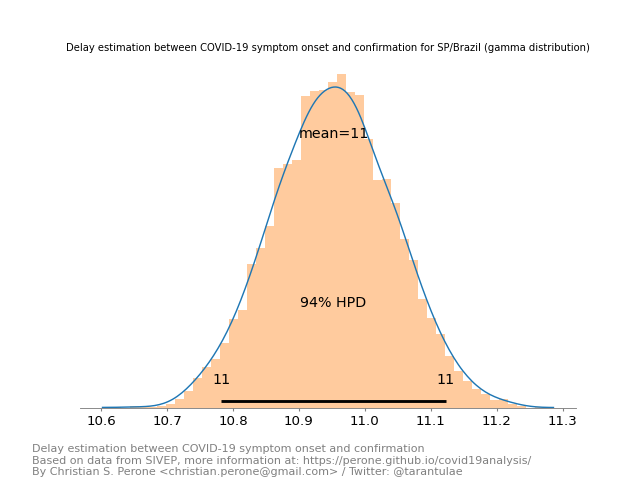
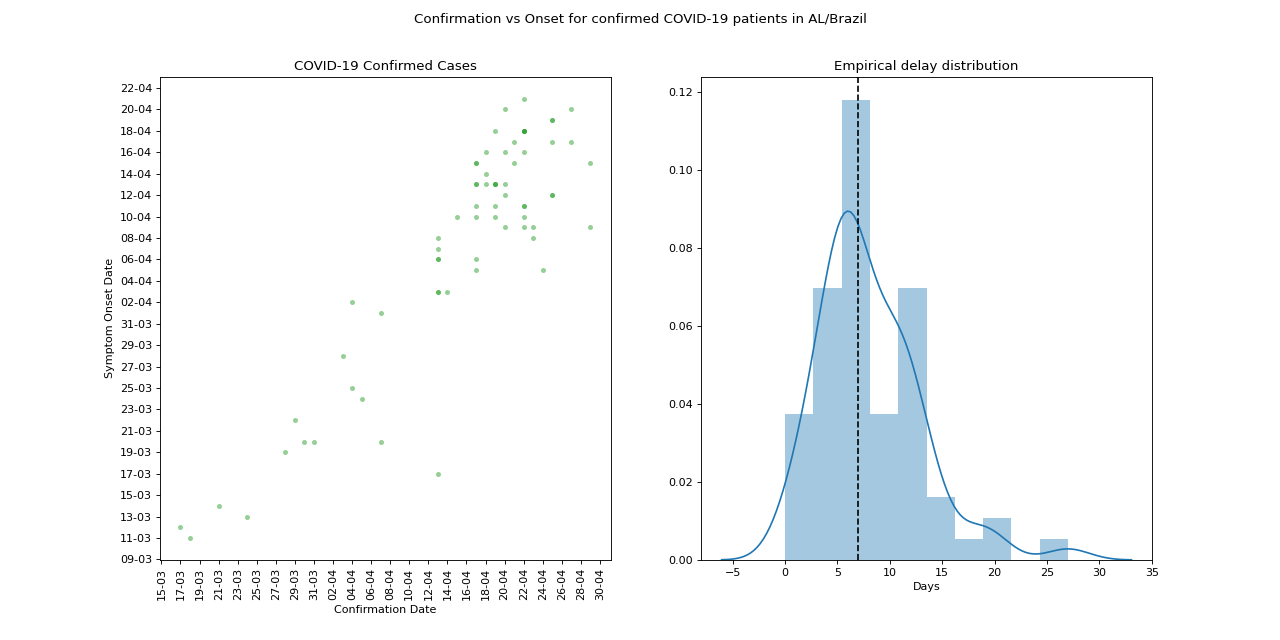
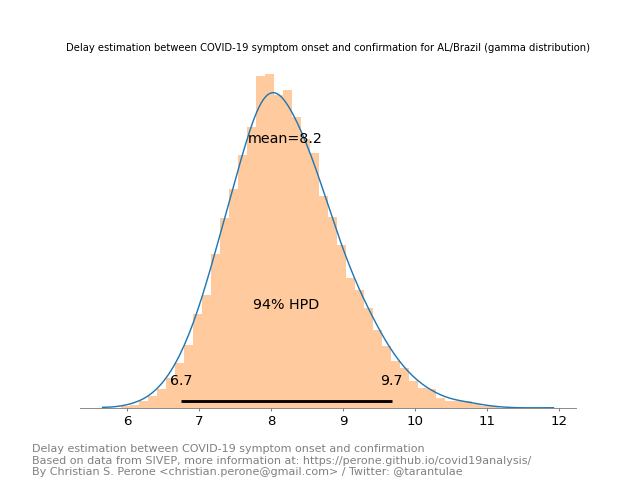
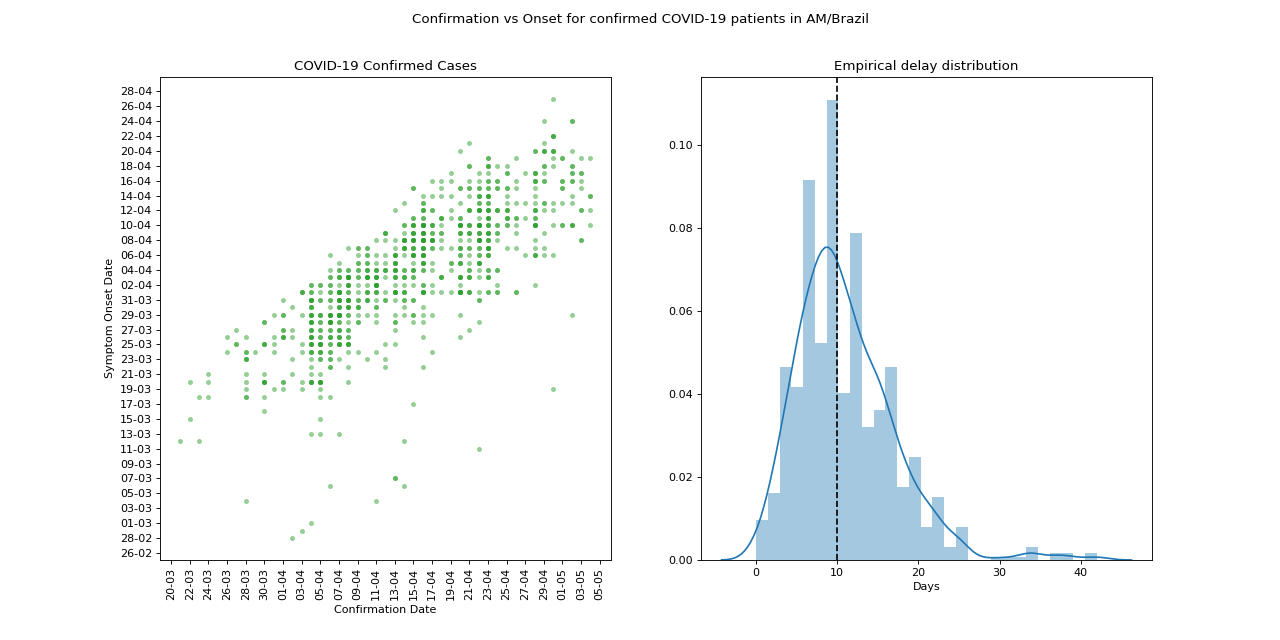
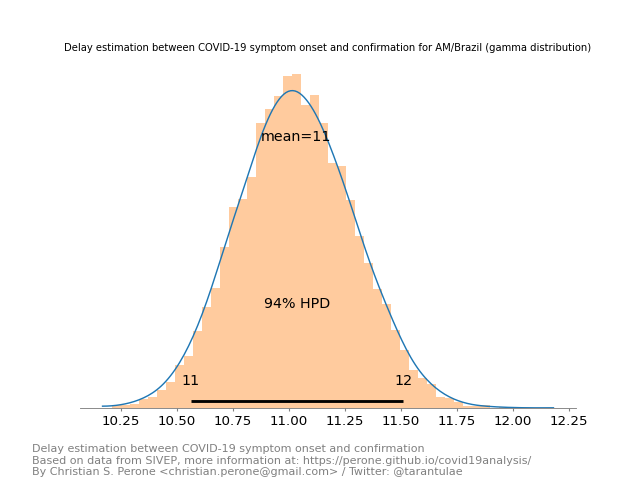
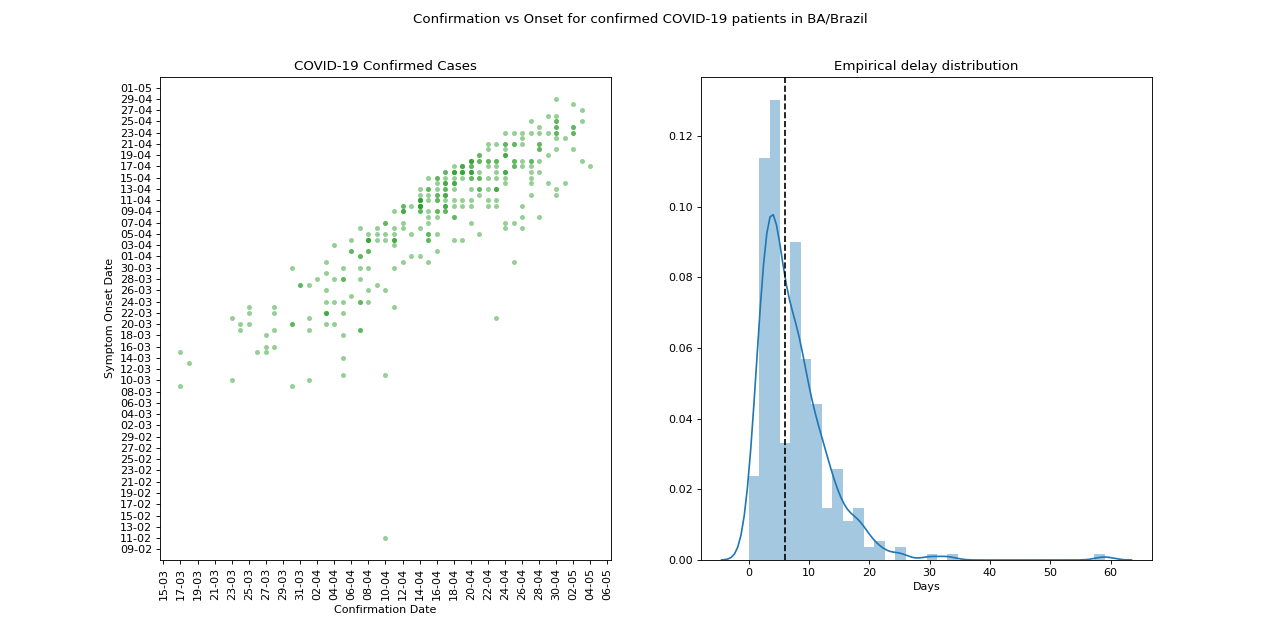
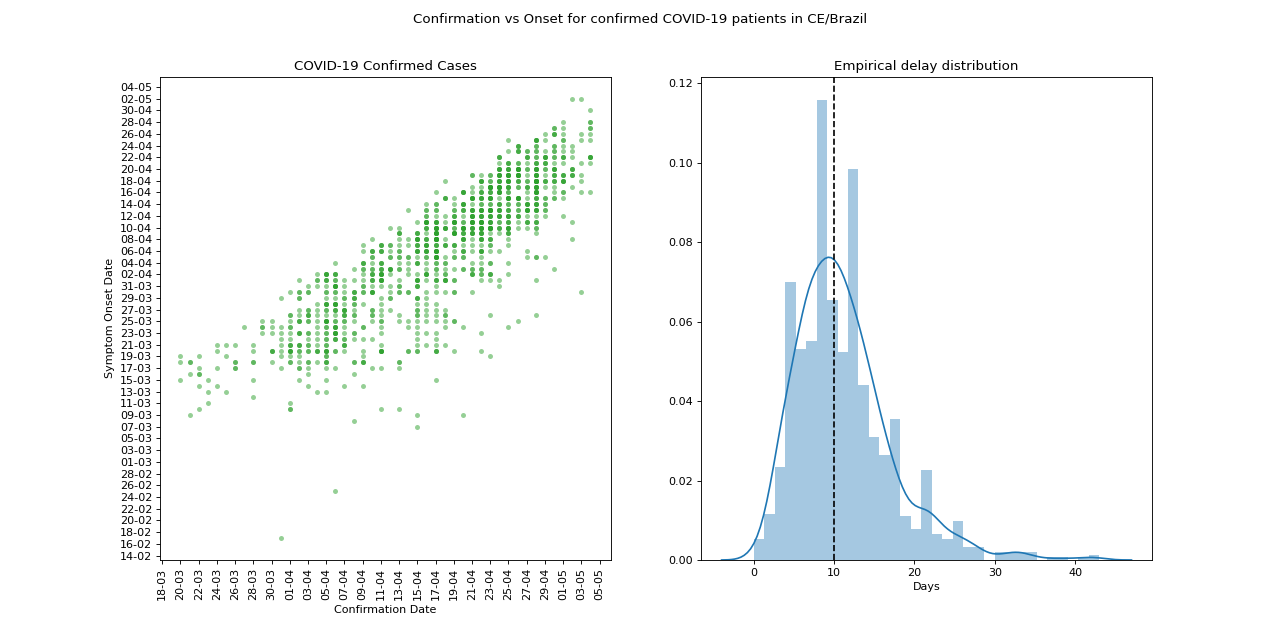
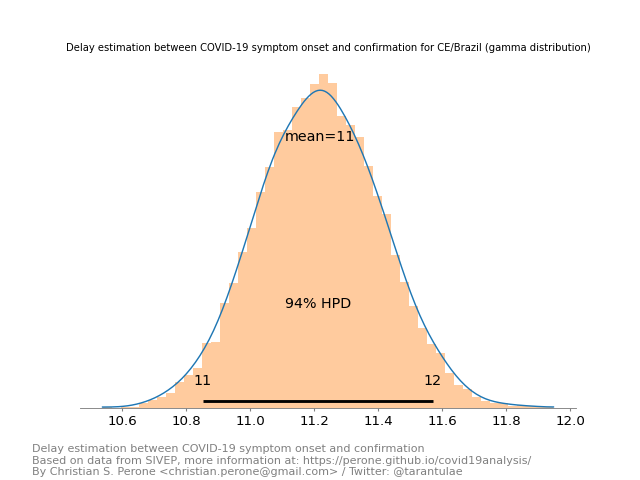
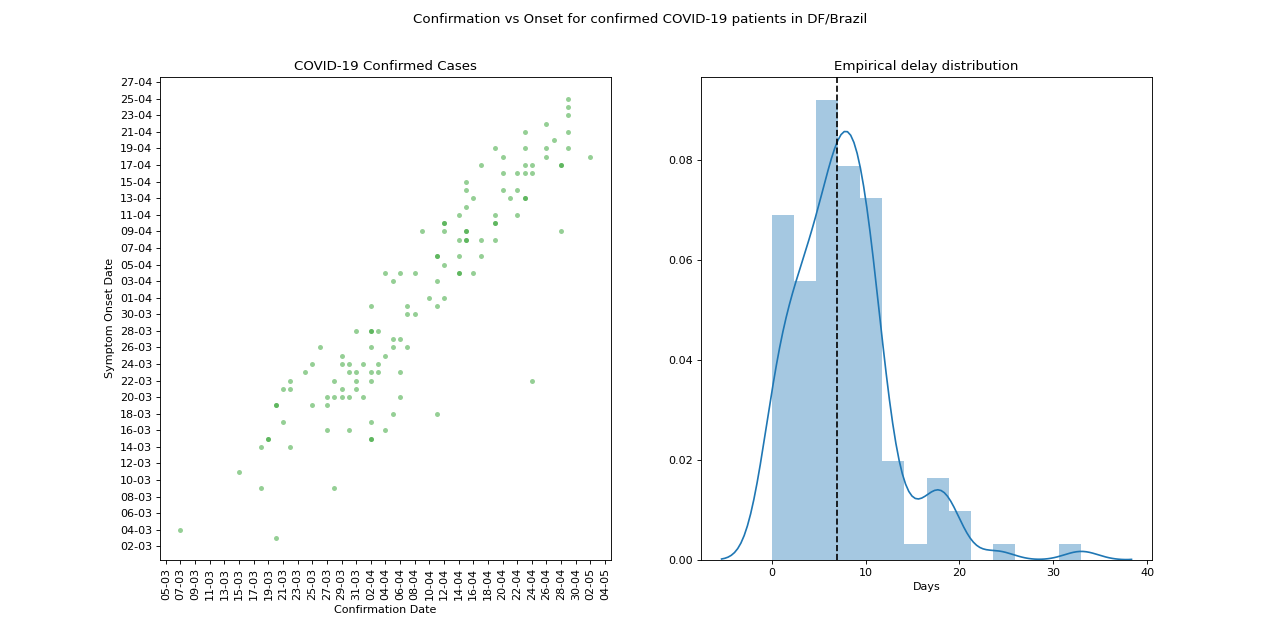
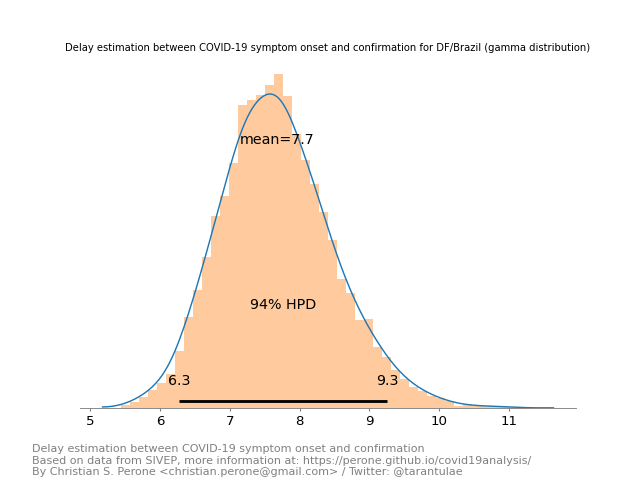
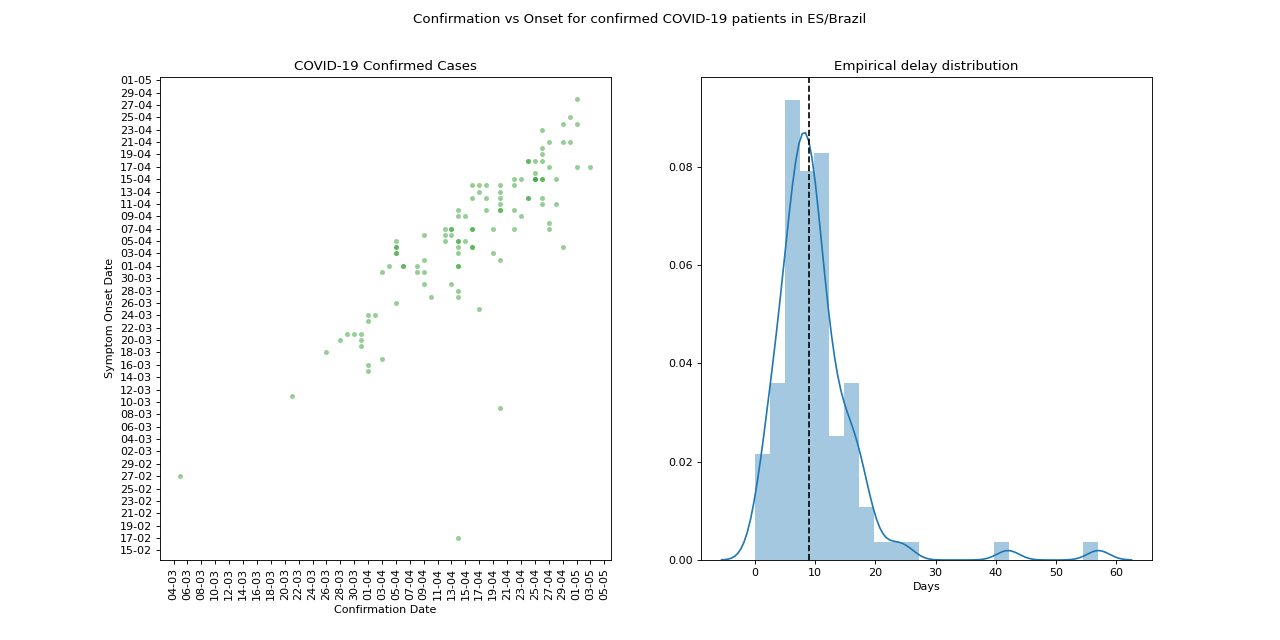
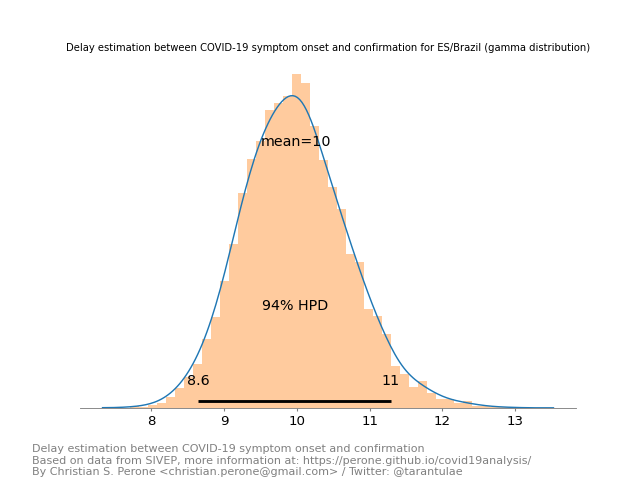
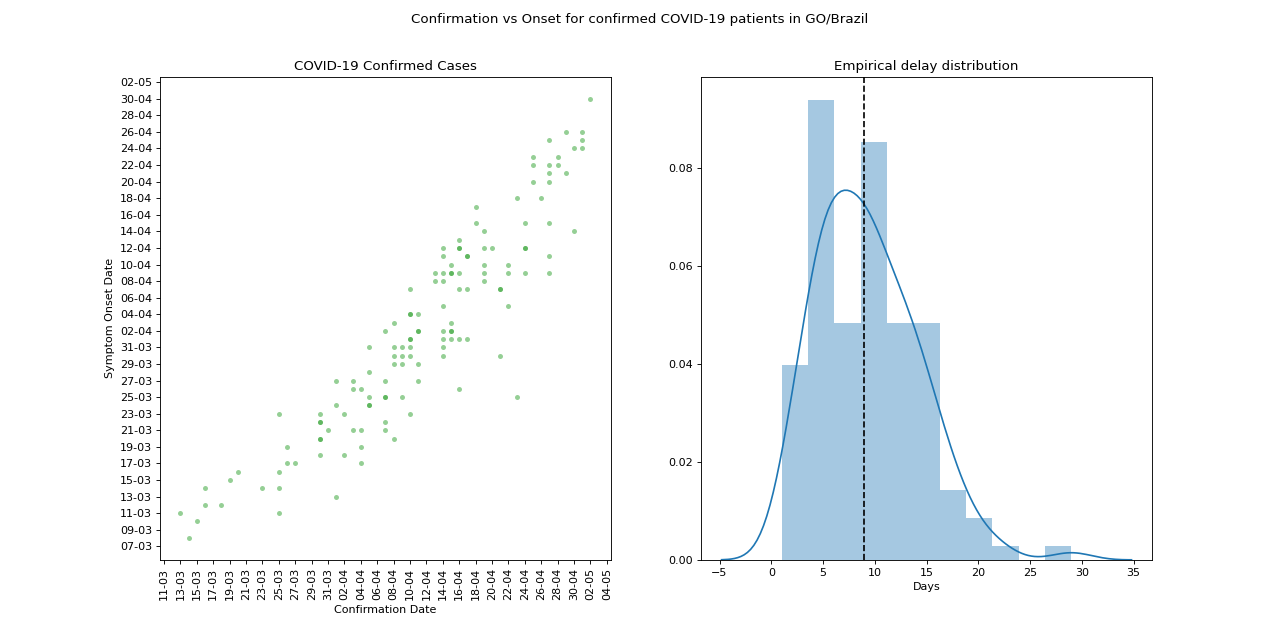
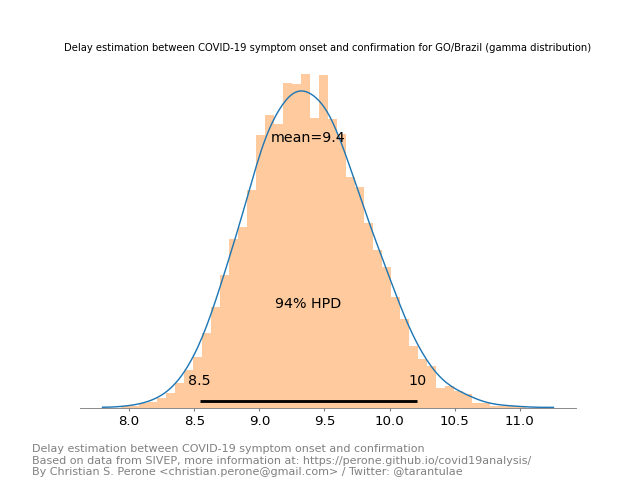
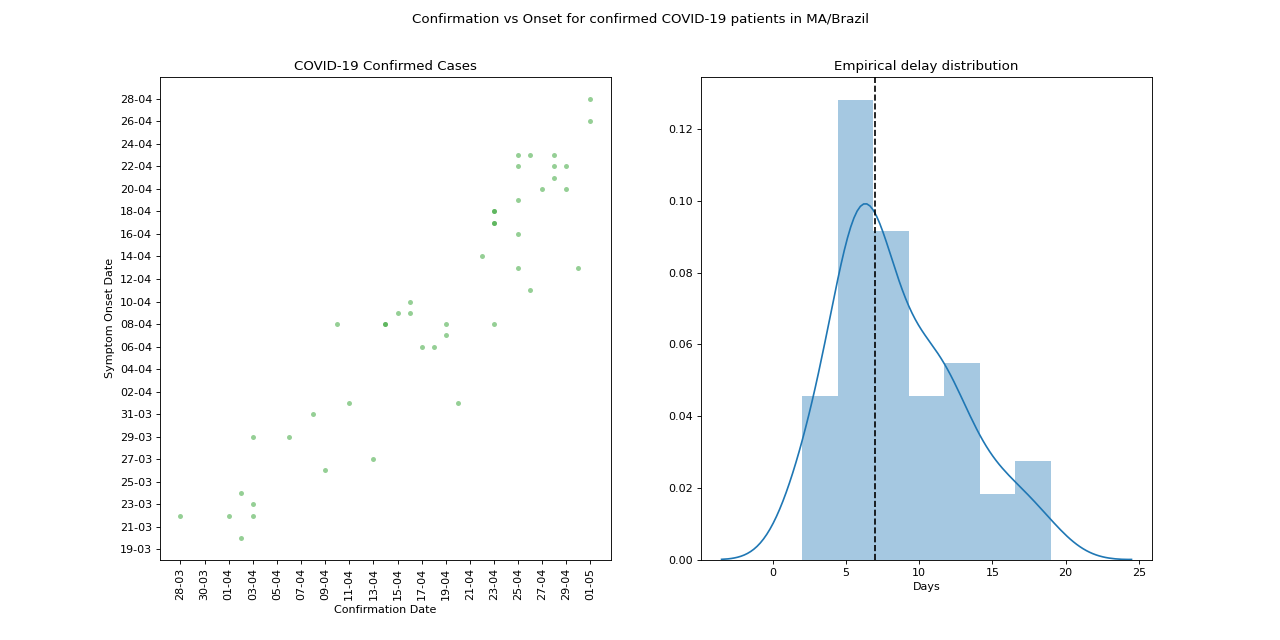
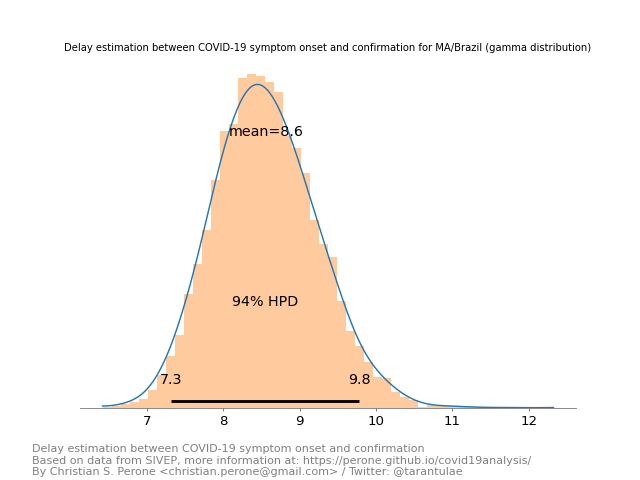
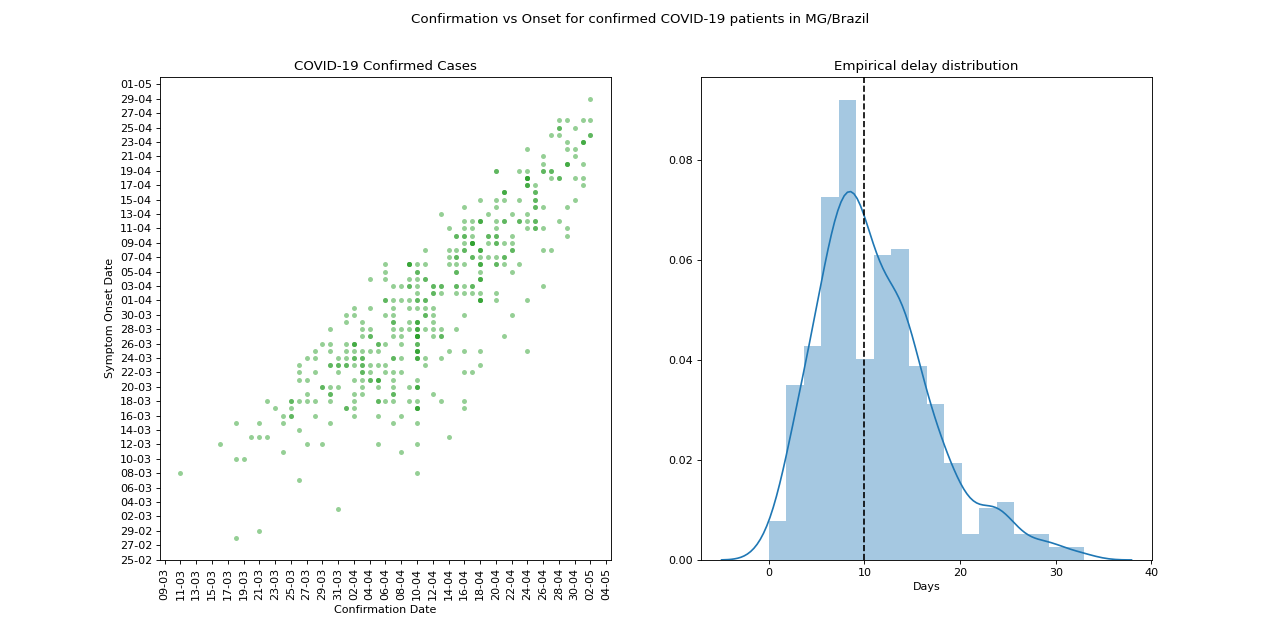
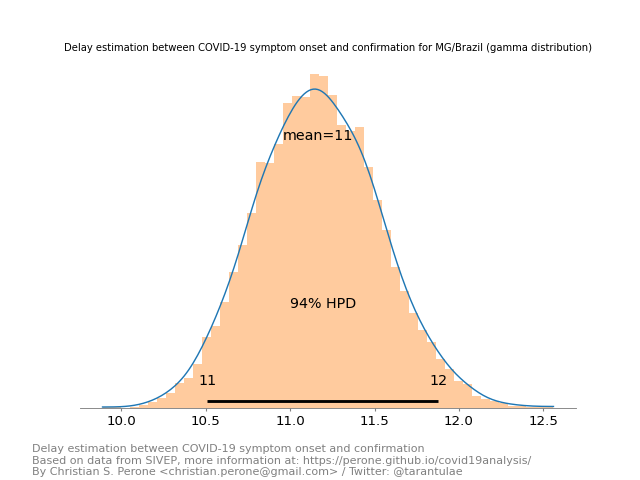
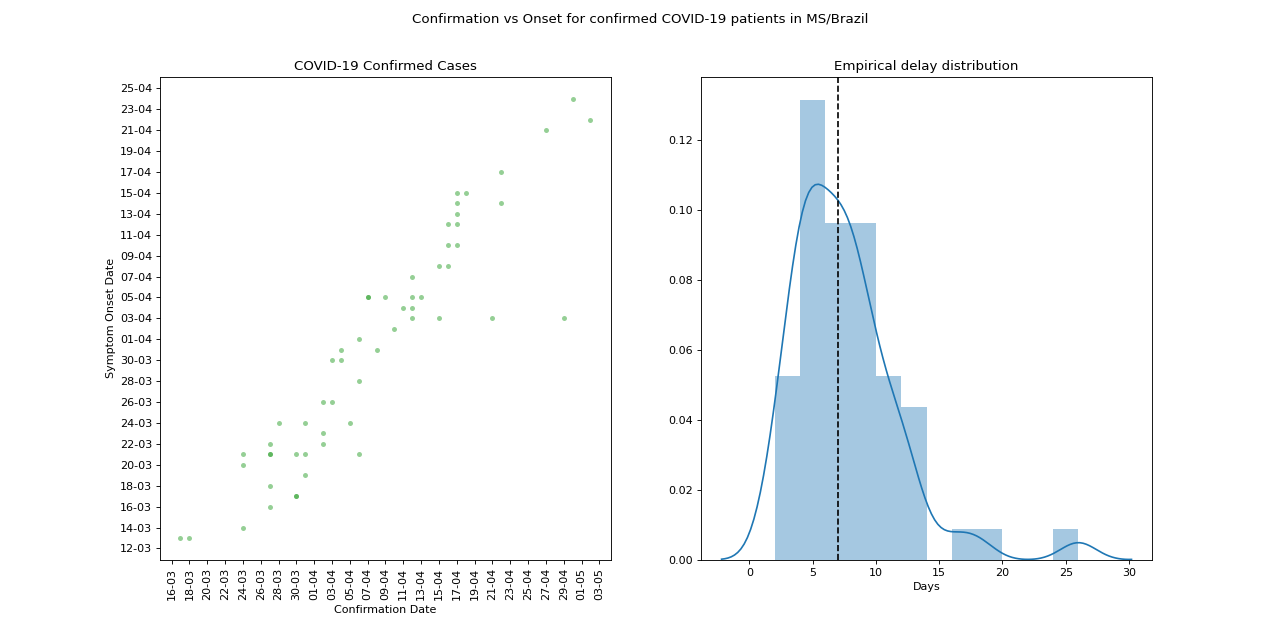
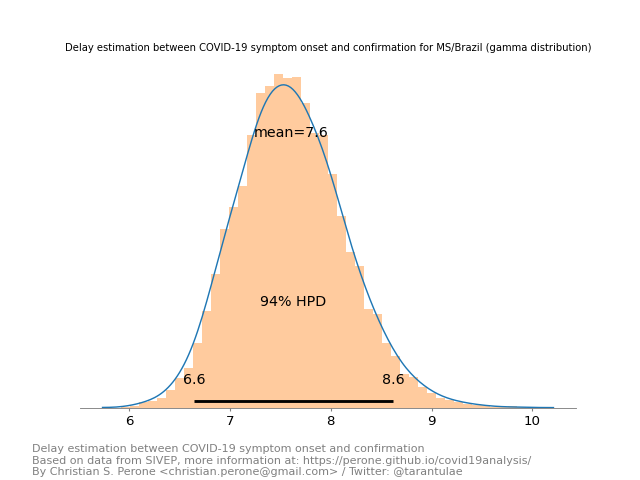
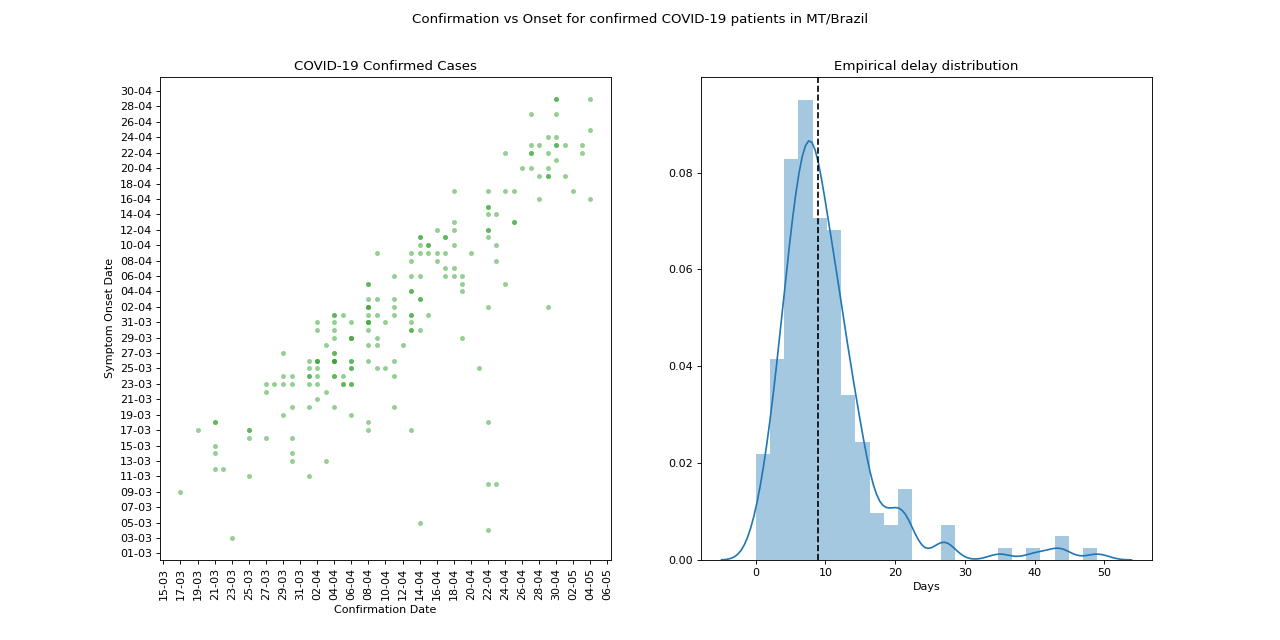
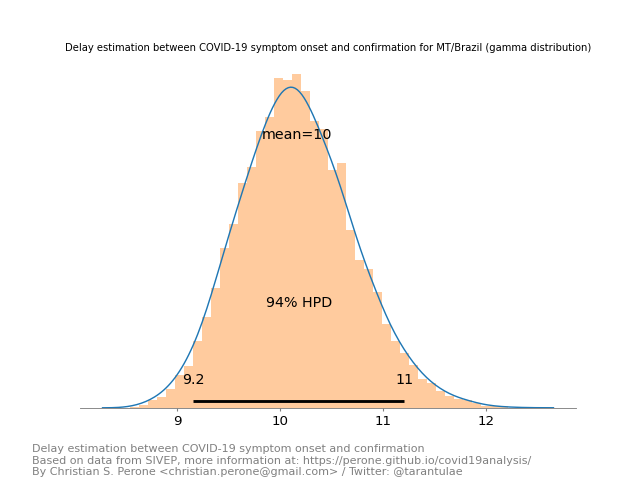
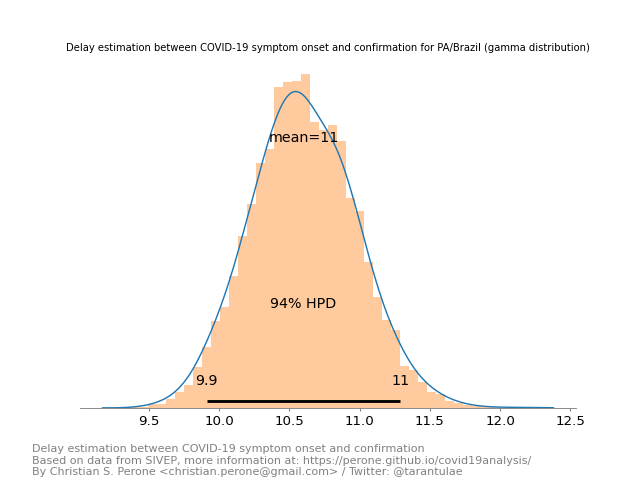
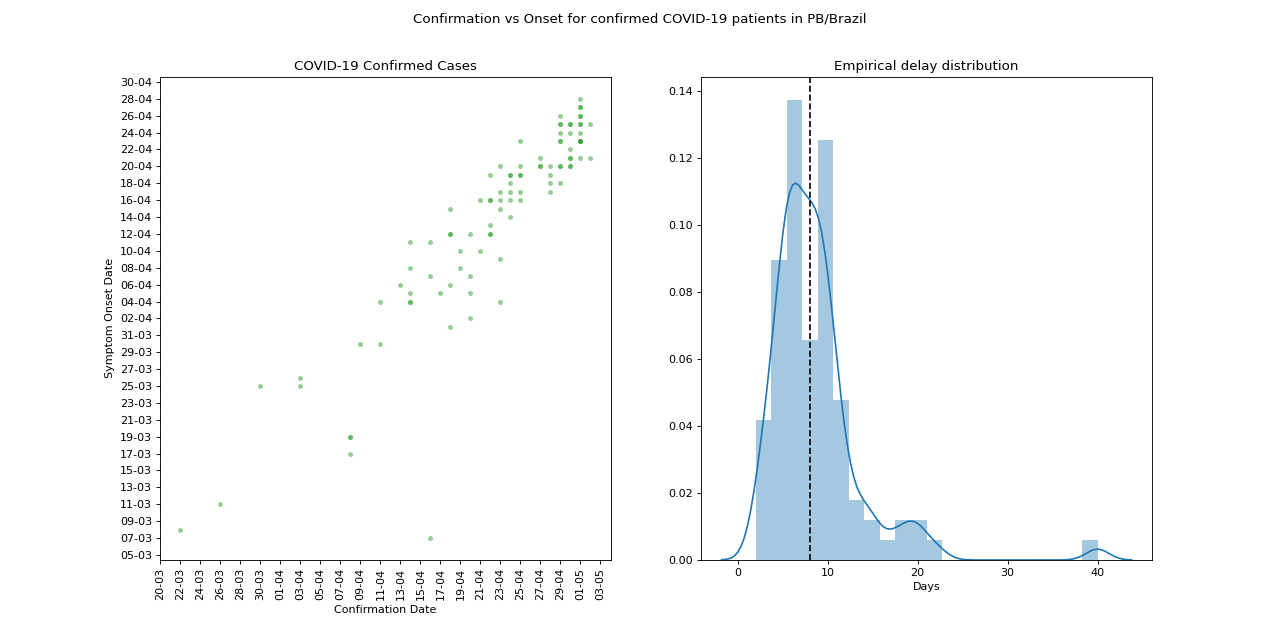
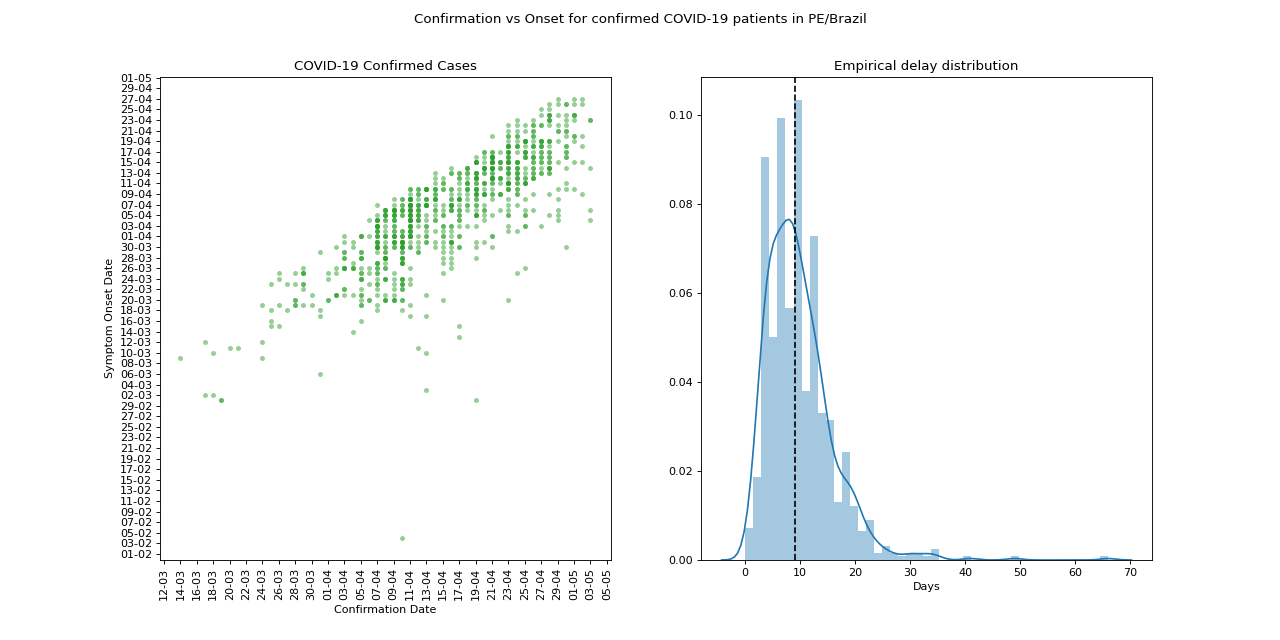
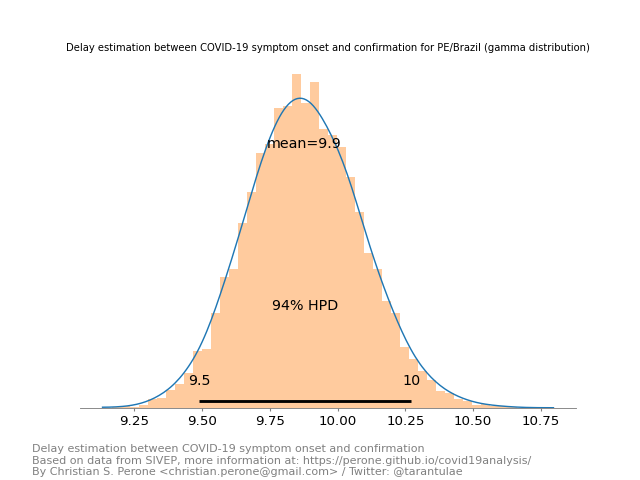
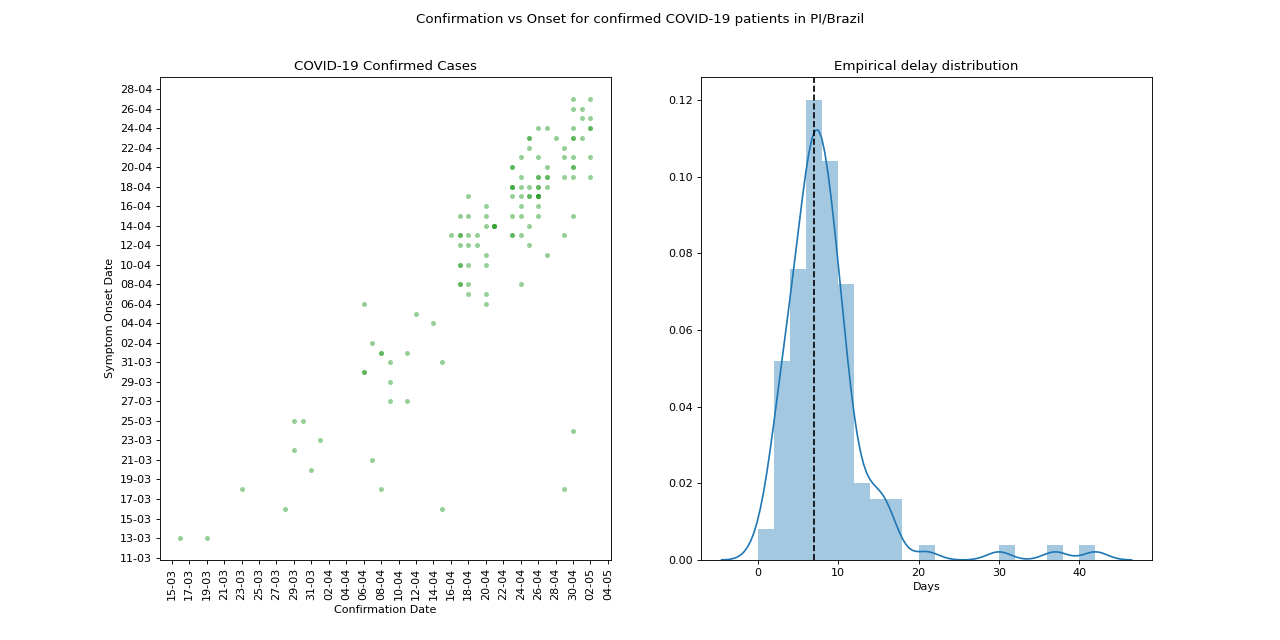
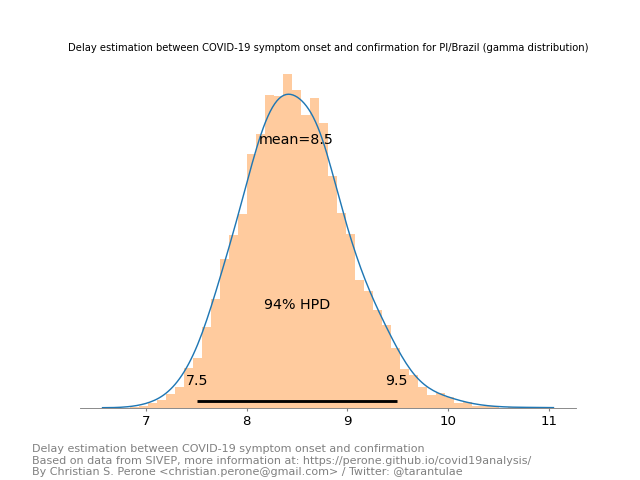
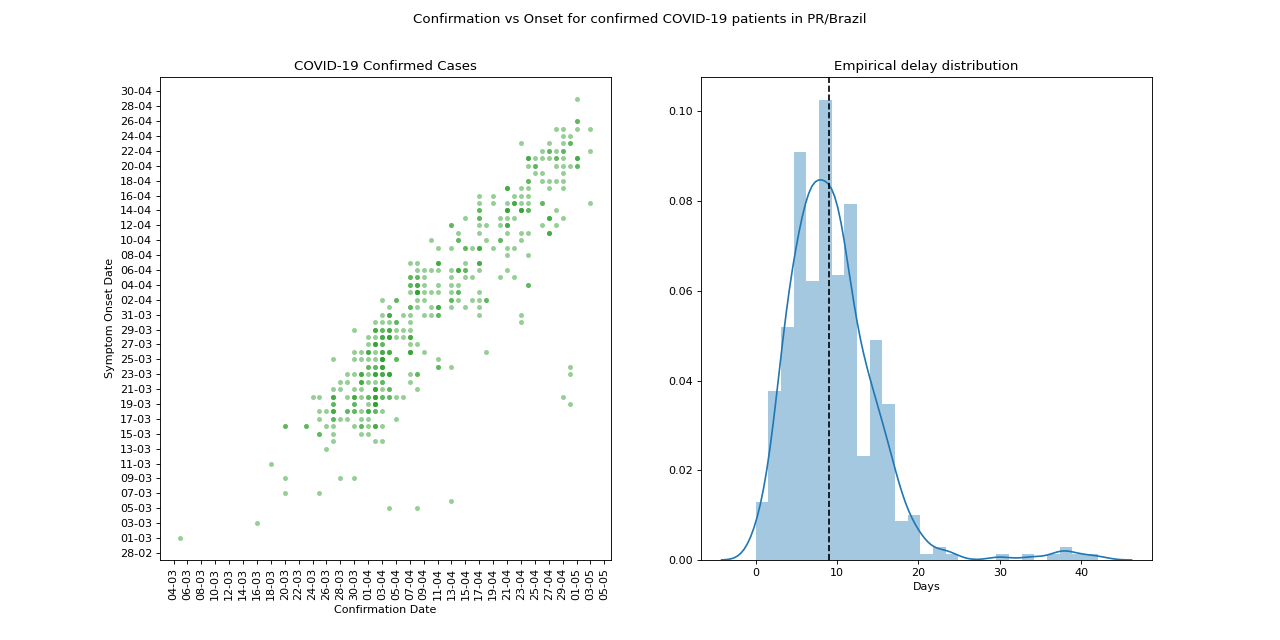
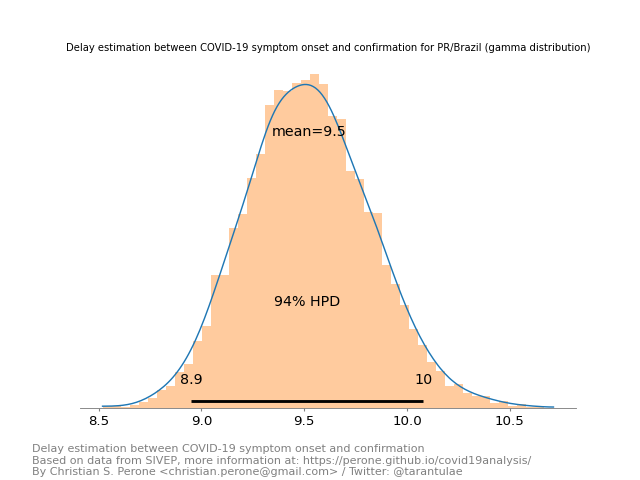
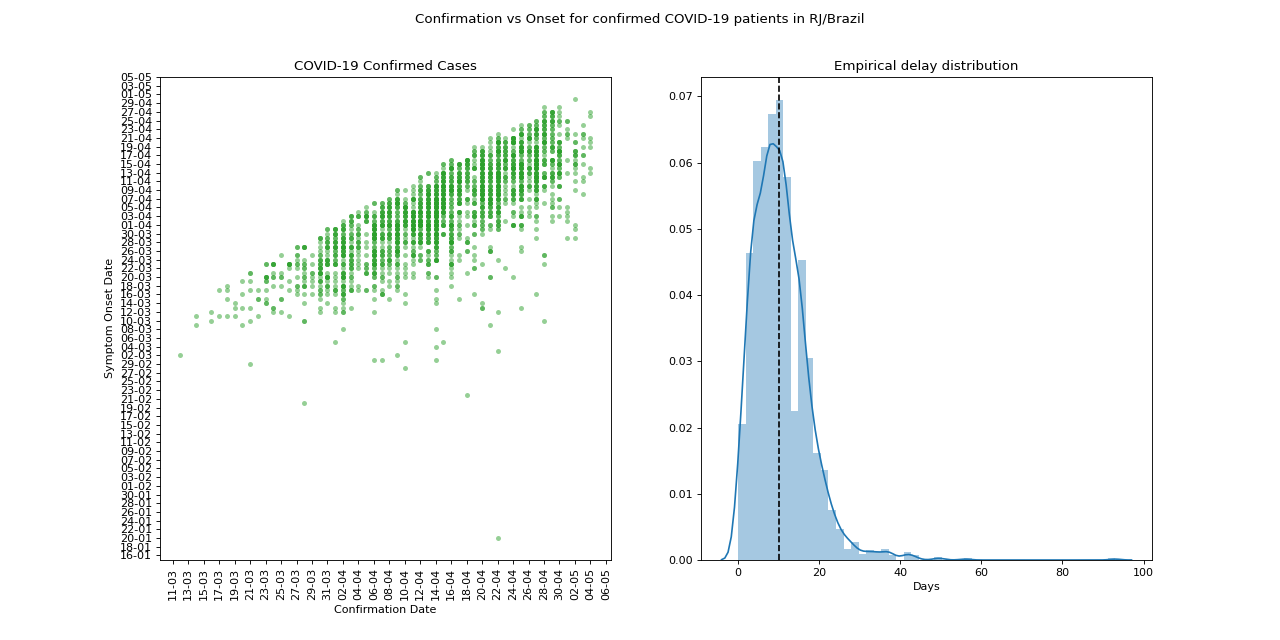
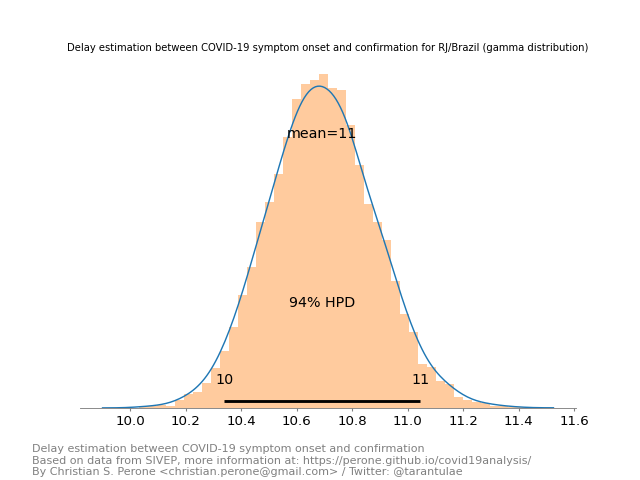
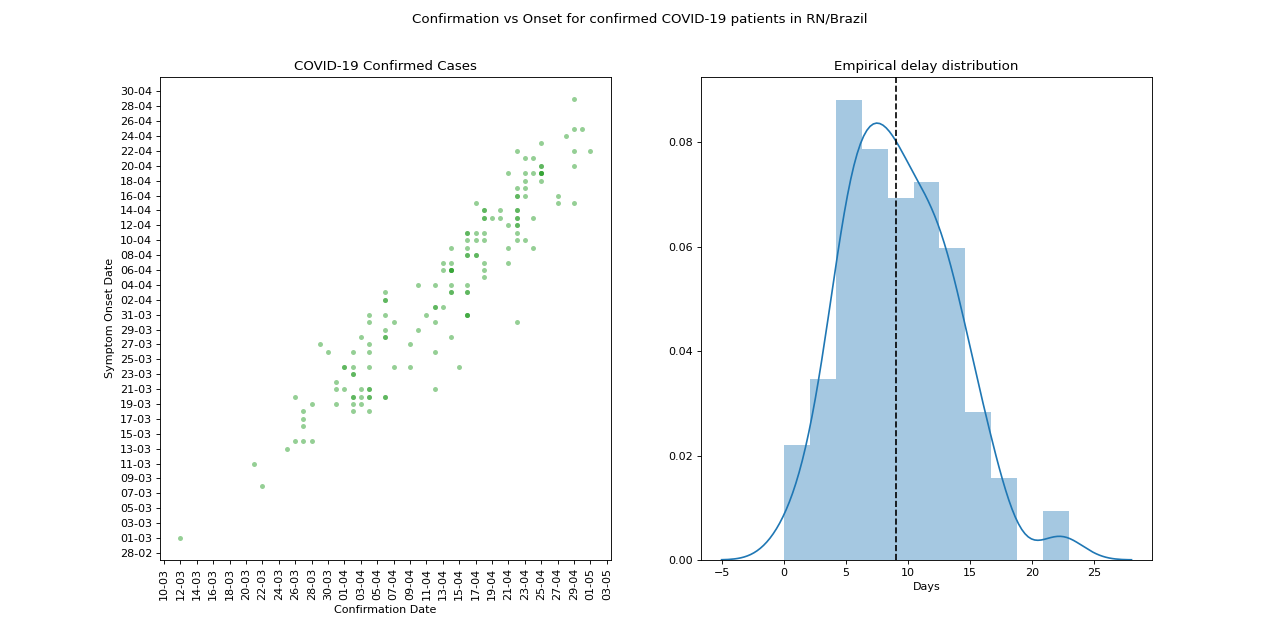
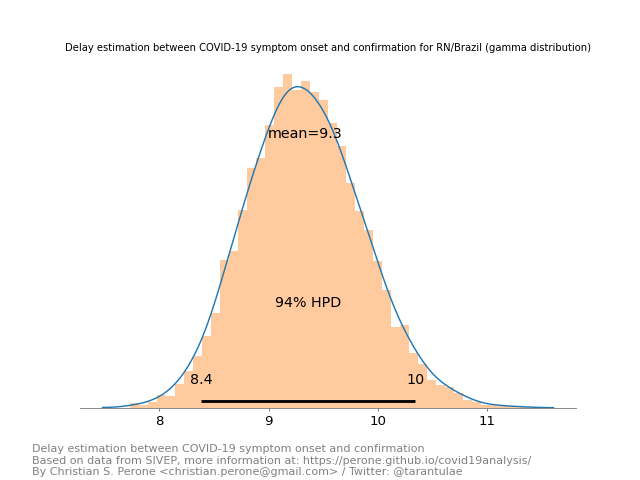
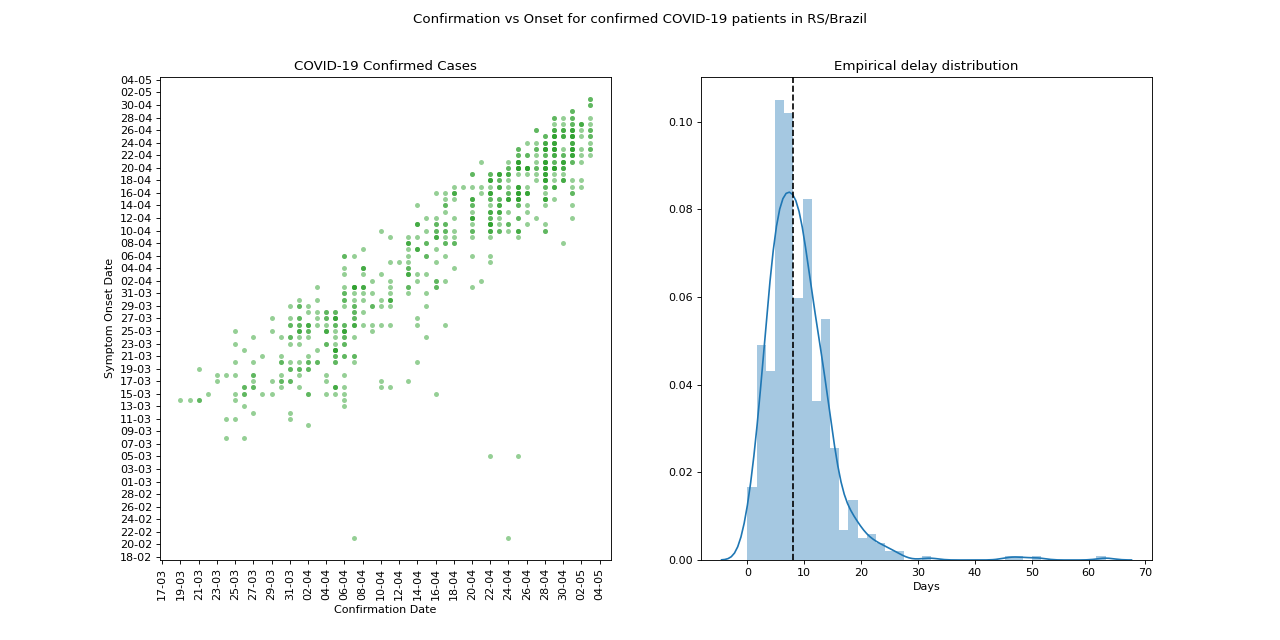
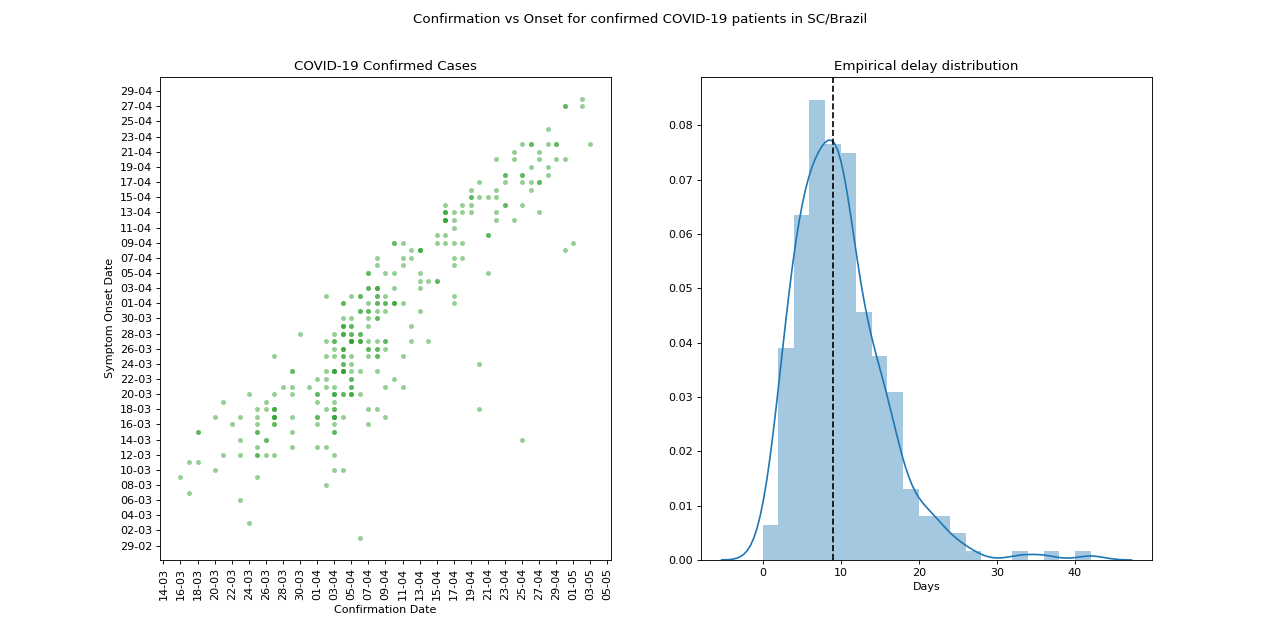
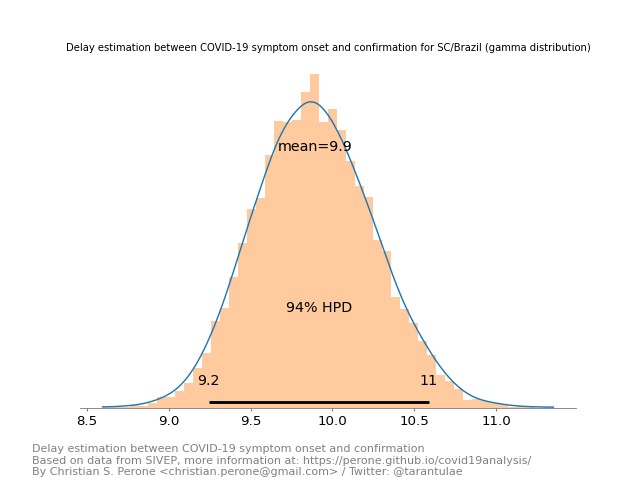
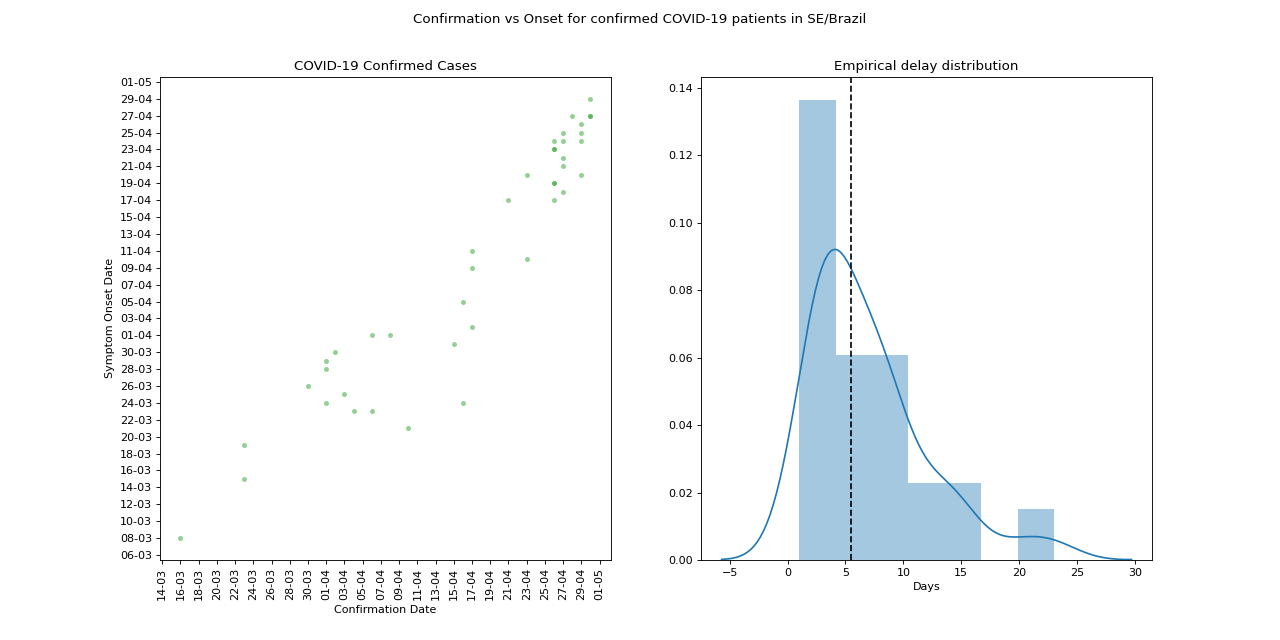
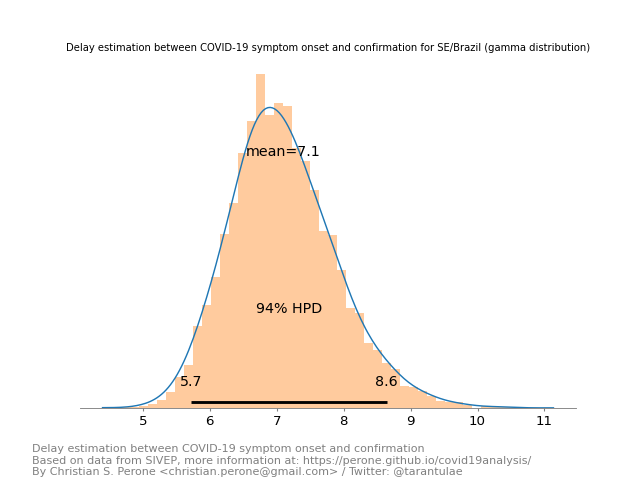
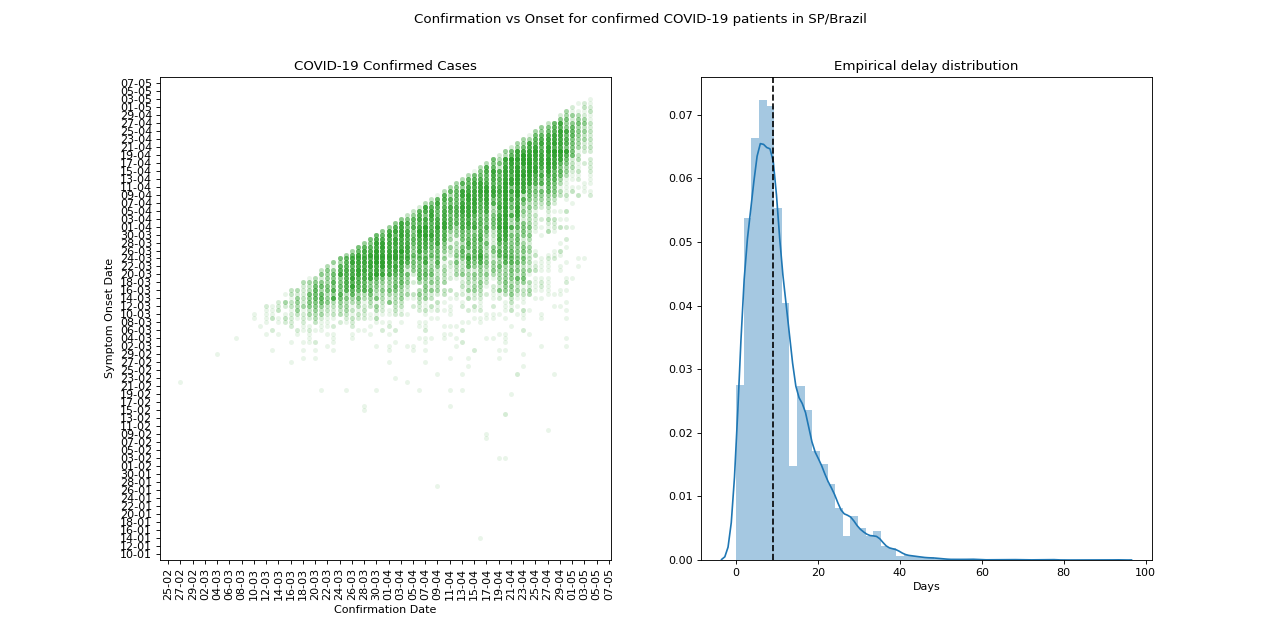
These plots show the estimation of the delay interval between the symptom onset date and confirmation date for confirmed COVID-19 patients. In the plot with two panels, you will see in the left a plot with green dots, where the darker the dot is the more patients had the same delay interval. On the right panel of this plot we have the empirical histogram distribution of the delays with a KDE approximation and the median showed as a dashed black line. Below this plot you have the posterior estimation for the mean of a Gamma distribution and with 94% credibility (HPD).
Some important points:
I only used data from states where we have more than 30 data points in the SIVED system, I’m planing to extend to small data regimes but that will require the implementation of evaluations for different distributions;
I’m modelling the data with a Gamma distribution and Half Normal priors with \(\sigma = 8.0\) both for the \(\sigma\) and \(\mu\) parametrization of the Gamma distribution;
SIVED data doesn’t include all testing done for all states and all cities;
The delay interval is defined as the time (in days) between the symptom onset and the date where the results of the test was available;
I’m not modelling the temporal changes of this delay, so the estimate distribution will end up with larger uncertainty due to this to cover up for these changes;
Note
This plot uses official data from SIVED system in Brazil, the maximum of the notification date for this data was 04/May. Thanks to Marcelo Oliveira and to Raphael Saldanha for the help with the SIVED dataset.
Summary for the last instantaneous reproduction number estimate
Summary for the last estimates
Last date on SIVED dataset: 04/May

Summary table for the last estimates
| State | Mean estimated of Gamma dist. (94% HPD credibility) |
|---|---|
| GO | 9.37 (8.54 - 10.21) |
| MG | 11.17 (10.51 - 11.88) |
| PA | 10.60 (9.91 - 11.29) |
| CE | 11.22 (10.85 - 11.57) |
| BA | 7.57 (6.96 - 8.20) |
| PR | 9.52 (8.95 - 10.08) |
| SC | 9.89 (9.24 - 10.59) |
| PE | 9.88 (9.49 - 10.27) |
| RS | 9.11 (8.61 - 9.62) |
| MT | 10.16 (9.16 - 11.20) |
| RN | 9.34 (8.38 - 10.35) |
| SP | 10.95 (10.78 - 11.12) |
| PI | 8.49 (7.51 - 9.49) |
| AL | 8.20 (6.75 - 9.68) |
| MS | 7.61 (6.64 - 8.62) |
| DF | 7.68 (6.28 - 9.26) |
| ES | 9.99 (8.65 - 11.29) |
| PB | 8.72 (7.89 - 9.58) |
| MA | 8.56 (7.31 - 9.78) |
| AM | 11.03 (10.56 - 11.51) |
| RJ | 10.69 (10.34 - 11.05) |
| SE | 7.10 (5.72 - 8.64) |
State: Alagoas / AL
Scatter plot of symptom onset vs confirmation and empirical distribution
Posterior distribution for the mean of the Gamma distribution
State: Amazonas / AM
Scatter plot of symptom onset vs confirmation and empirical distribution
Posterior distribution for the mean of the Gamma distribution
State: Bahia / BA
Scatter plot of symptom onset vs confirmation and empirical distribution
Posterior distribution for the mean of the Gamma distribution

State: Ceará / CE
Scatter plot of symptom onset vs confirmation and empirical distribution
Posterior distribution for the mean of the Gamma distribution
State: Distrito Federal / DF
Scatter plot of symptom onset vs confirmation and empirical distribution
Posterior distribution for the mean of the Gamma distribution
State: Espírito Santo / ES
Scatter plot of symptom onset vs confirmation and empirical distribution
Posterior distribution for the mean of the Gamma distribution
State: Goiás / GO
Scatter plot of symptom onset vs confirmation and empirical distribution
Posterior distribution for the mean of the Gamma distribution
State: Maranhão / MA
Scatter plot of symptom onset vs confirmation and empirical distribution
Posterior distribution for the mean of the Gamma distribution
State: Minas Gerais / MG
Scatter plot of symptom onset vs confirmation and empirical distribution
Posterior distribution for the mean of the Gamma distribution
State: Mato Grosso do Sul / MS
Scatter plot of symptom onset vs confirmation and empirical distribution
Posterior distribution for the mean of the Gamma distribution
State: Mato Grosso / MT
Scatter plot of symptom onset vs confirmation and empirical distribution
Posterior distribution for the mean of the Gamma distribution
State: Pará / PA
Scatter plot of symptom onset vs confirmation and empirical distribution

Posterior distribution for the mean of the Gamma distribution
State: Paraíba / PB
Scatter plot of symptom onset vs confirmation and empirical distribution
Posterior distribution for the mean of the Gamma distribution

State: Pernambuco / PE
Scatter plot of symptom onset vs confirmation and empirical distribution
Posterior distribution for the mean of the Gamma distribution
State: Piauí / PI
Scatter plot of symptom onset vs confirmation and empirical distribution
Posterior distribution for the mean of the Gamma distribution
State: Paraná / PR
Scatter plot of symptom onset vs confirmation and empirical distribution
Posterior distribution for the mean of the Gamma distribution
State: Rio de Janeiro / RJ
Scatter plot of symptom onset vs confirmation and empirical distribution
Posterior distribution for the mean of the Gamma distribution
State: Rio Grande do Norte / RN
Scatter plot of symptom onset vs confirmation and empirical distribution
Posterior distribution for the mean of the Gamma distribution
State: Rio Grande do Sul / RS
Scatter plot of symptom onset vs confirmation and empirical distribution
Posterior distribution for the mean of the Gamma distribution

State: Santa Catarina / SC
Scatter plot of symptom onset vs confirmation and empirical distribution
Posterior distribution for the mean of the Gamma distribution
State: Sergipe / SE
Scatter plot of symptom onset vs confirmation and empirical distribution
Posterior distribution for the mean of the Gamma distribution
State: São Paulo / SP
Scatter plot of symptom onset vs confirmation and empirical distribution
Posterior distribution for the mean of the Gamma distribution