20/April – COVID-19 Time varying reproduction numbers estimation for Brazil
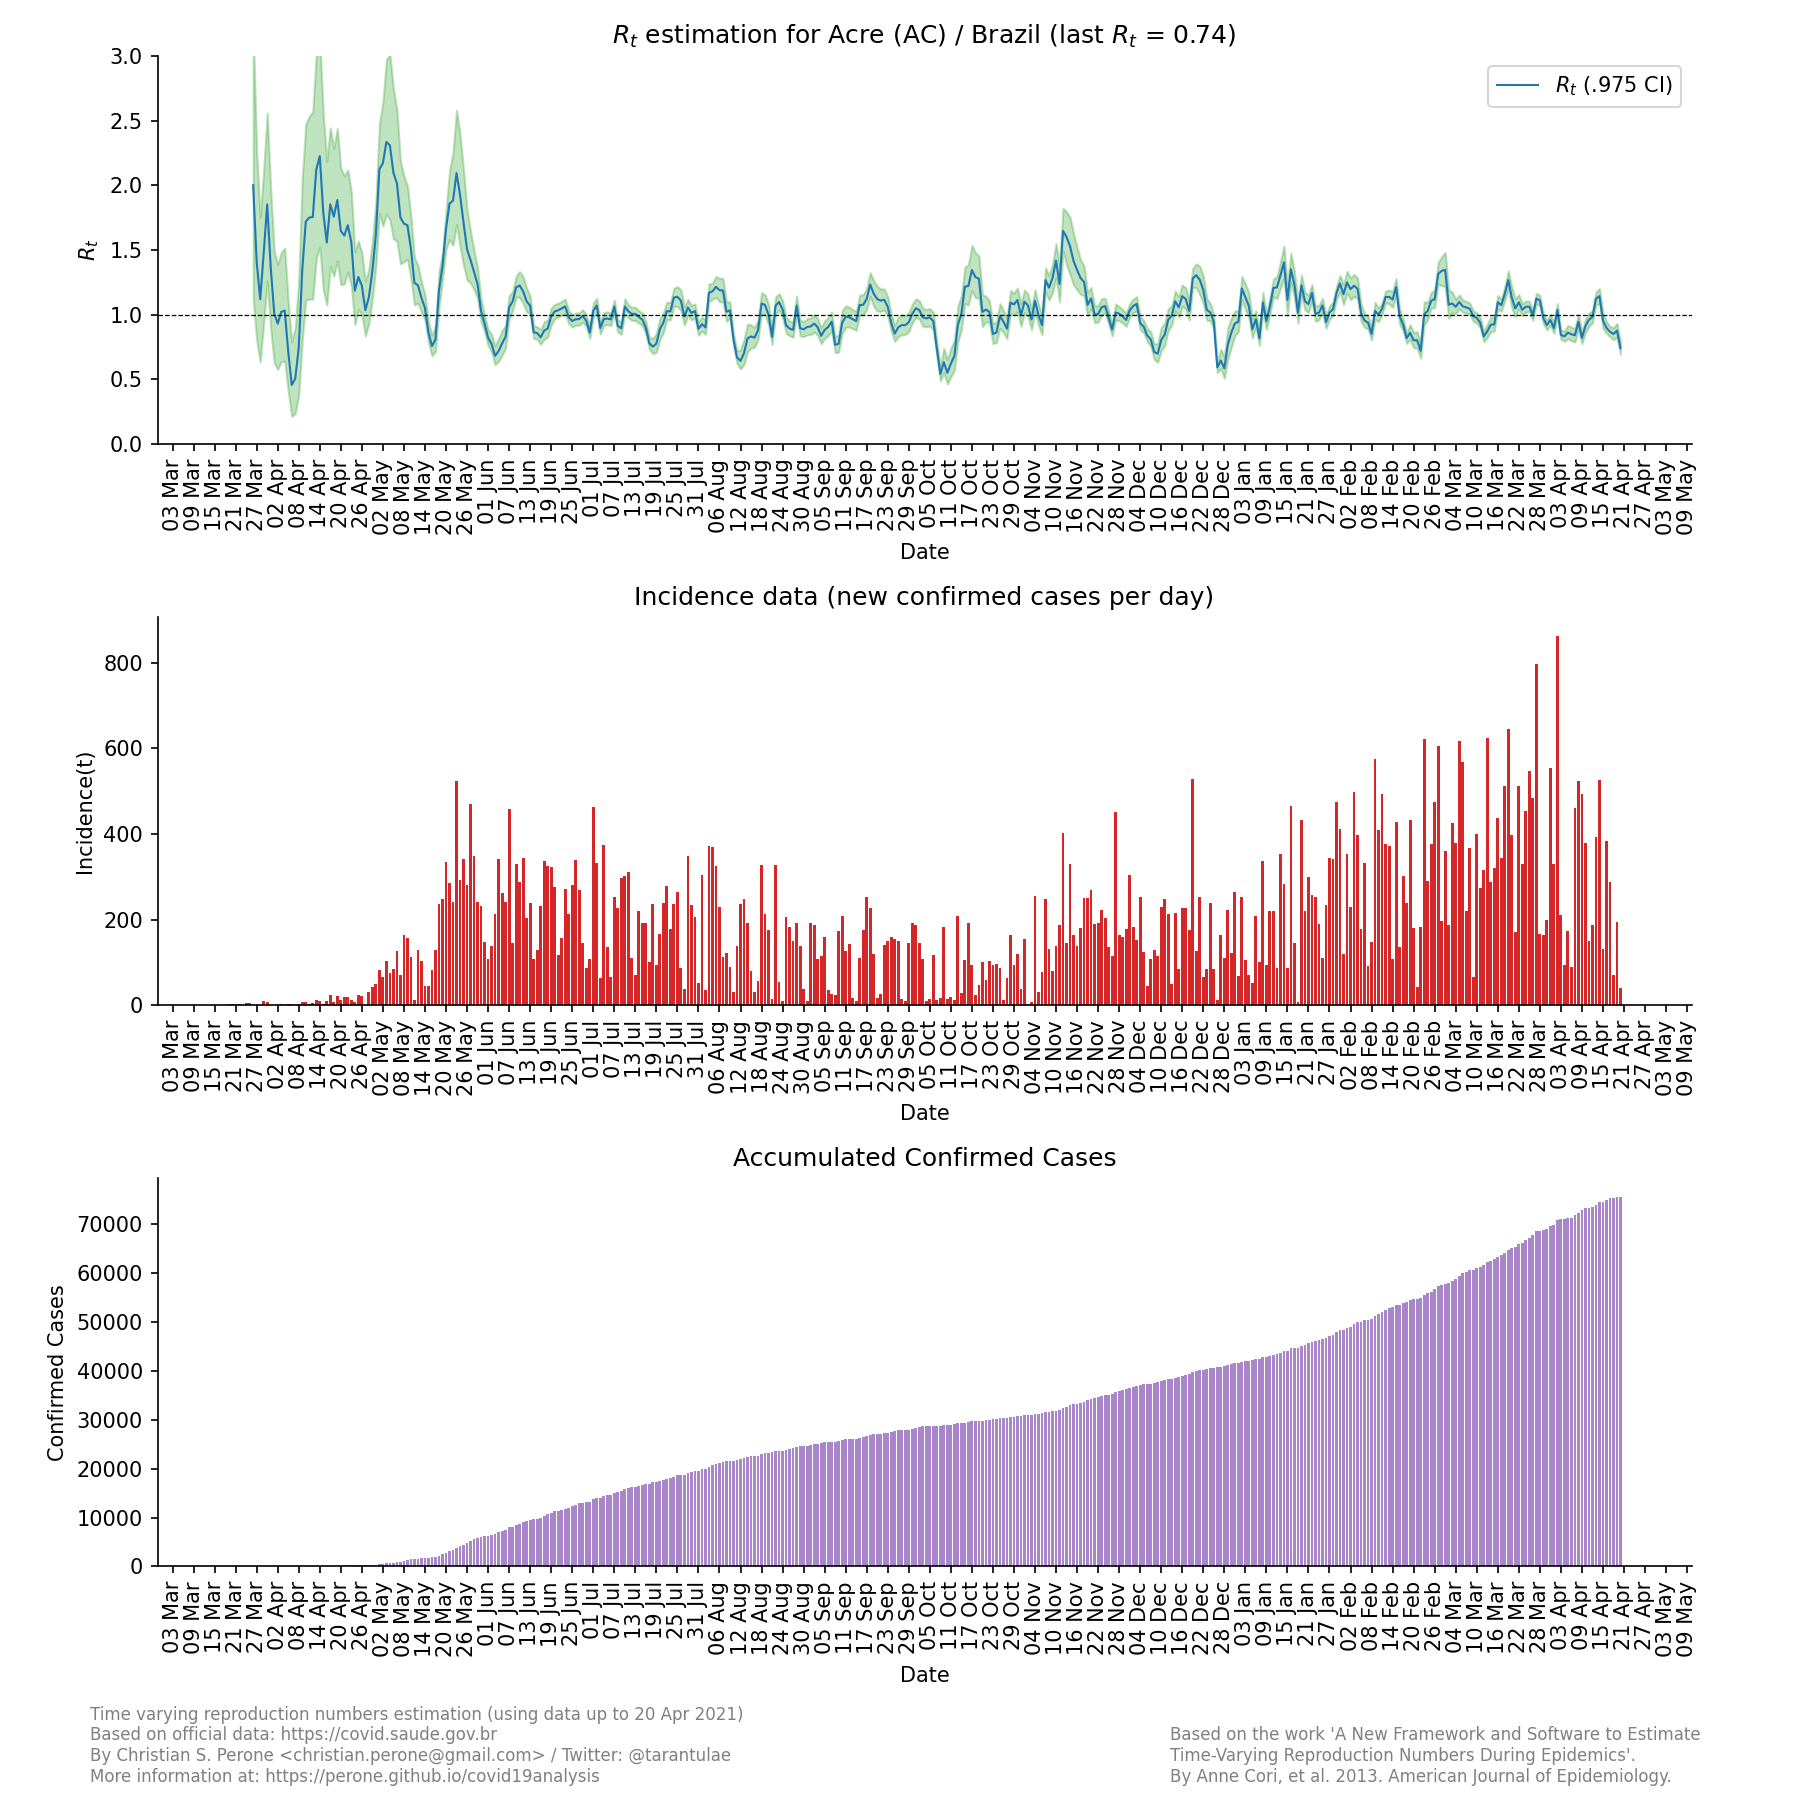
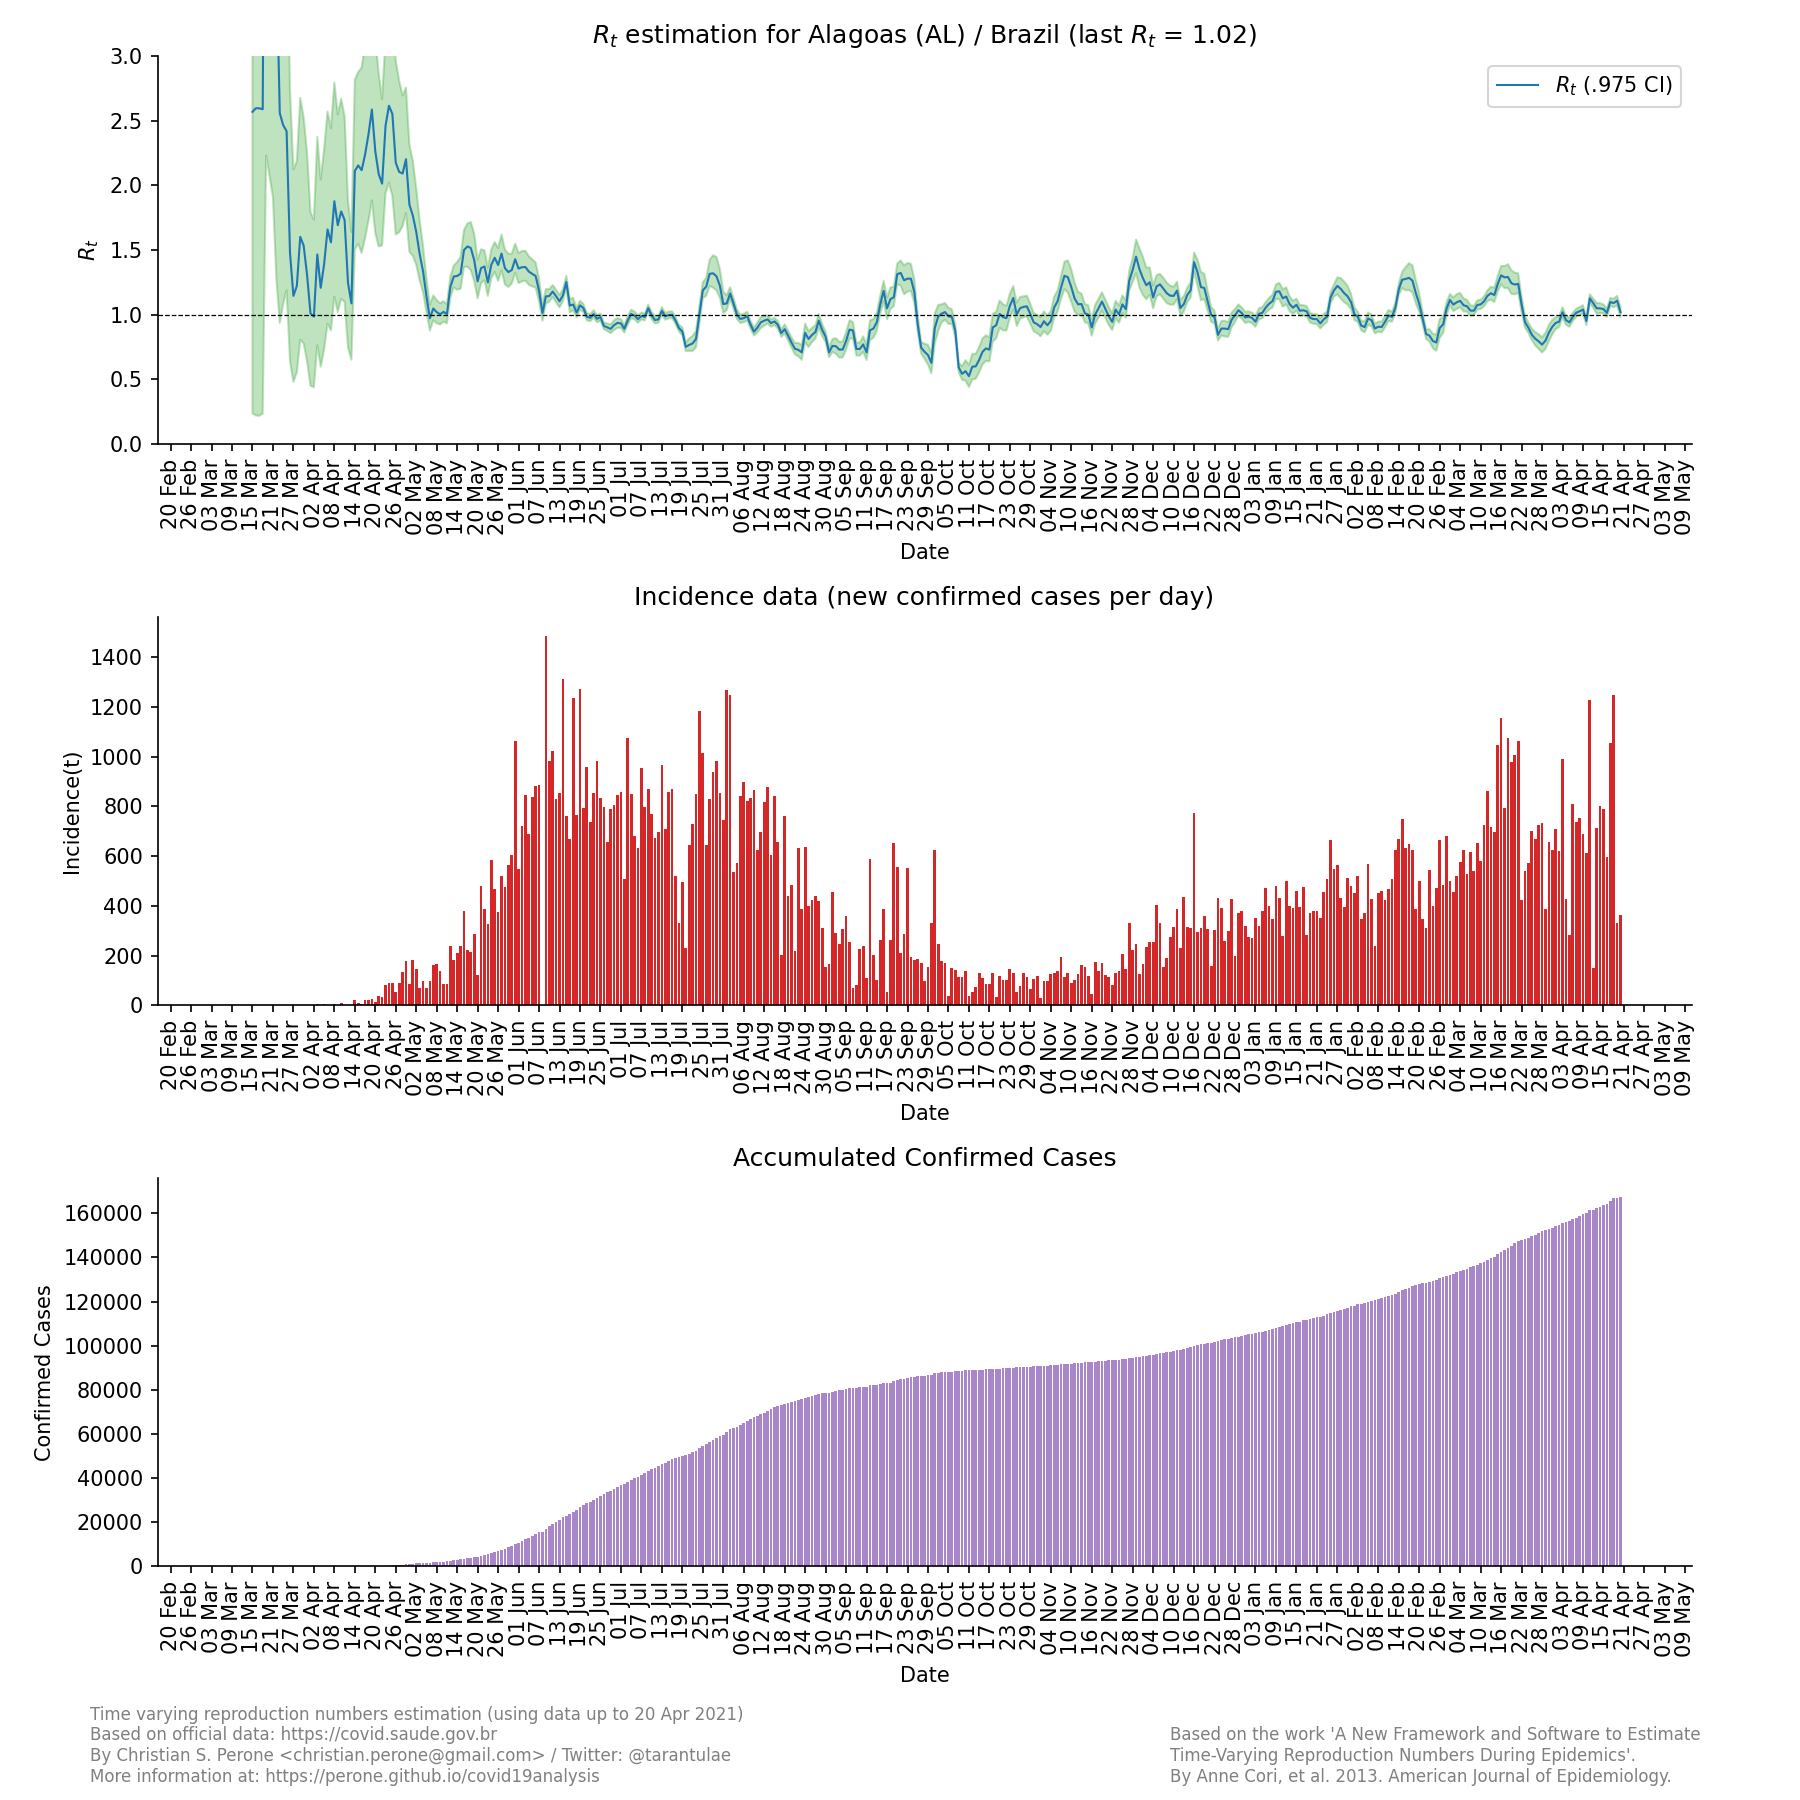
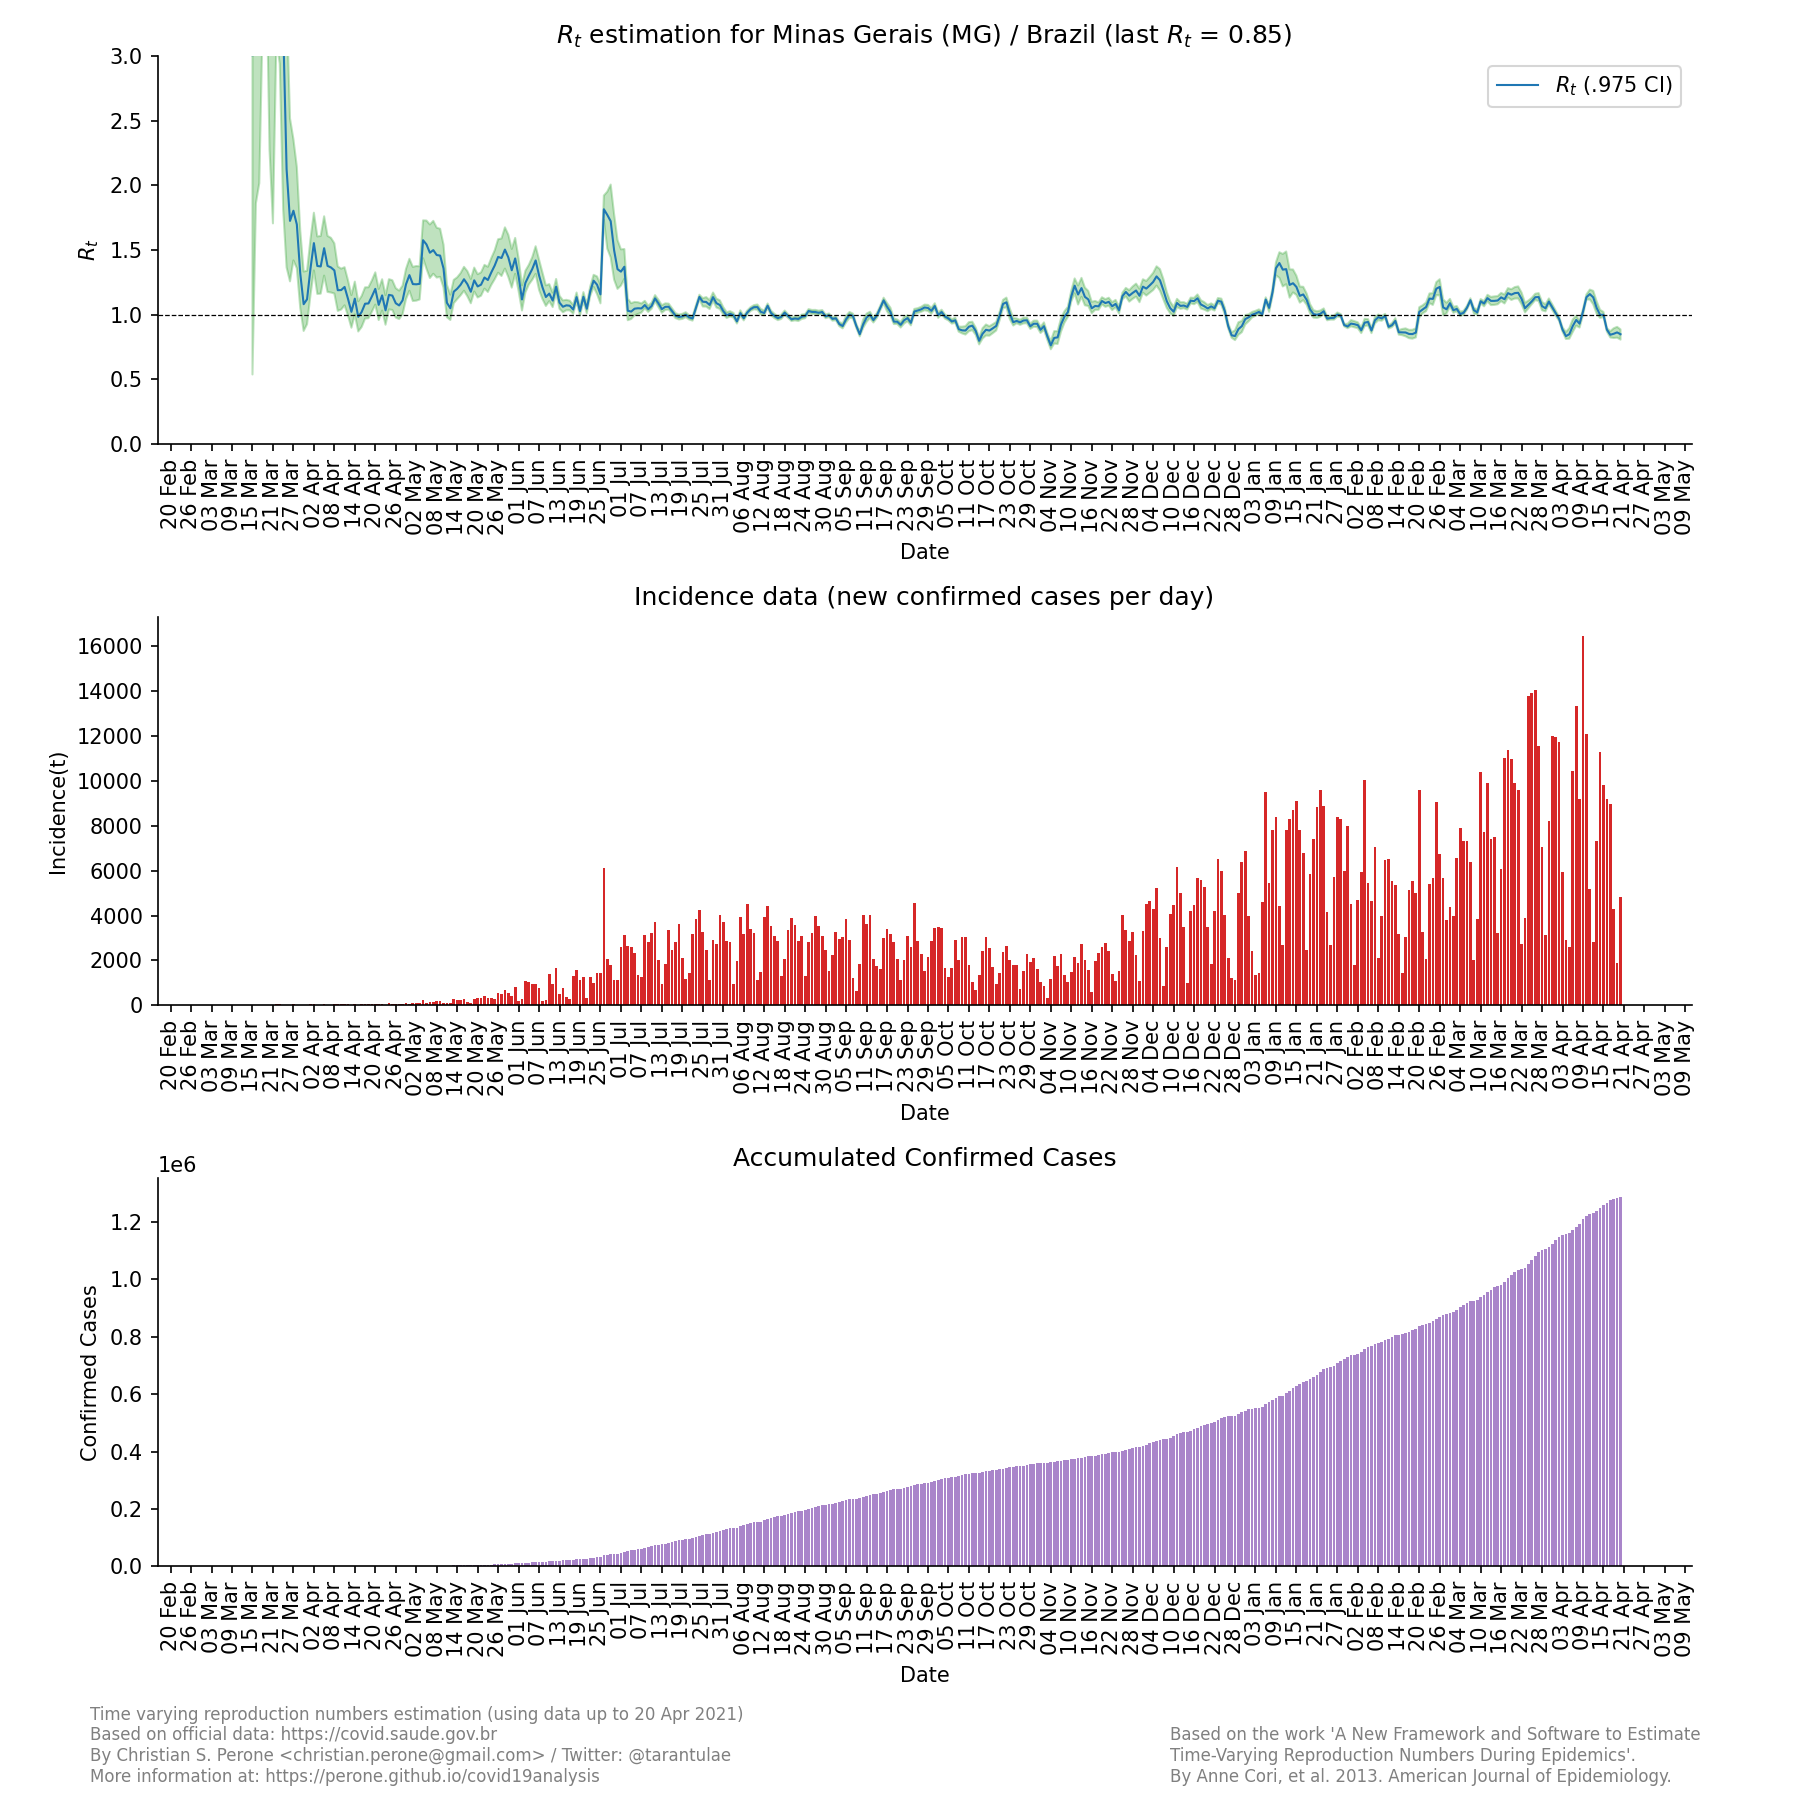
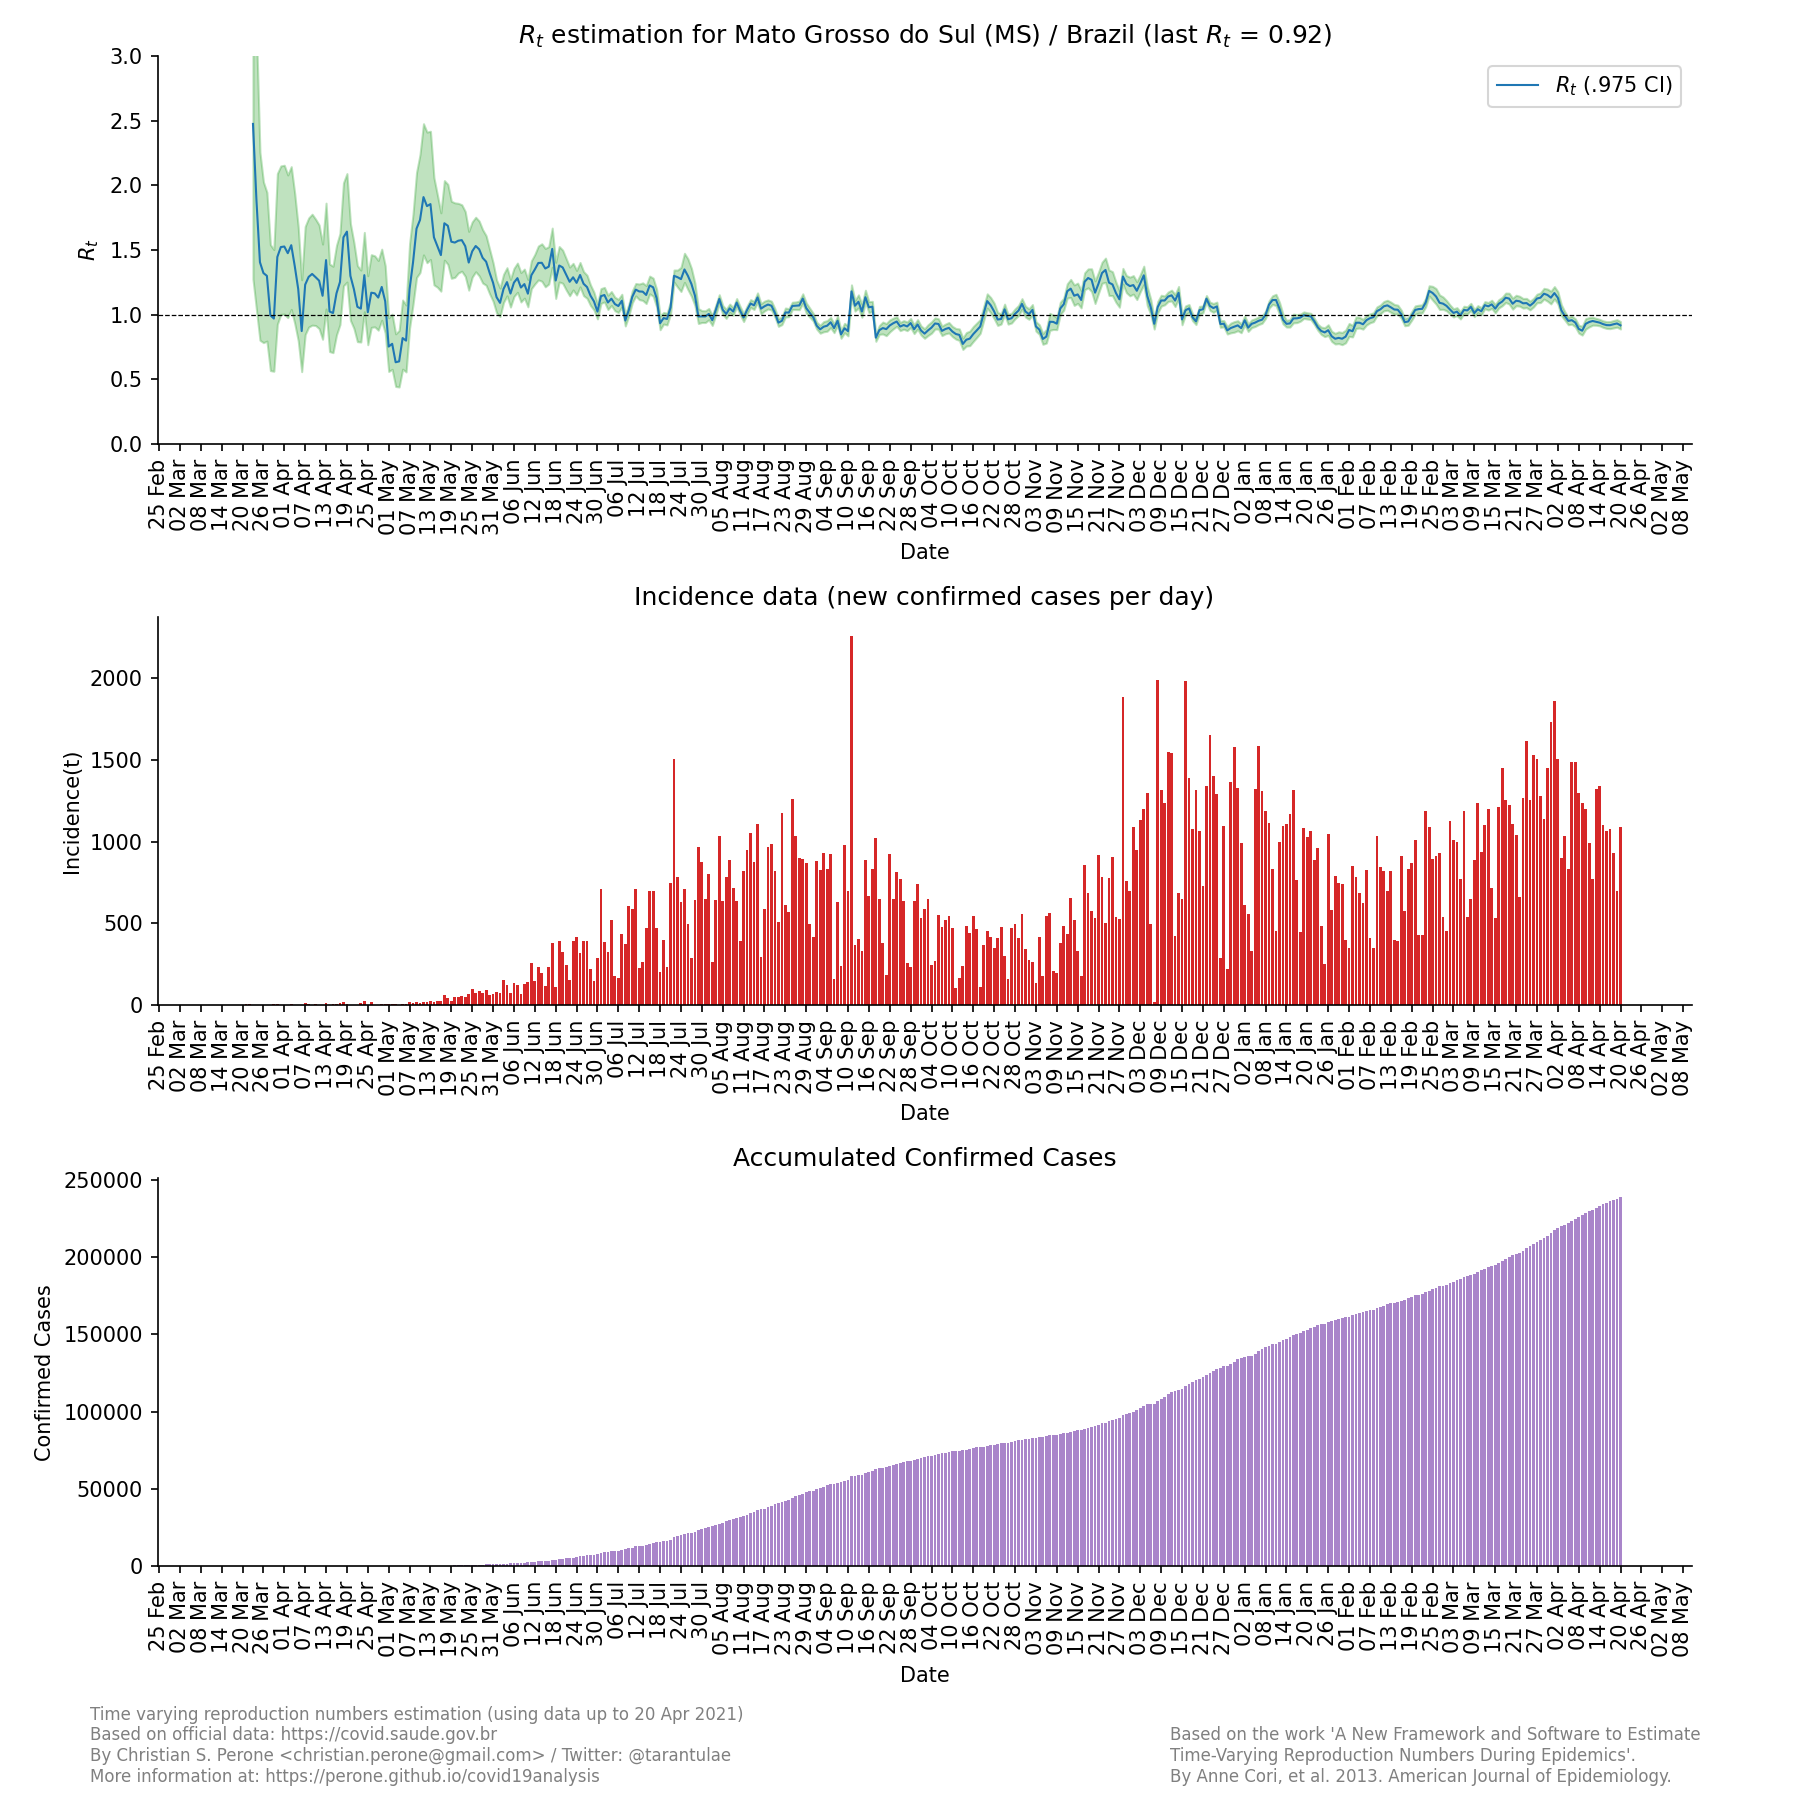
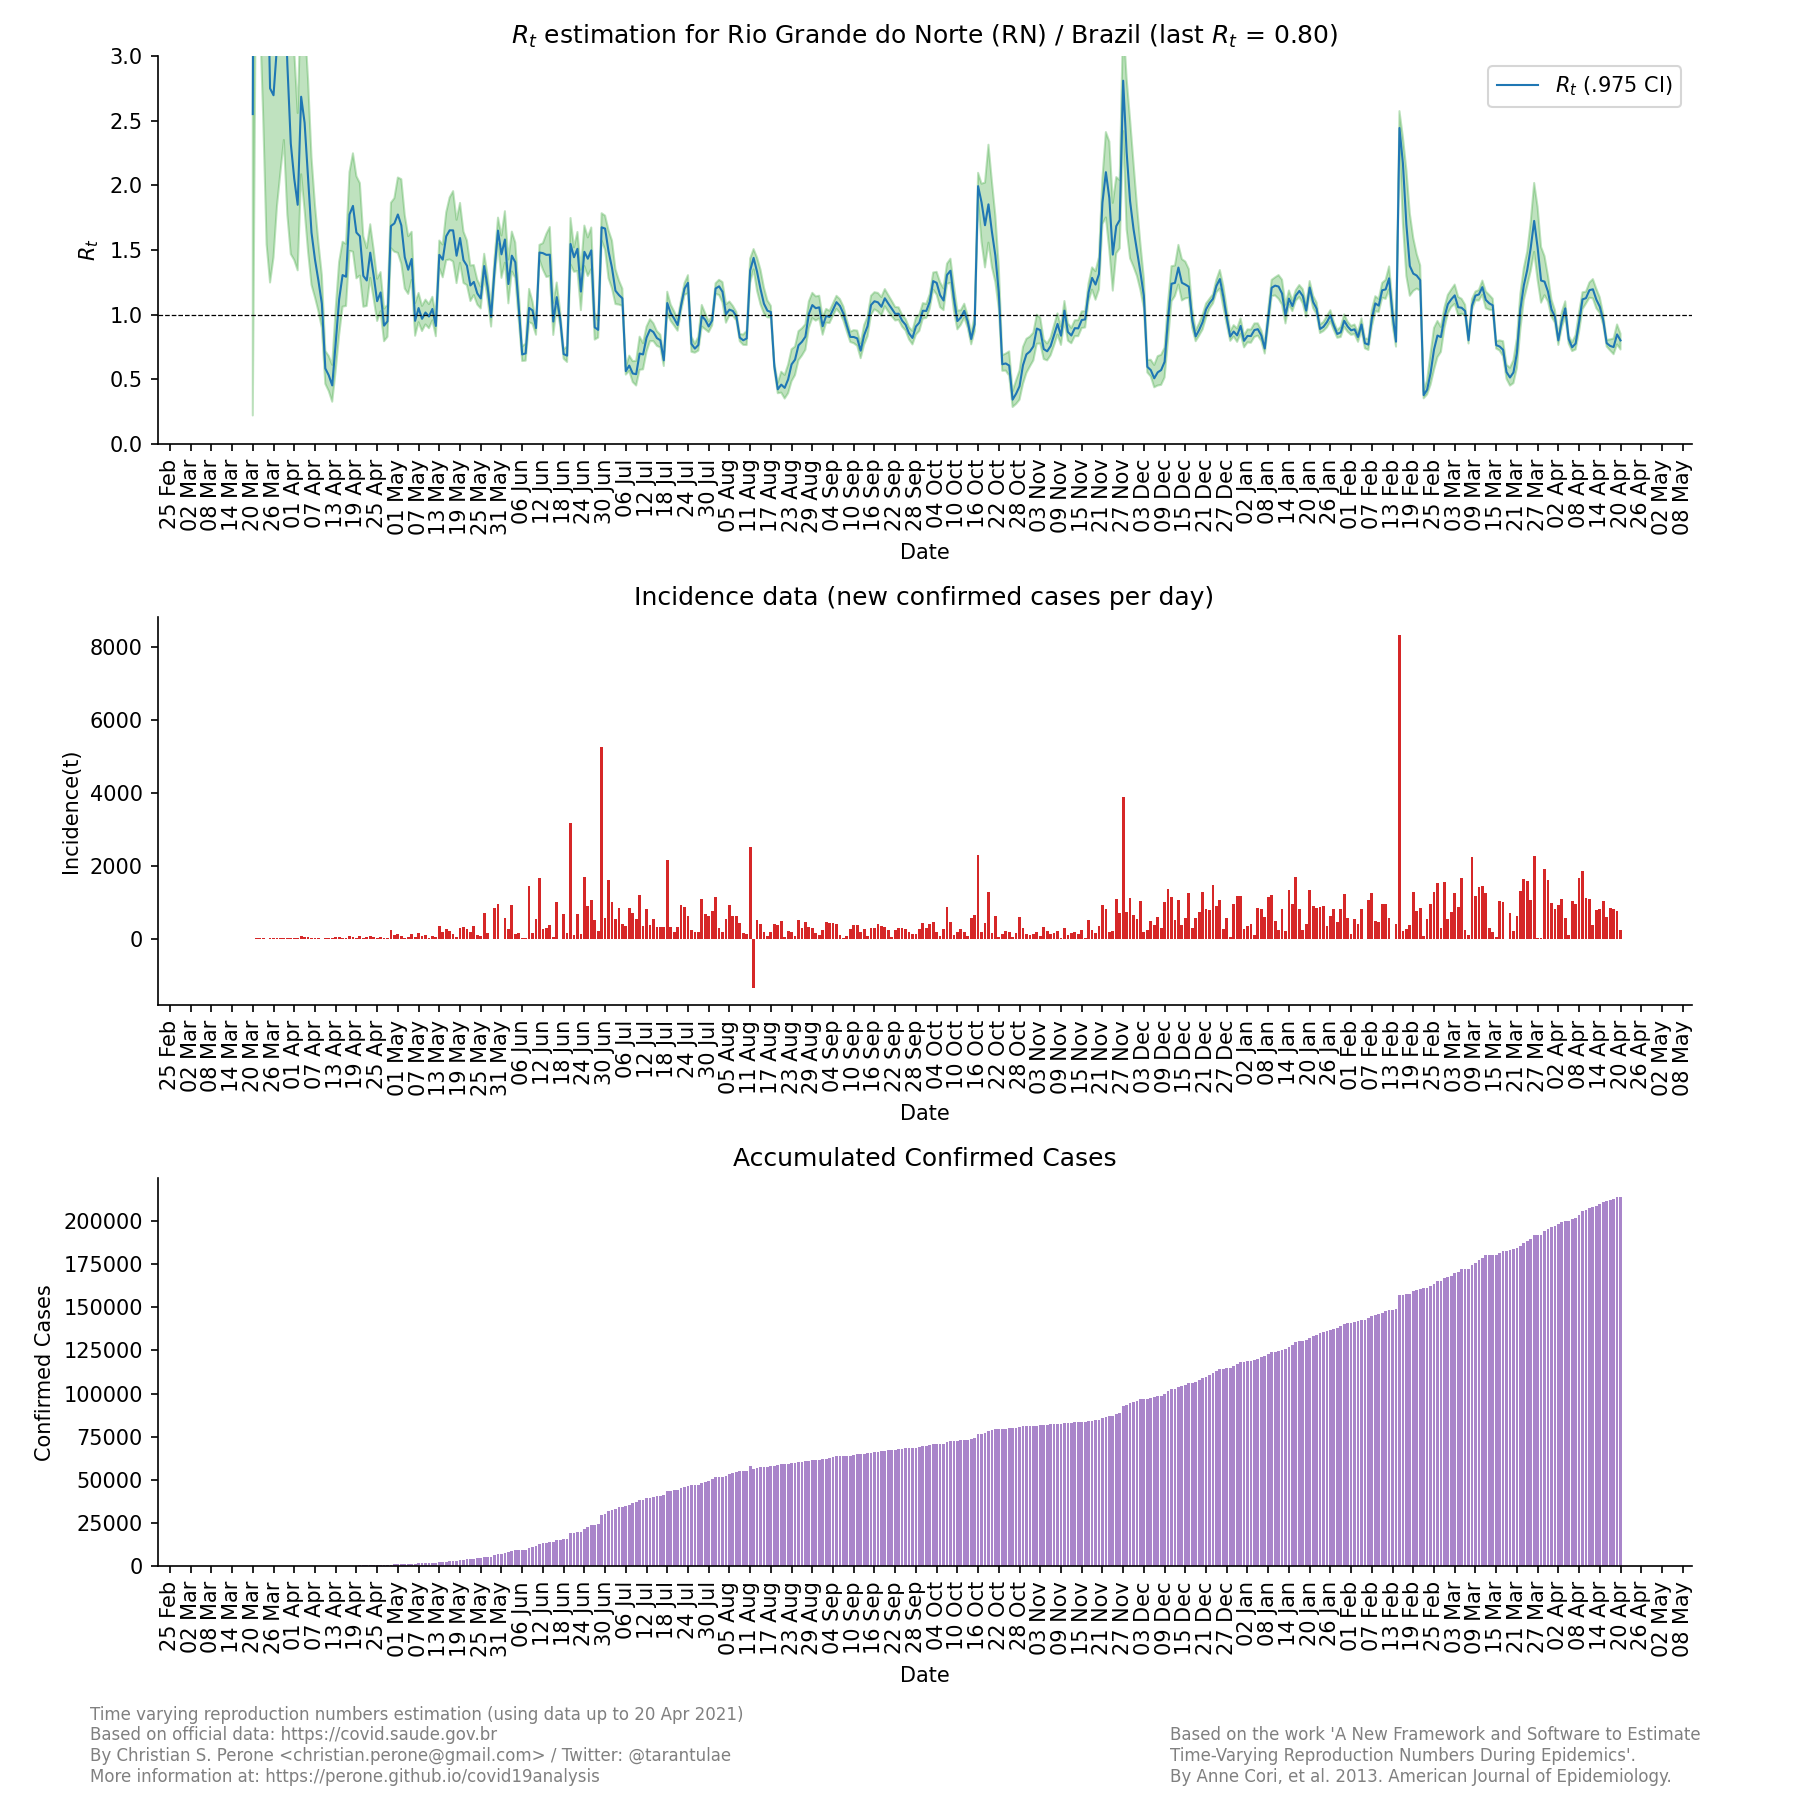
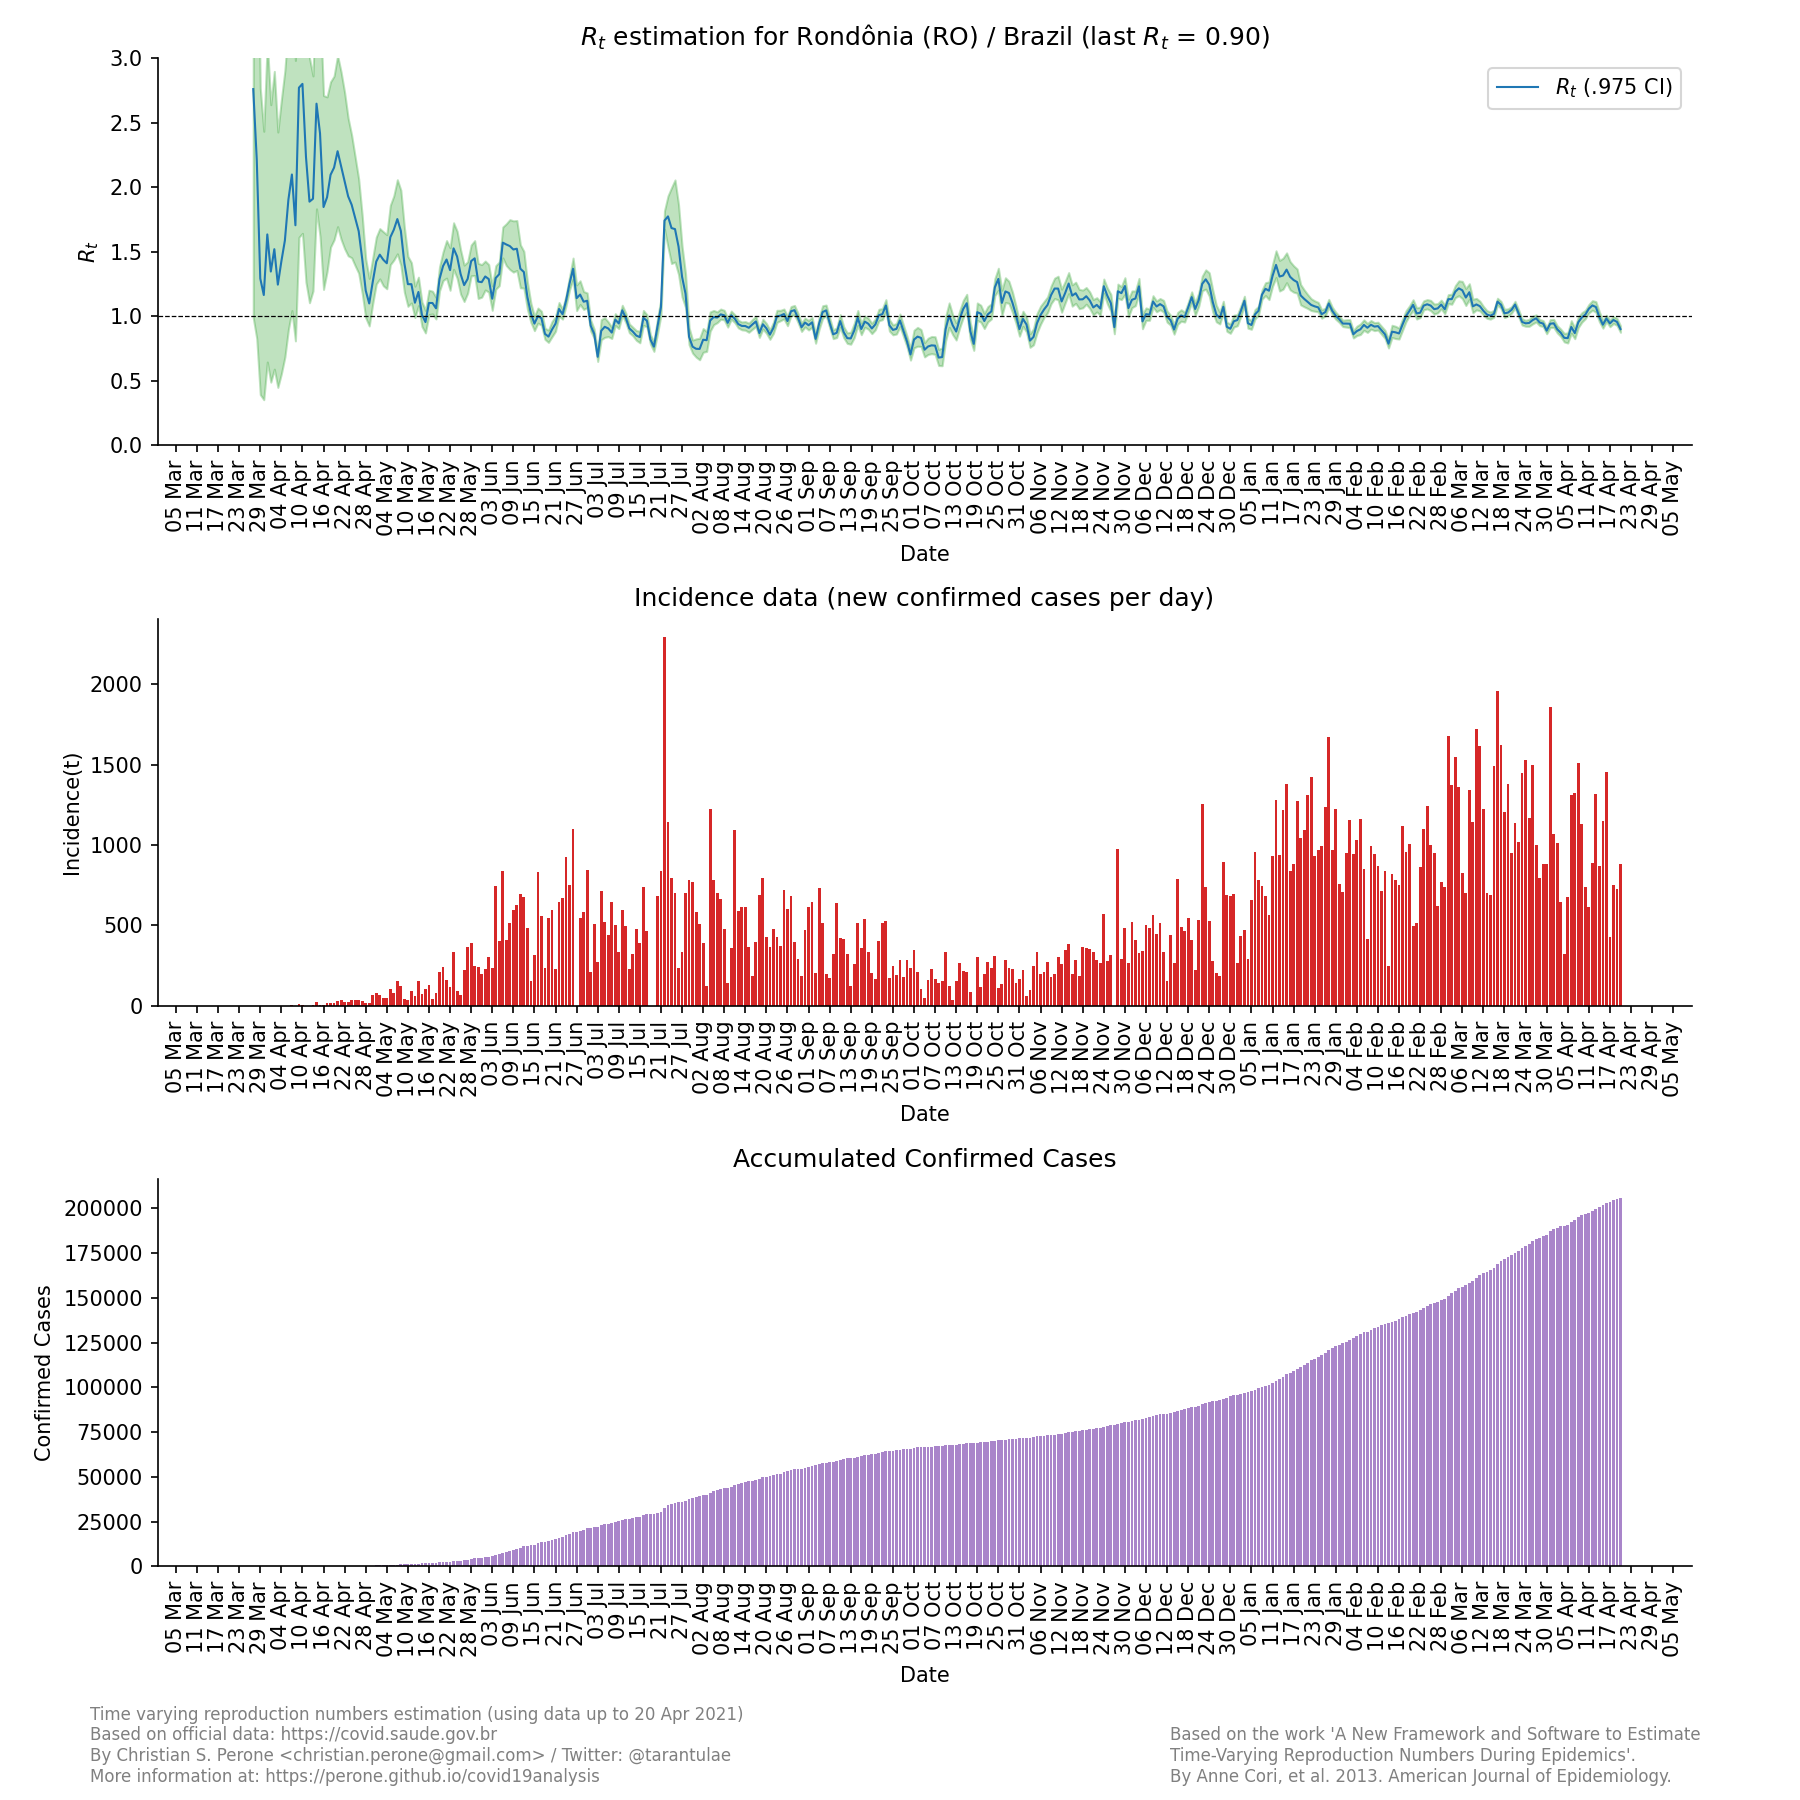
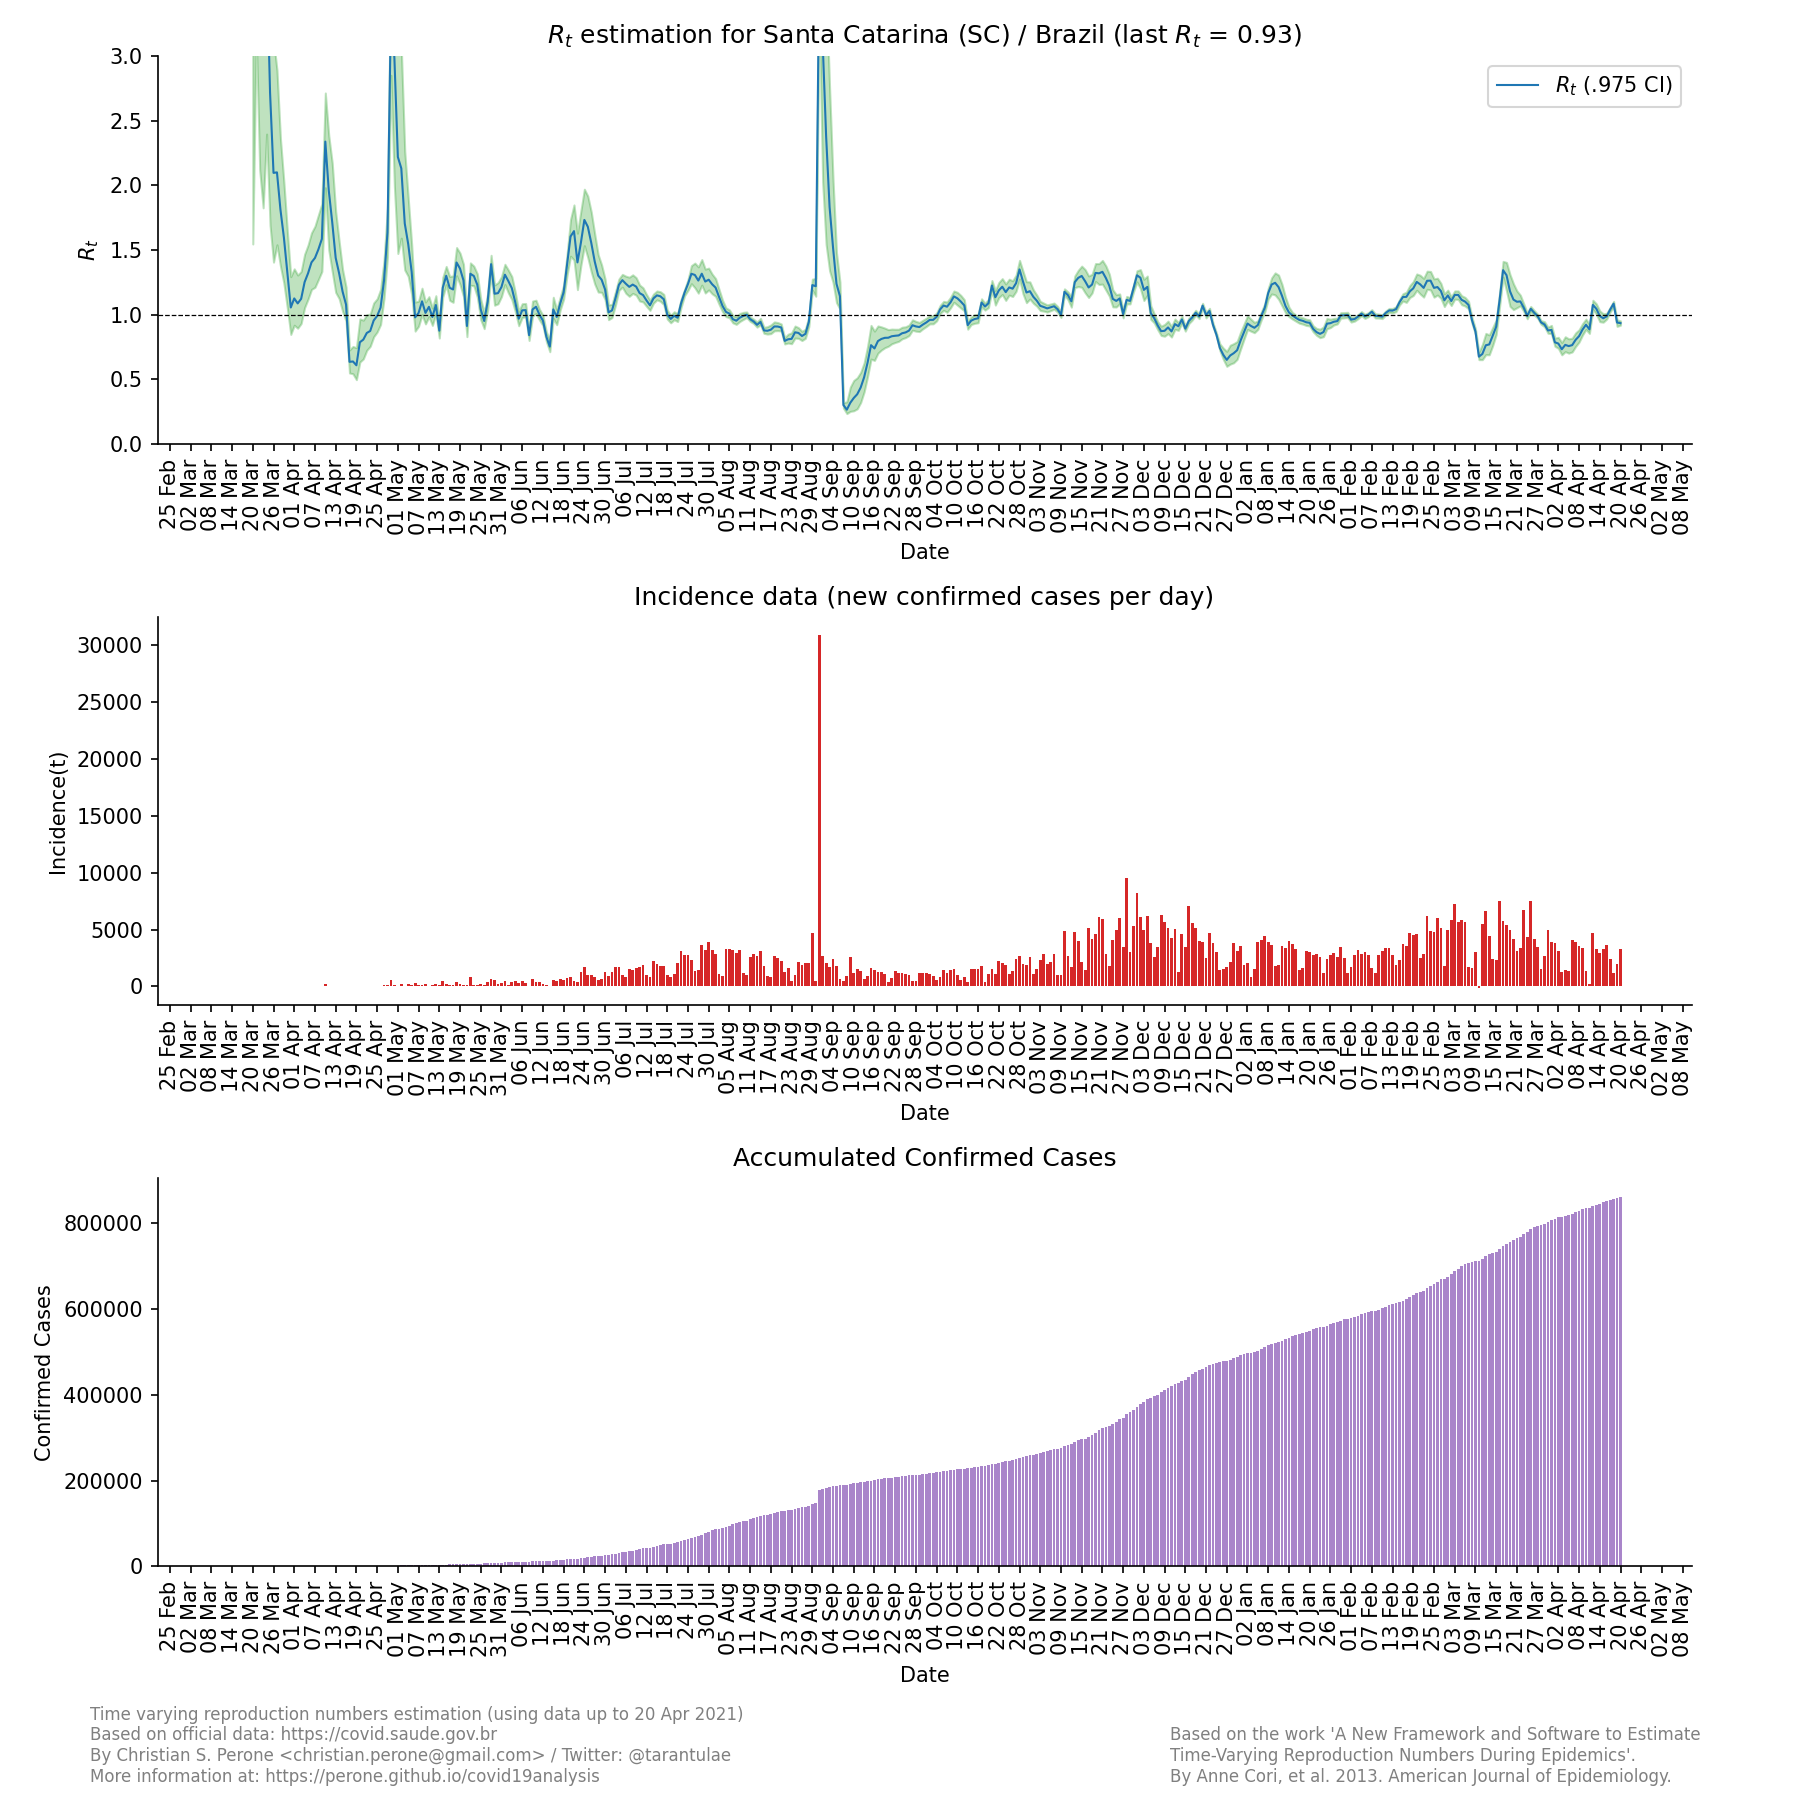
These plots show the estimation of the instantaneous reproduction number for all the states in Brazil. These reports uses the method described in the work A New Framework and Software to Estimate Time-Varying Reproduction Numbers During Epidemics. We used the serial interval parameters similar to the ones used by CMMID with a \(\mu = 4.7 (3.7 - 6.0)\) and \(\sigma = 2.9 (1.9 - 4.9)\).
Note
This plot uses official data from government, reports until 20/April. This method is sensitive to changes in COVID-19 testing procedures and the level of effort used to detect cases. Therefore, changes in the testing efforts will introduce bias if the testing practices are not kept consistent. So please keep in mind these limitations, that are often not stated in many analysis around there. Imported cases weren’t also considered in this analysis, neither the delay of the symptoms onset and reporting.
Warning
Remember that this is the instantaneous reproduction number, therefore when it is below 1.0 for one or two days, it doesn’t mean everything is ok. This method is less sensitive to under-reporting but as long as the bias is constant. So please, read the plots with the limitations in mind. As an example, Portugal had an R(t) below 1.0 for almost 3 weeks before relaxing interventions, so keep in mind that it is not about being below 1.0 for a single day but for weeks.
![]()
Summary for the last instantaneous reproduction number estimate
Map for the accumulated cases
Map for the last instantaneous reproduction number estimate
Map of states with mean reproduction number R(t) > 1.0
Map for the accumulated deaths by COVID-19
Summary for the last instantaneous reproduction number estimate
Last update: 20/April

Summary for recent median instantaneous reproduction number estimate
Last update: 20/April
The median R(t) estimates are clipped in 2.0 to avoid issues with the colormap.
Summary table for the last instantaneous reproduction number estimate
| State | Mean Estimated R (CI 0.975) |
|---|---|
| MA | 1.15 (1.10 - 1.20) |
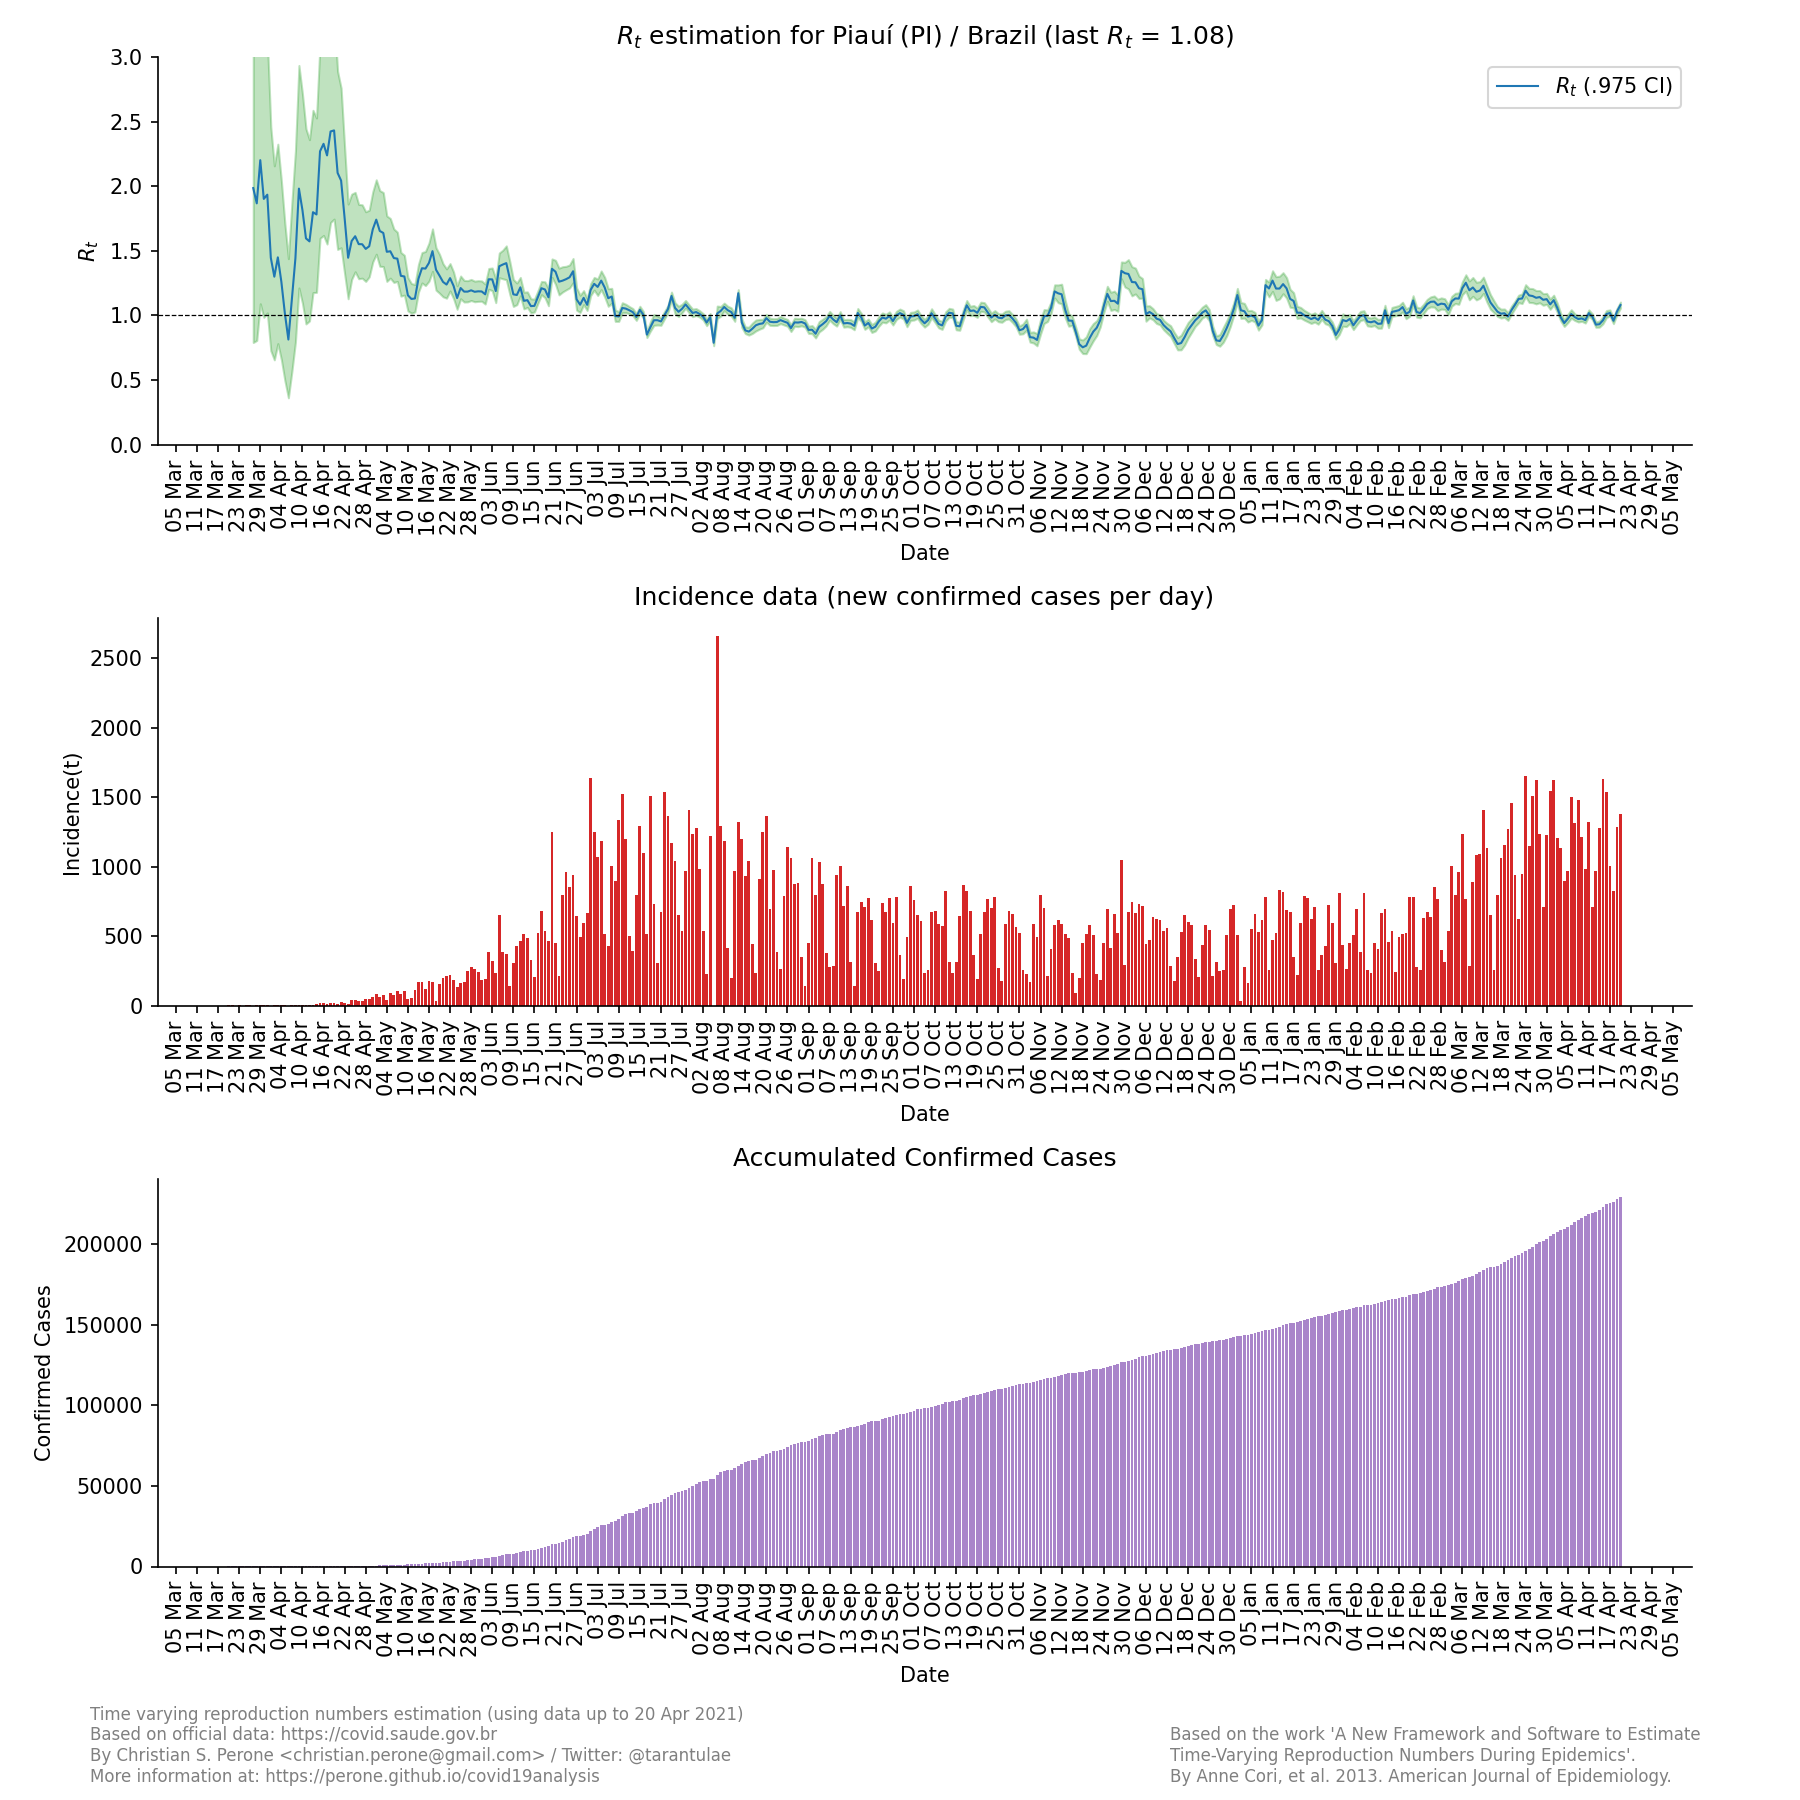
| PI | 1.08 (1.06 - 1.10) |
| RJ | 1.06 (1.04 - 1.08) |
| SE | 1.03 (1.01 - 1.06) |
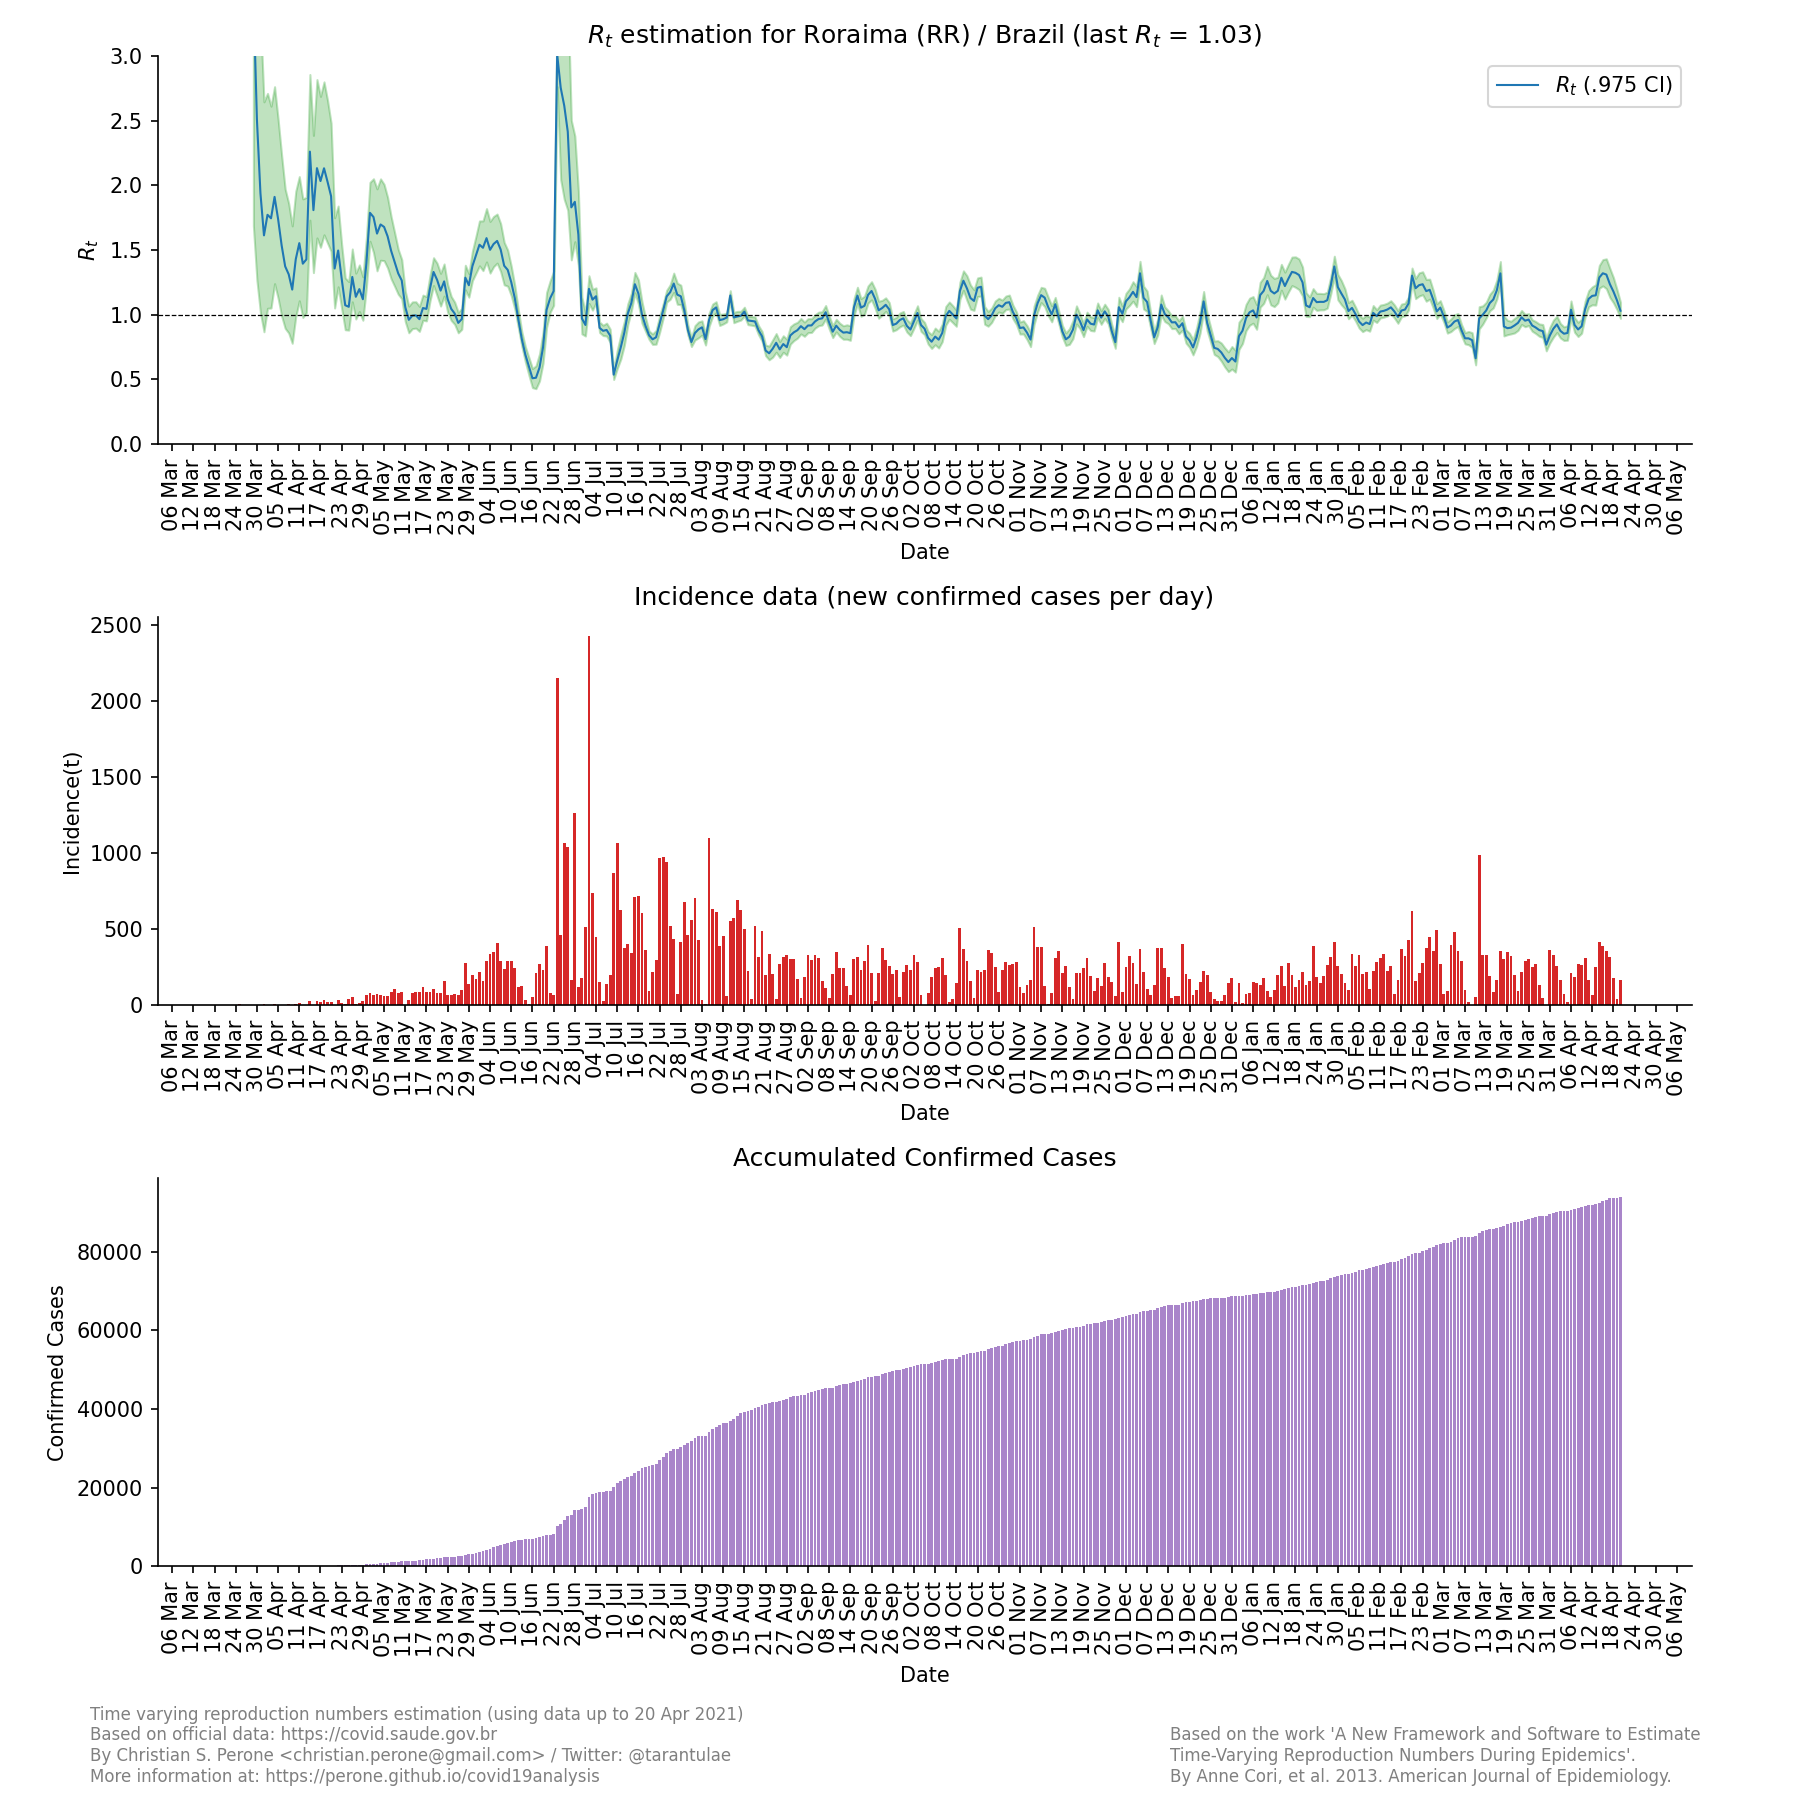
| RR | 1.03 (0.97 - 1.10) |
| PE | 1.03 (1.01 - 1.05) |
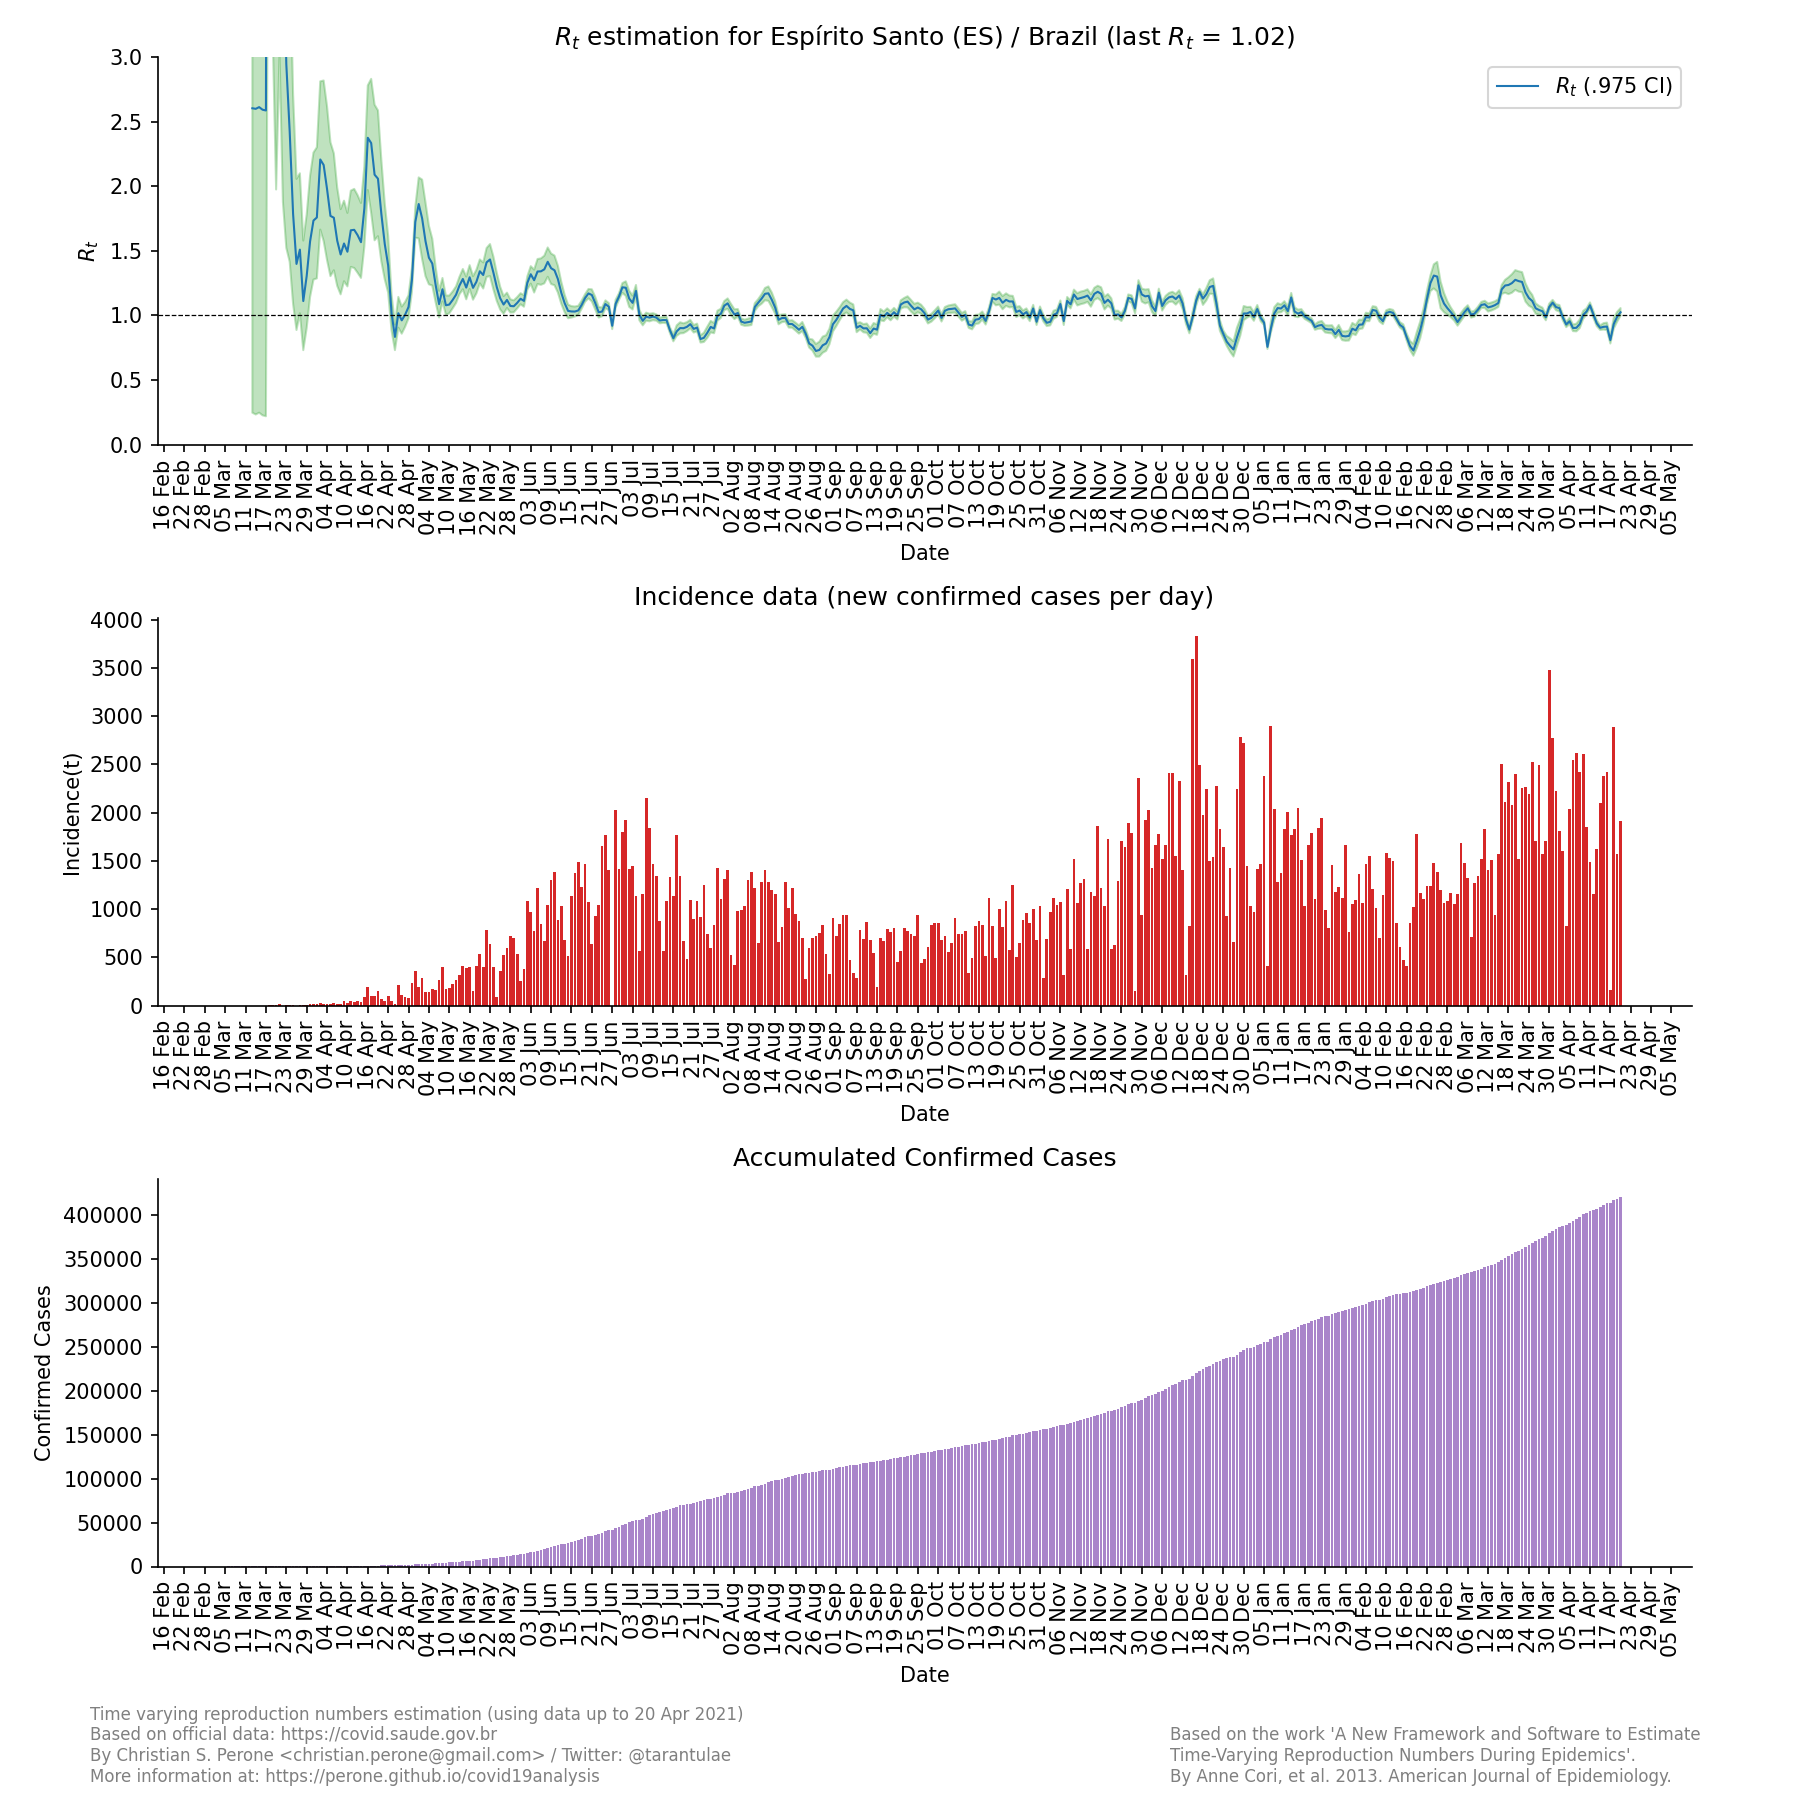
| ES | 1.02 (1.00 - 1.06) |
| AL | 1.02 (0.98 - 1.06) |
| TO | 1.01 (0.98 - 1.04) |
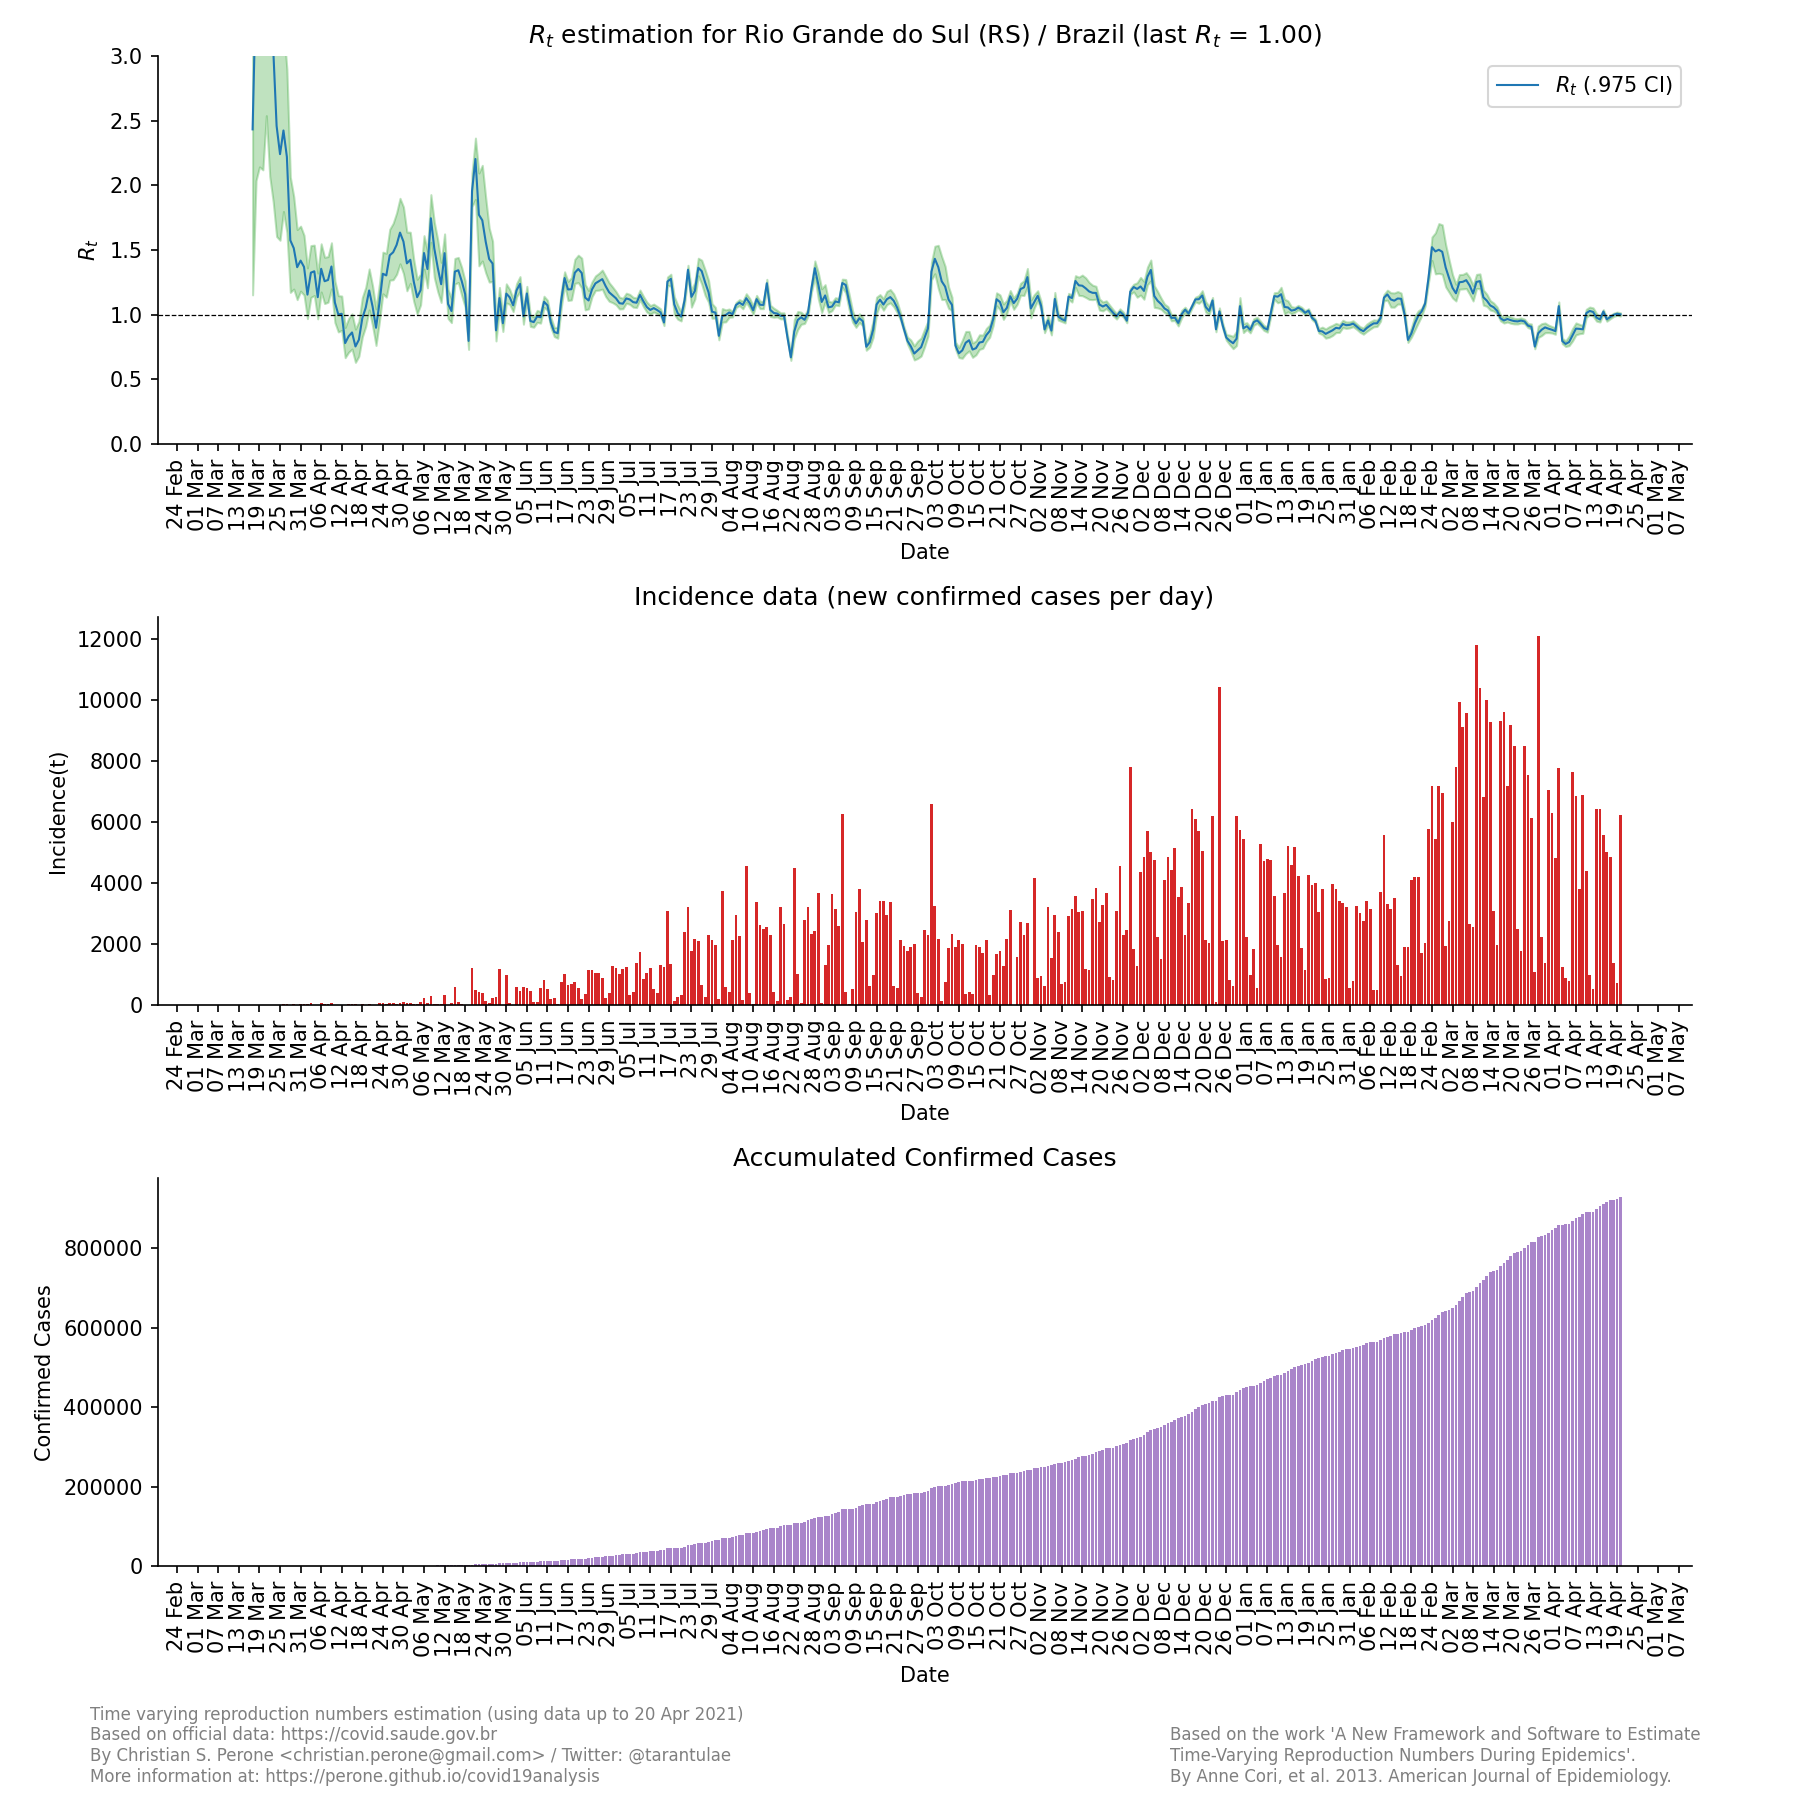
| RS | 1.00 (0.99 - 1.01) |
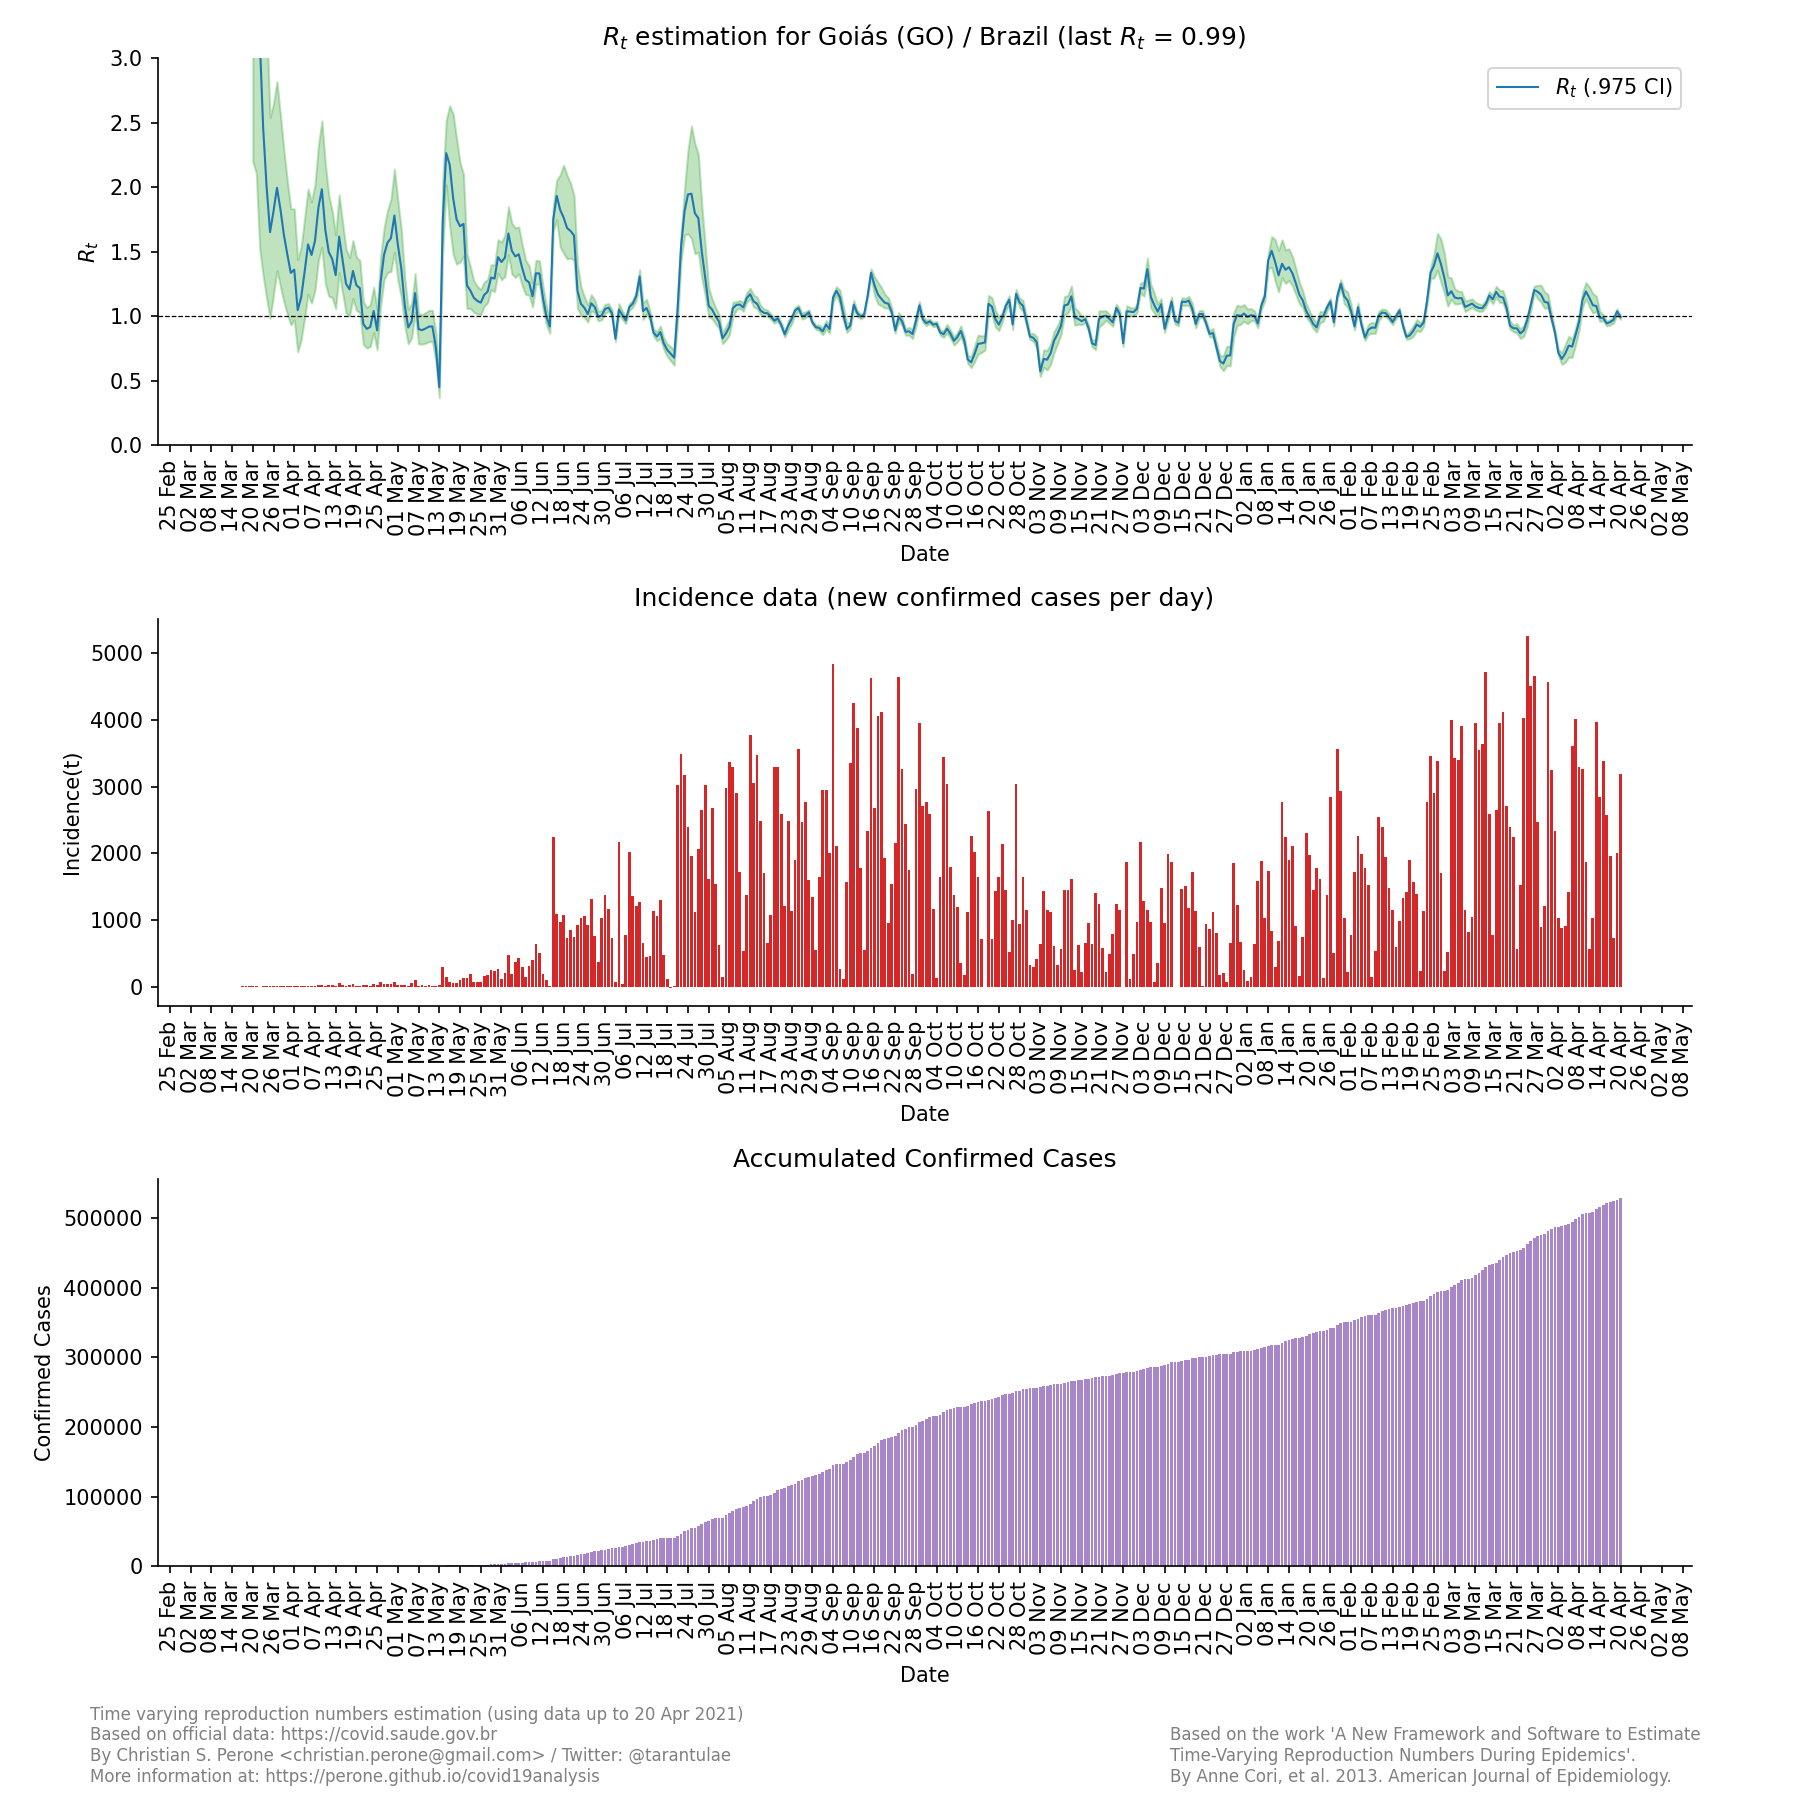
| GO | 0.99 (0.98 - 1.01) |
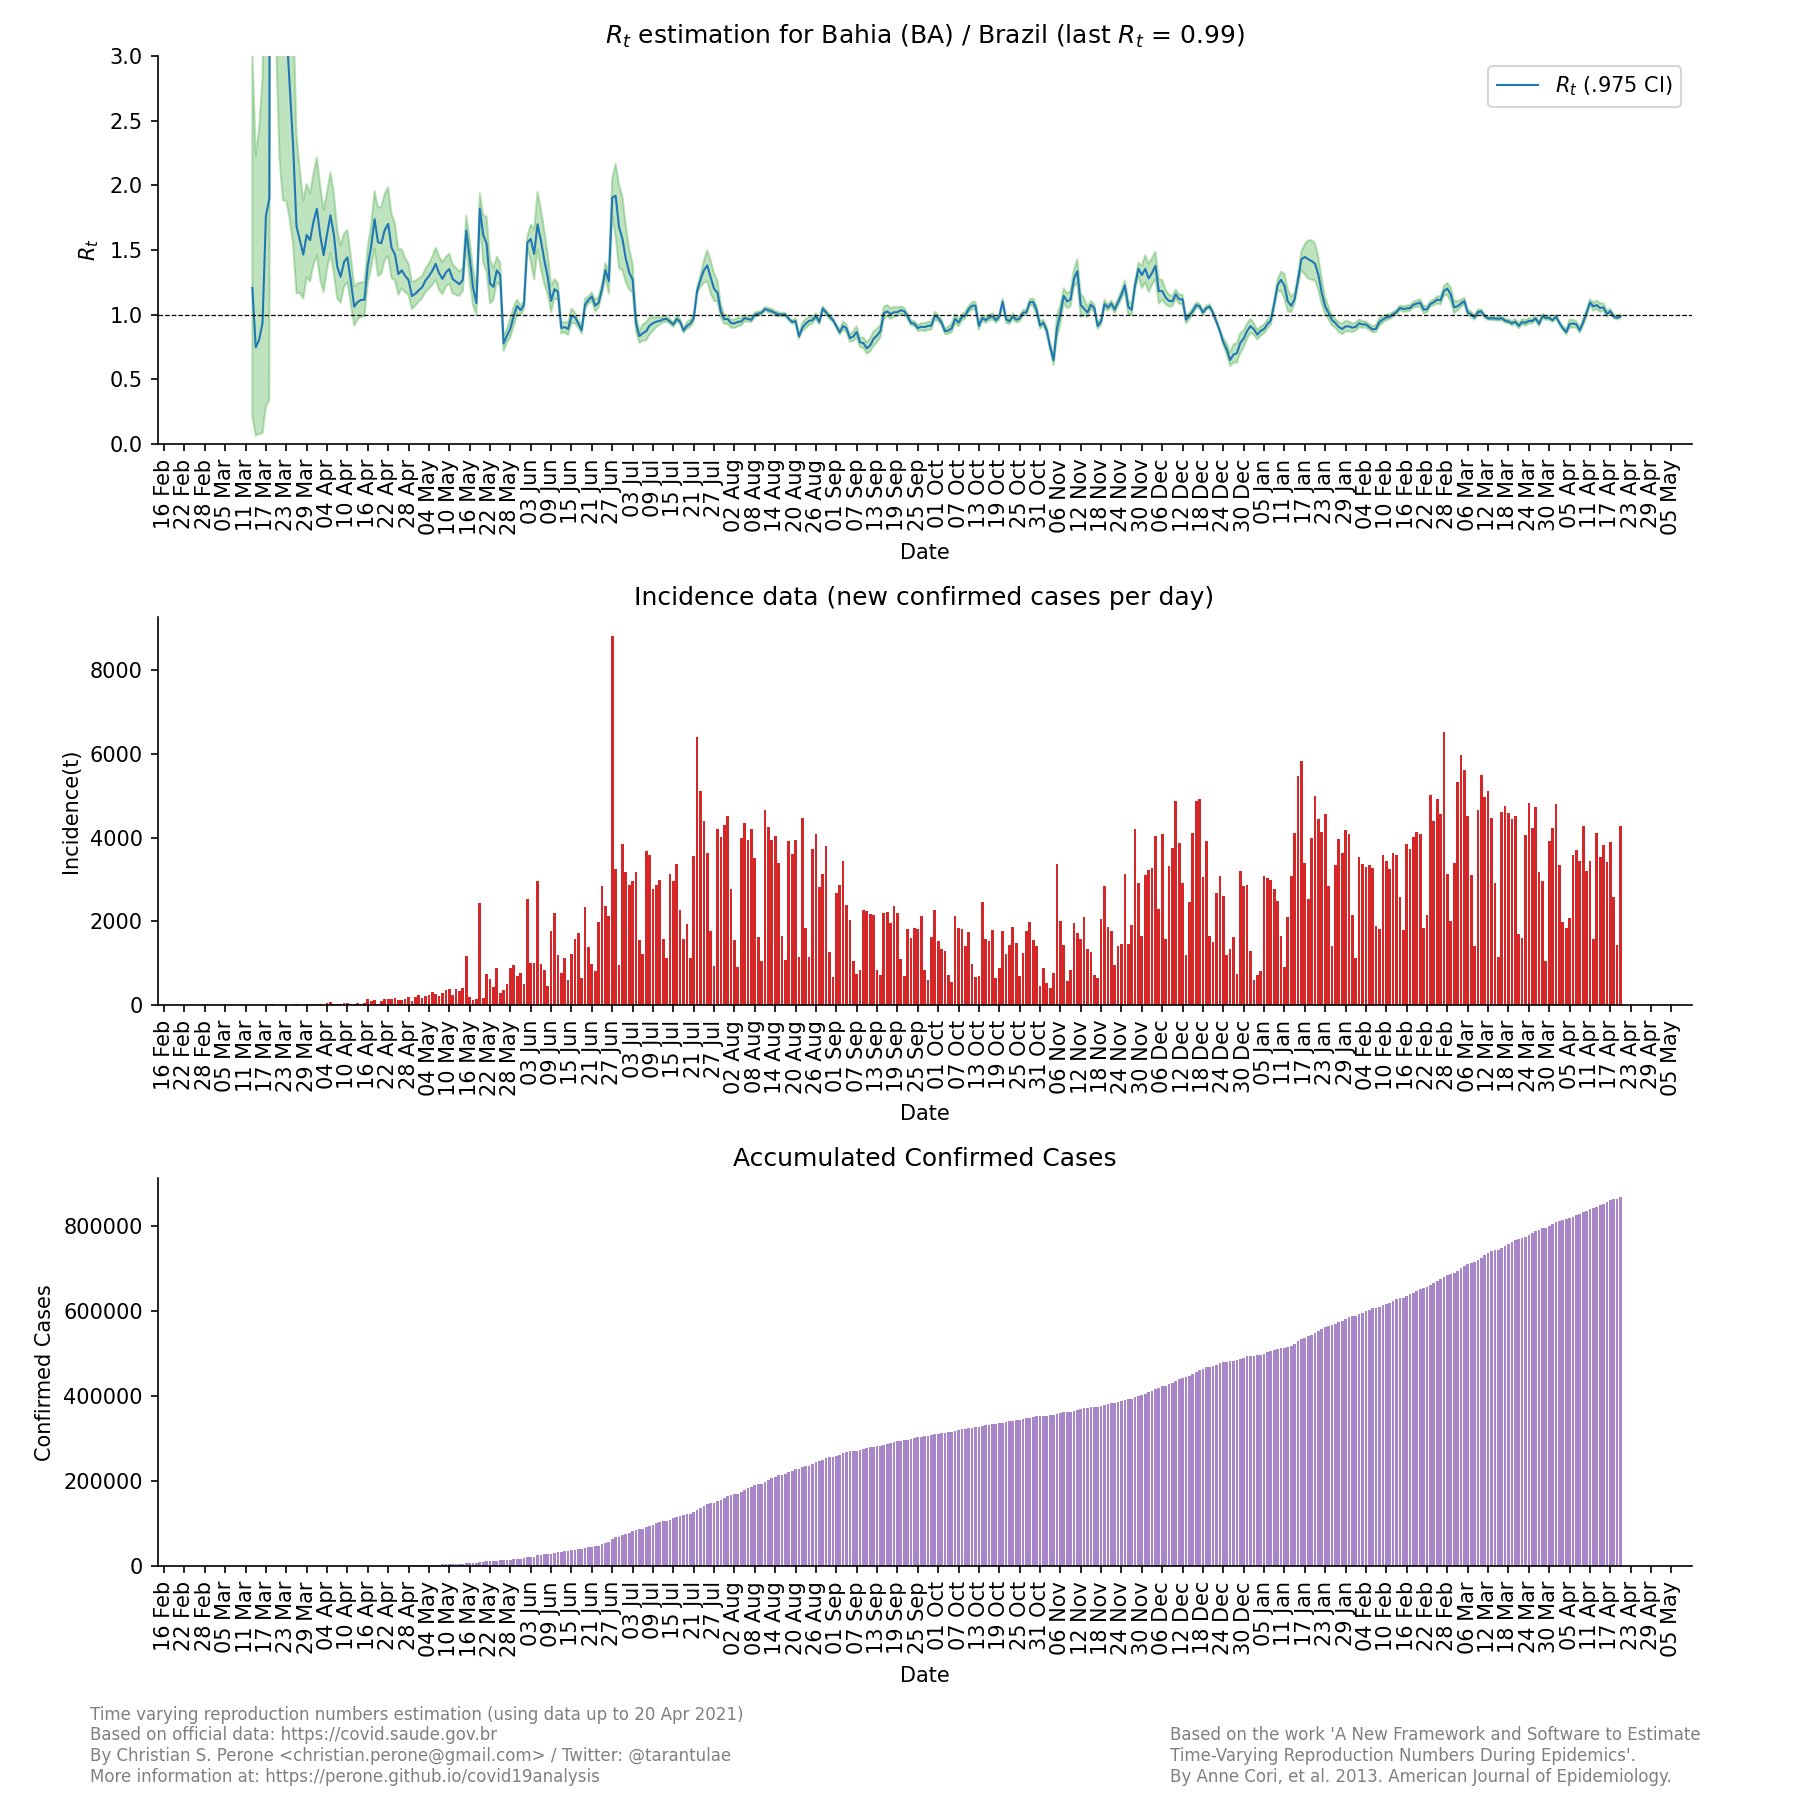
| BA | 0.99 (0.97 - 1.00) |
| SP | 0.96 (0.94 - 0.98) |
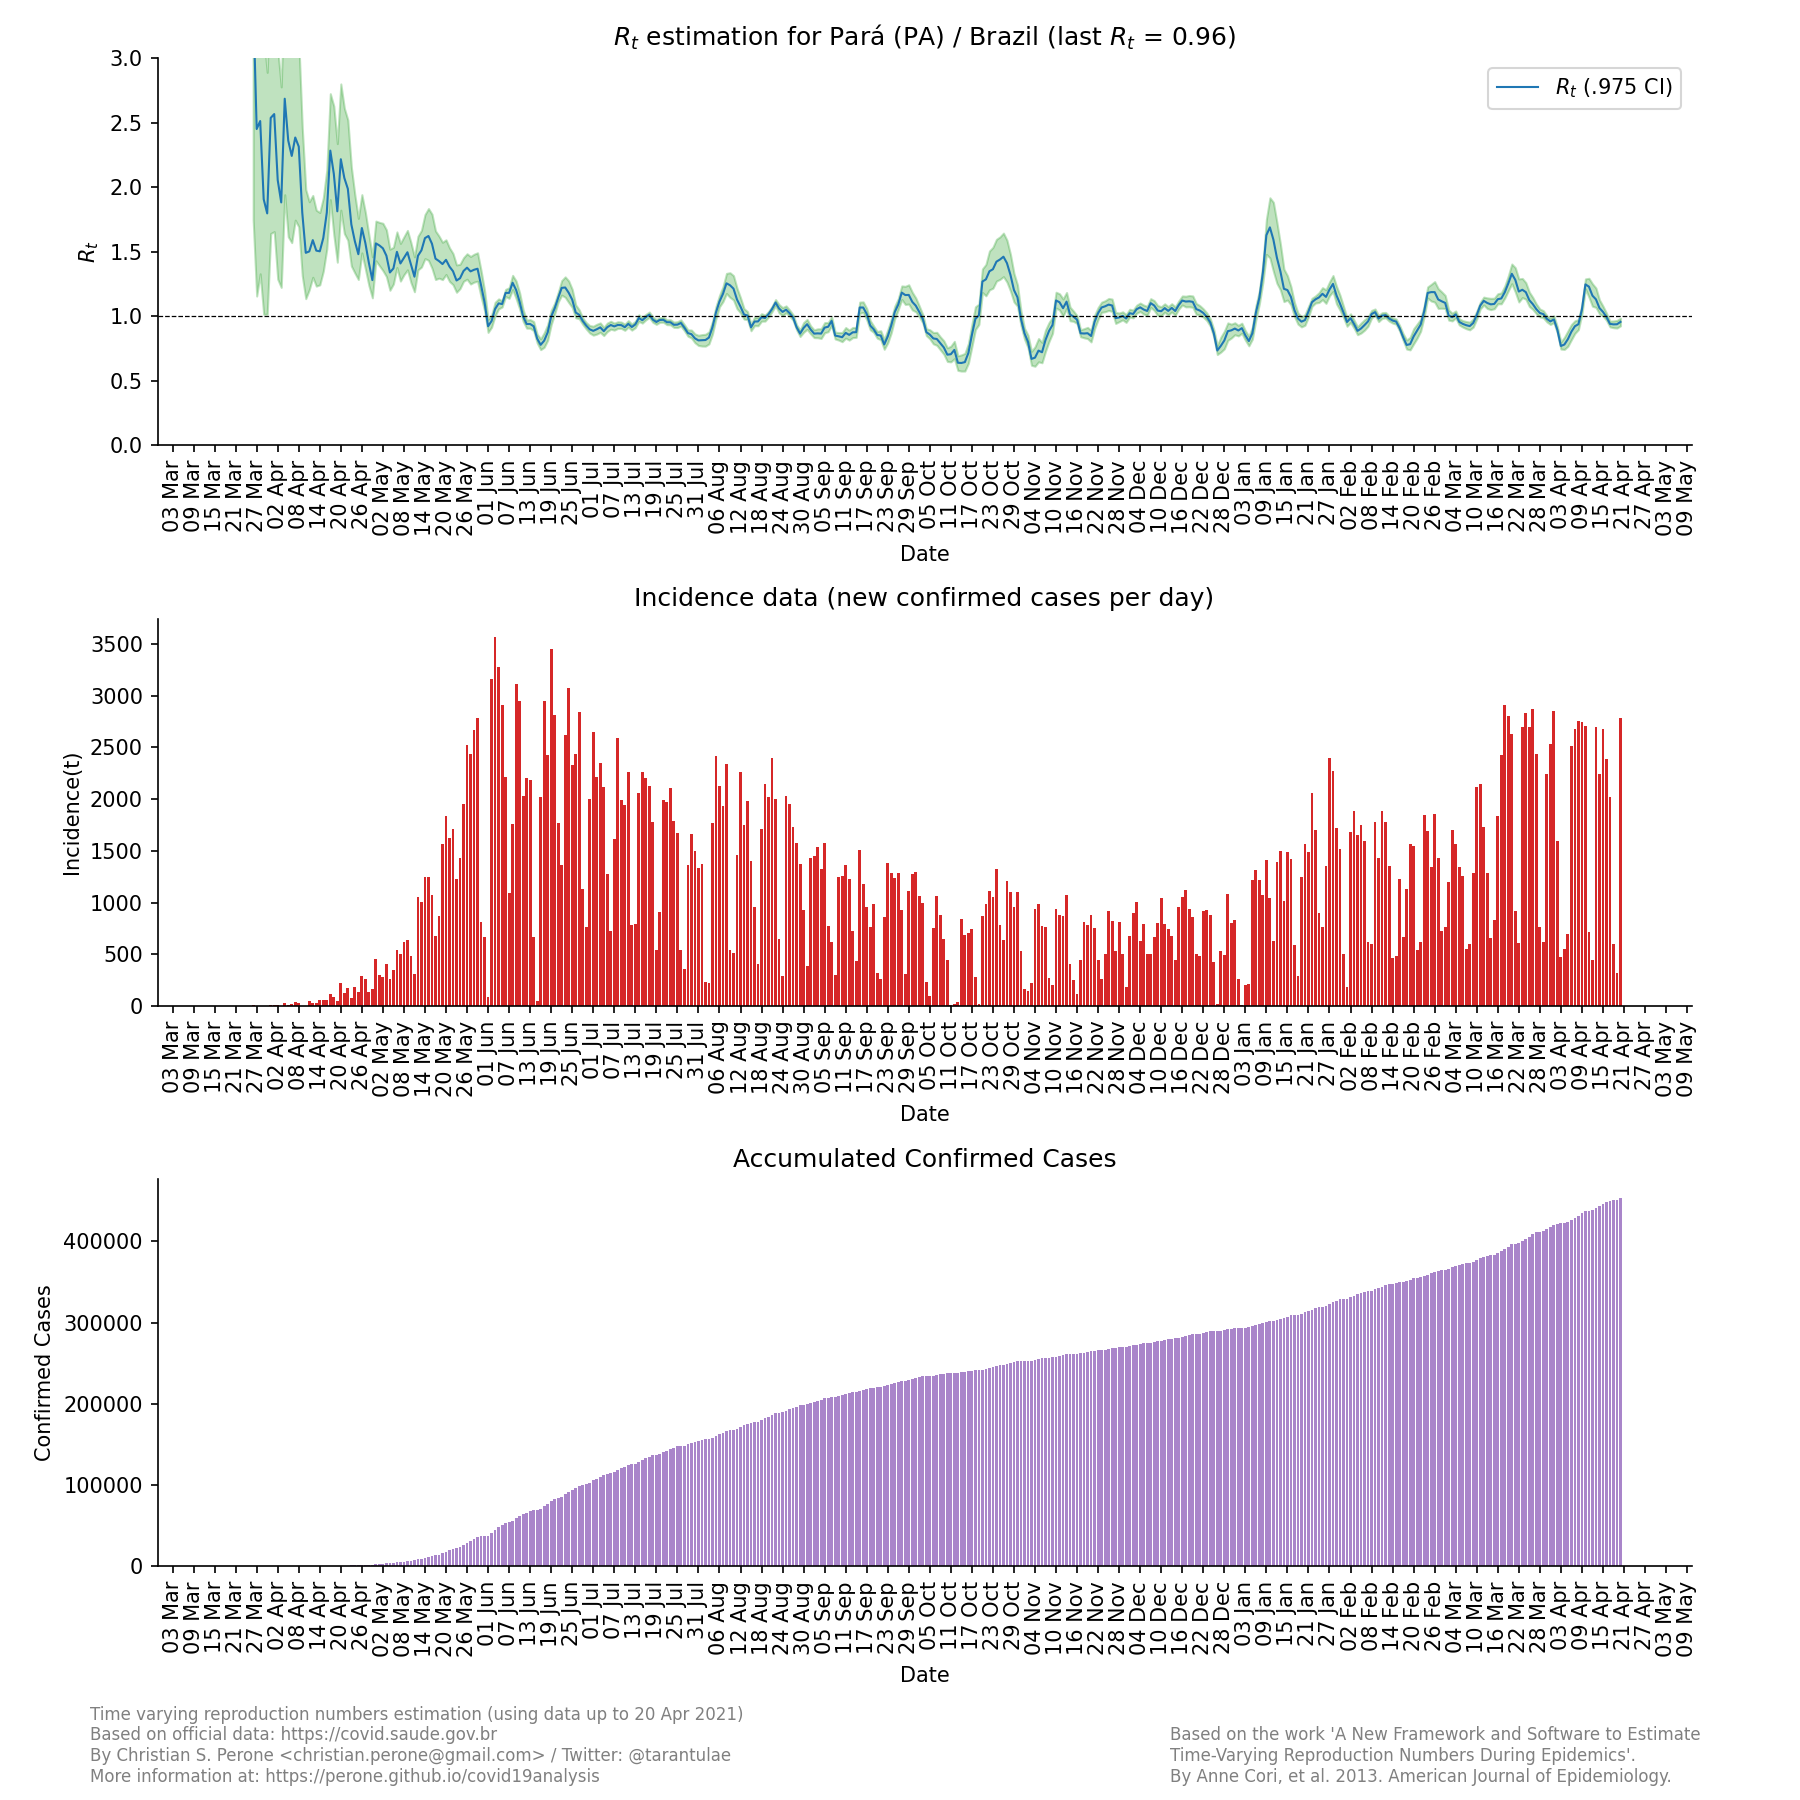
| PA | 0.96 (0.93 - 0.99) |
| PB | 0.95 (0.93 - 0.97) |
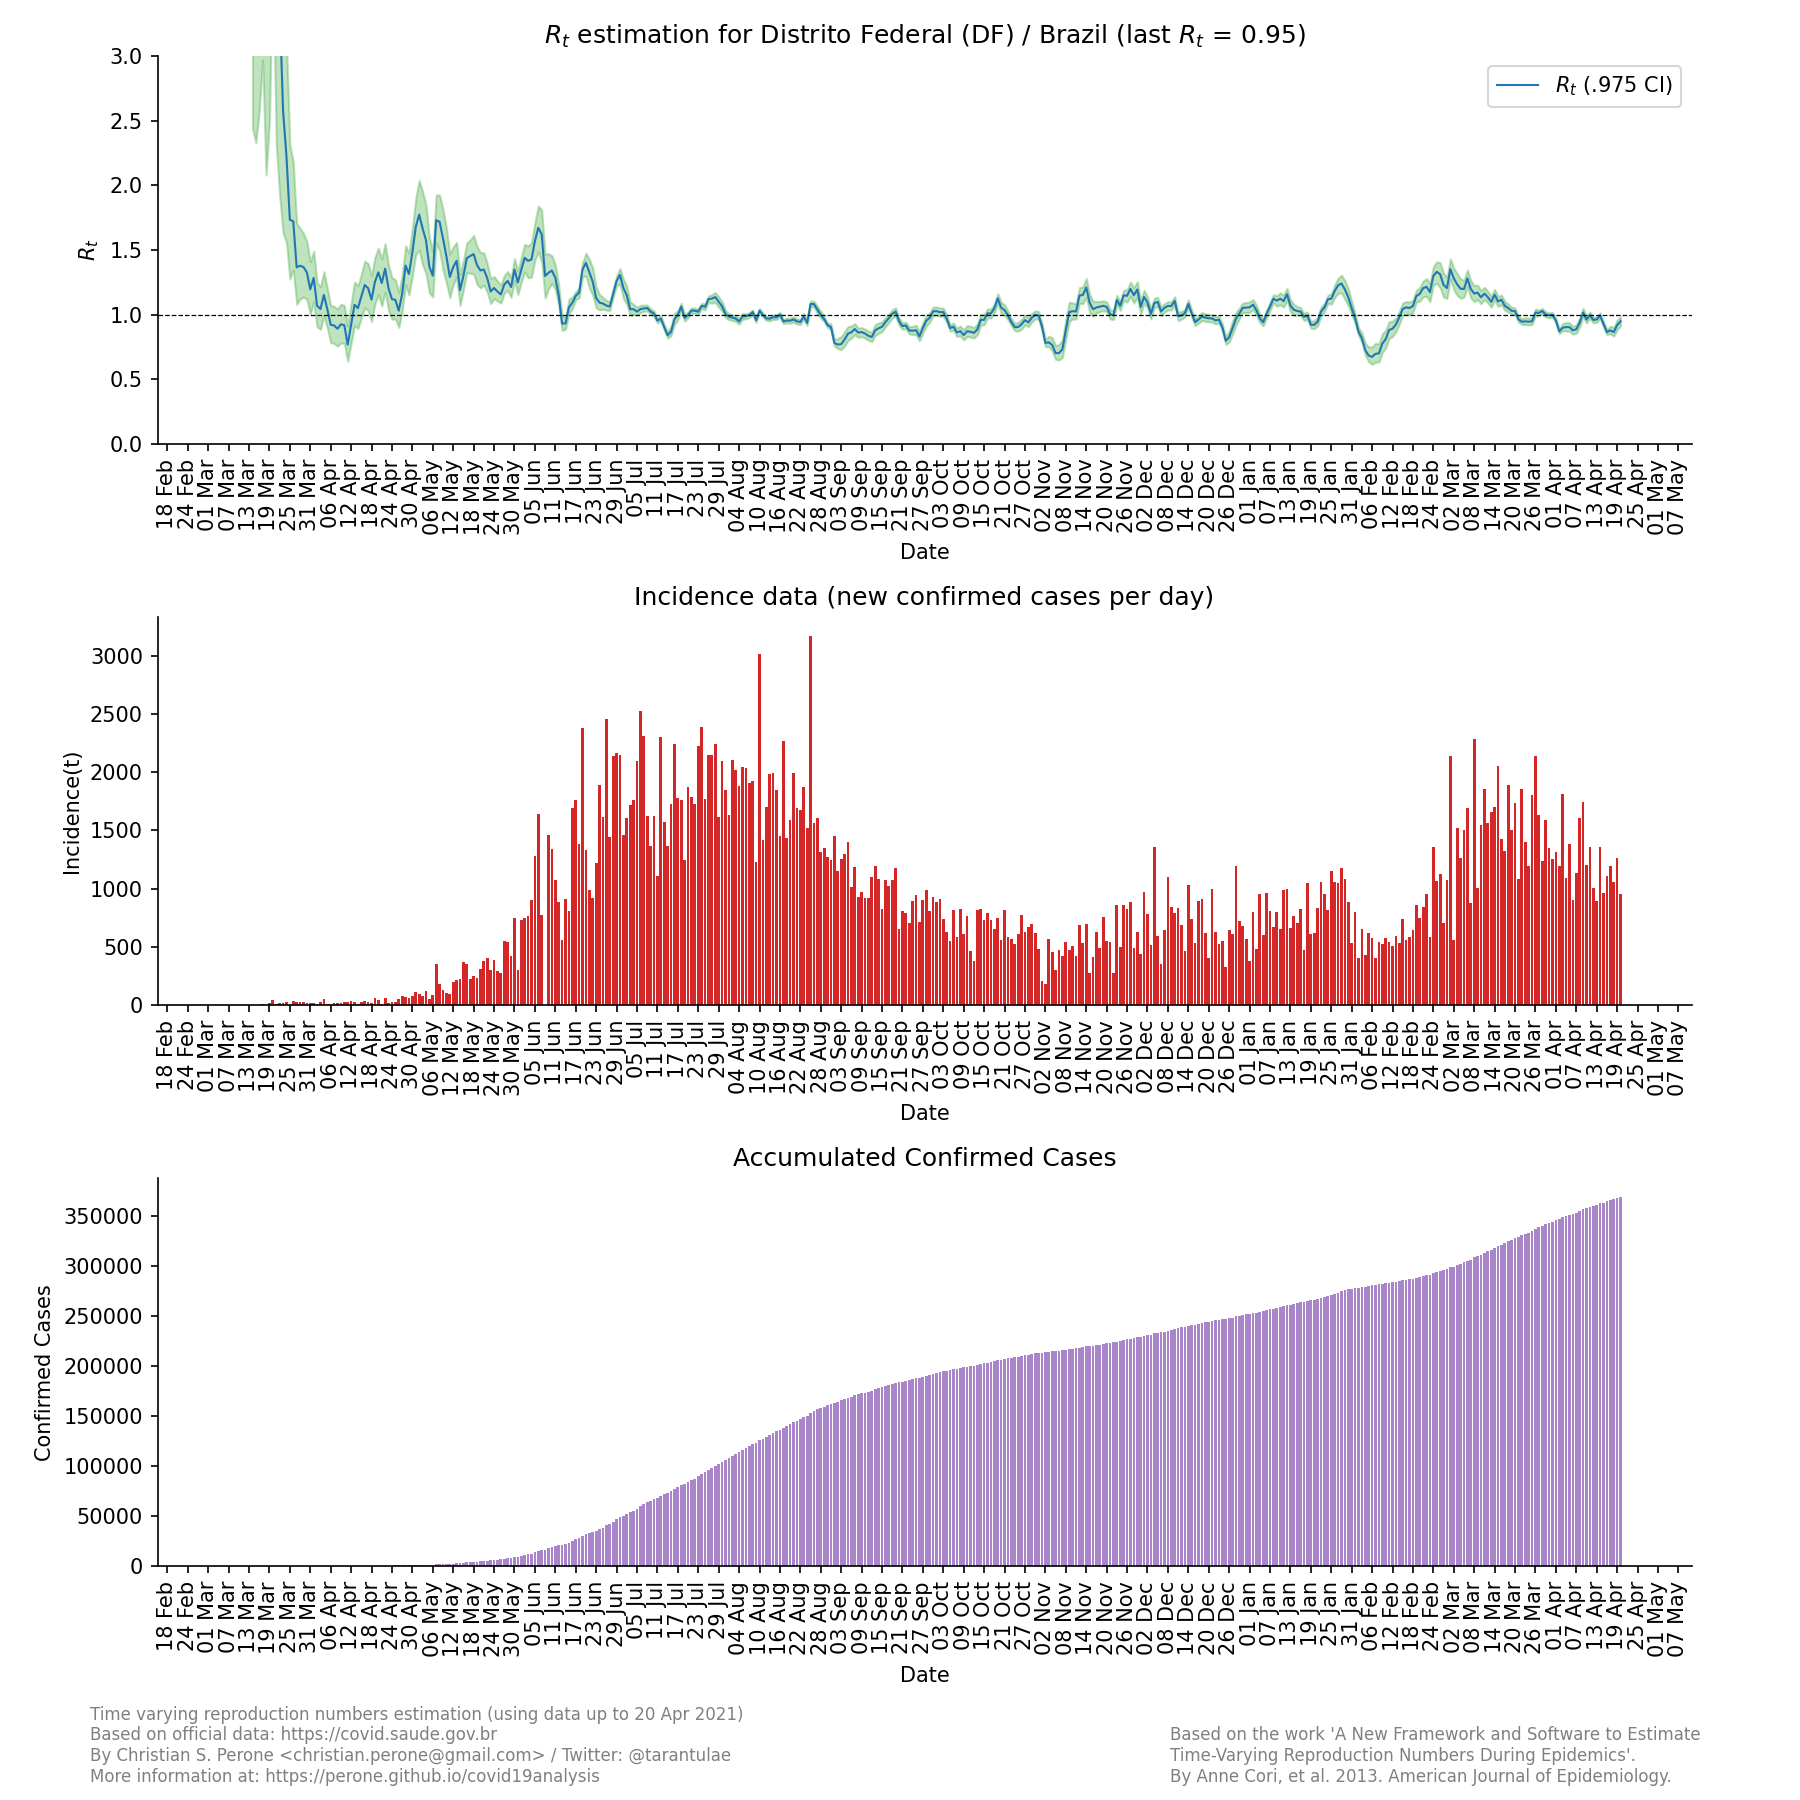
| DF | 0.95 (0.91 - 0.98) |
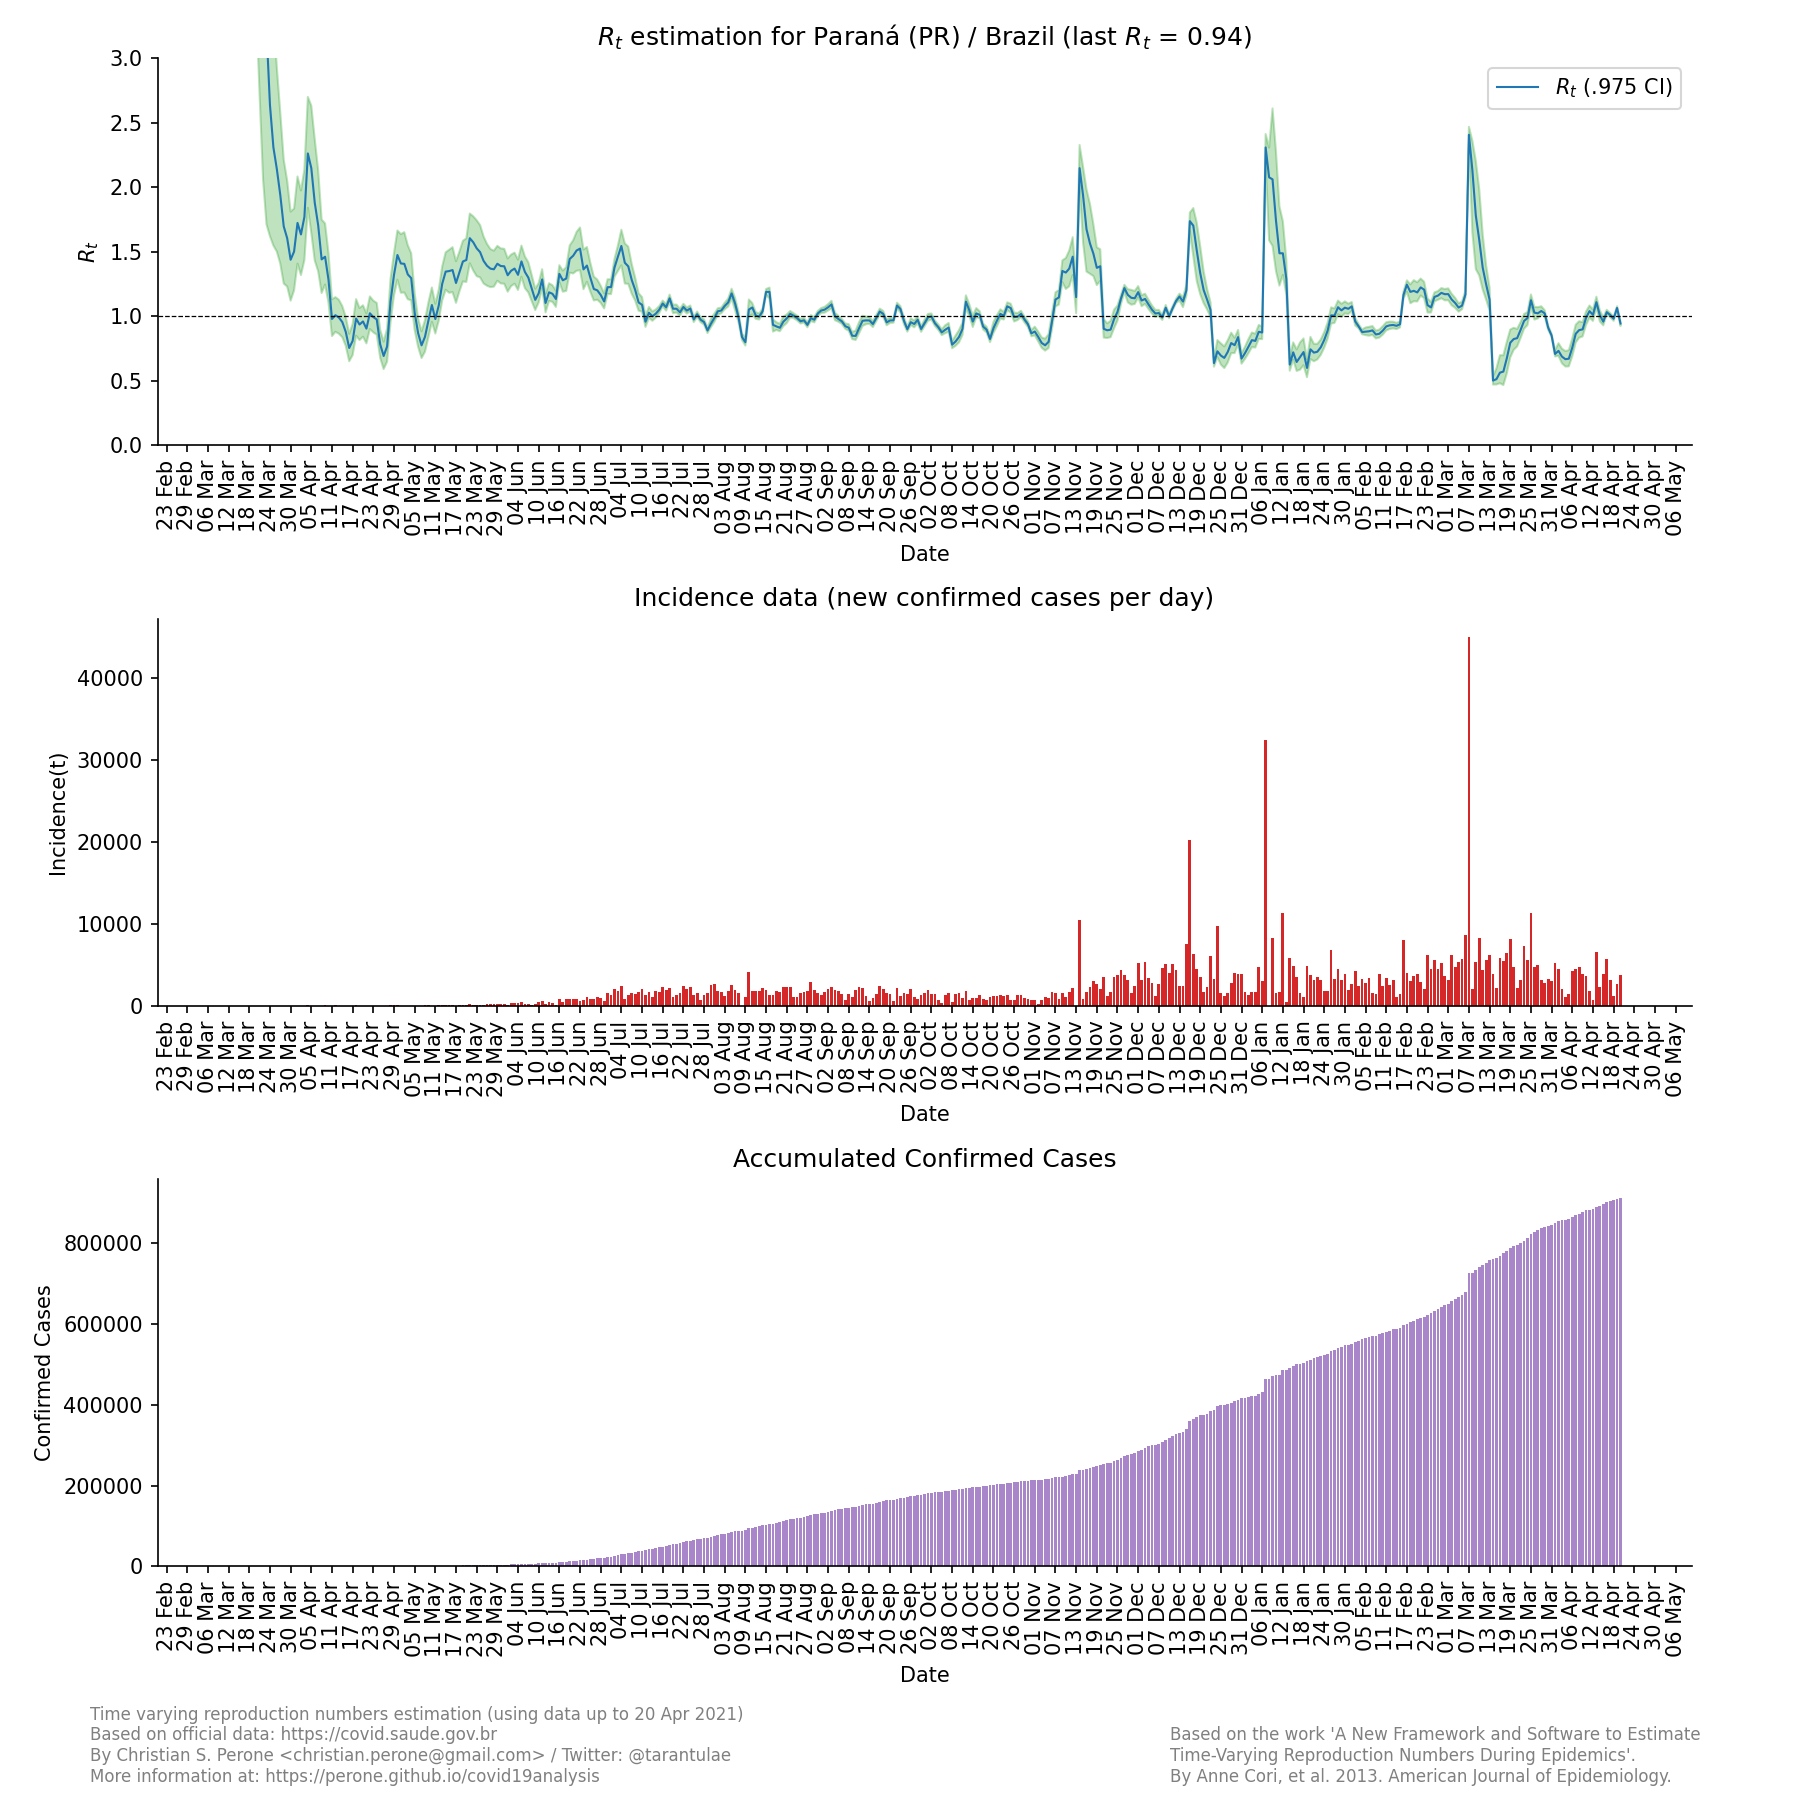
| PR | 0.94 (0.92 - 0.96) |
| SC | 0.93 (0.92 - 0.95) |
| MT | 0.93 (0.91 - 0.95) |
| MS | 0.92 (0.89 - 0.95) |
| RO | 0.90 (0.88 - 0.93) |
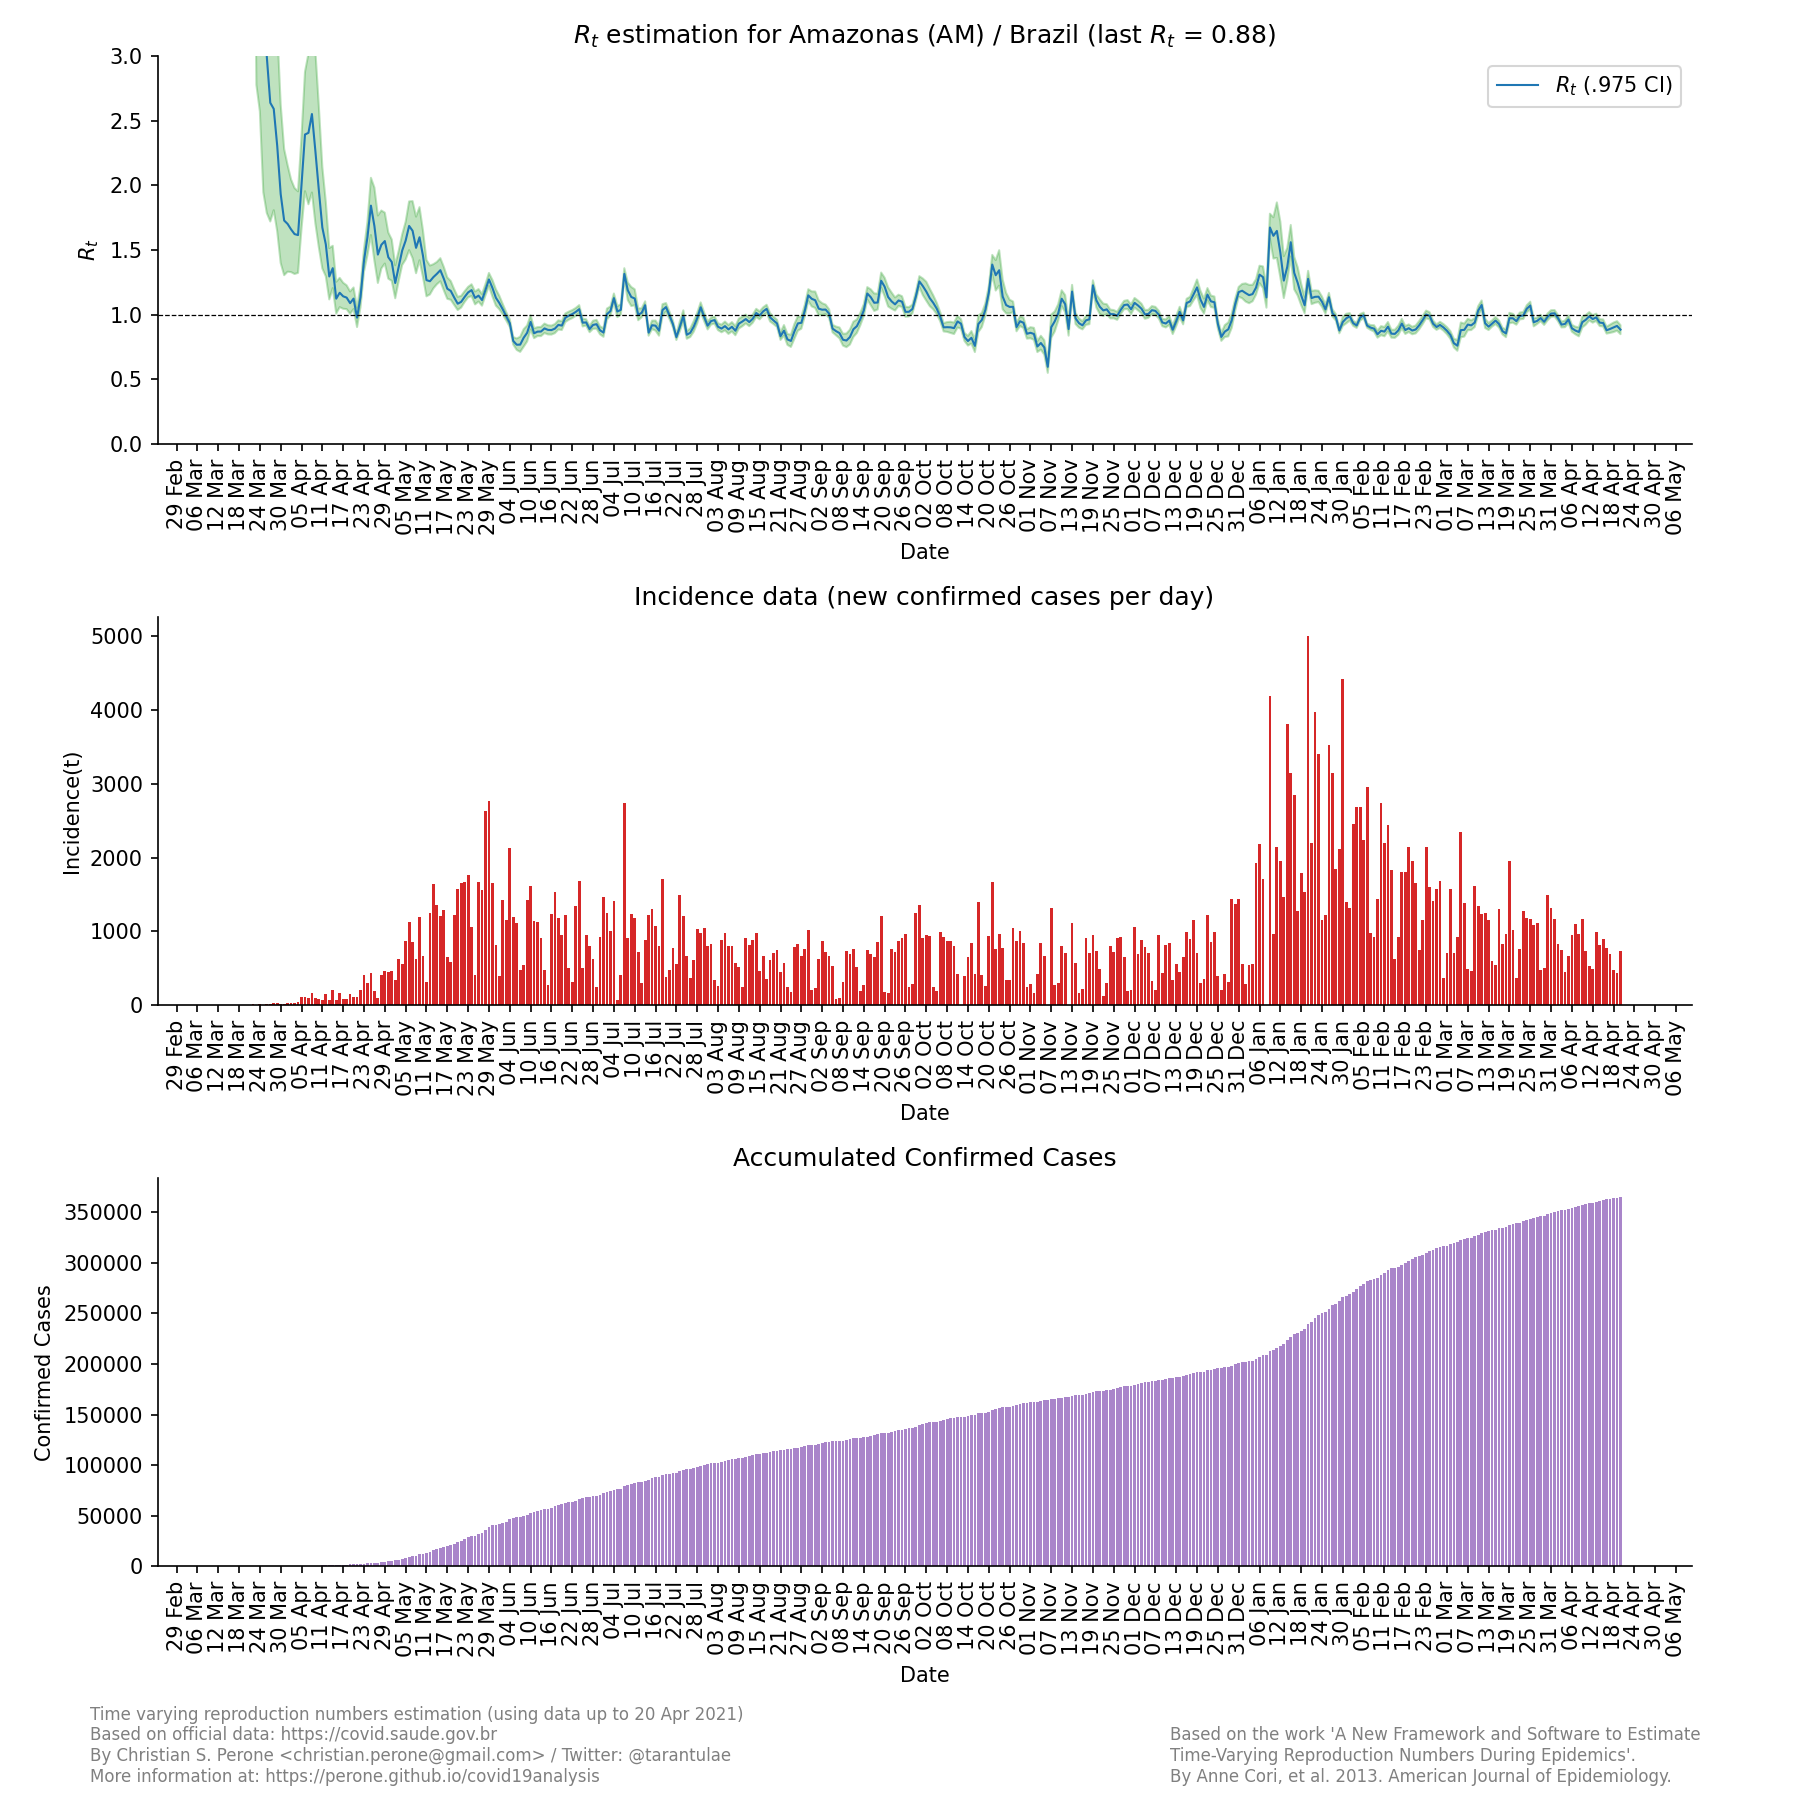
| AM | 0.88 (0.85 - 0.92) |
| MG | 0.85 (0.81 - 0.89) |
| AP | 0.84 (0.78 - 0.90) |
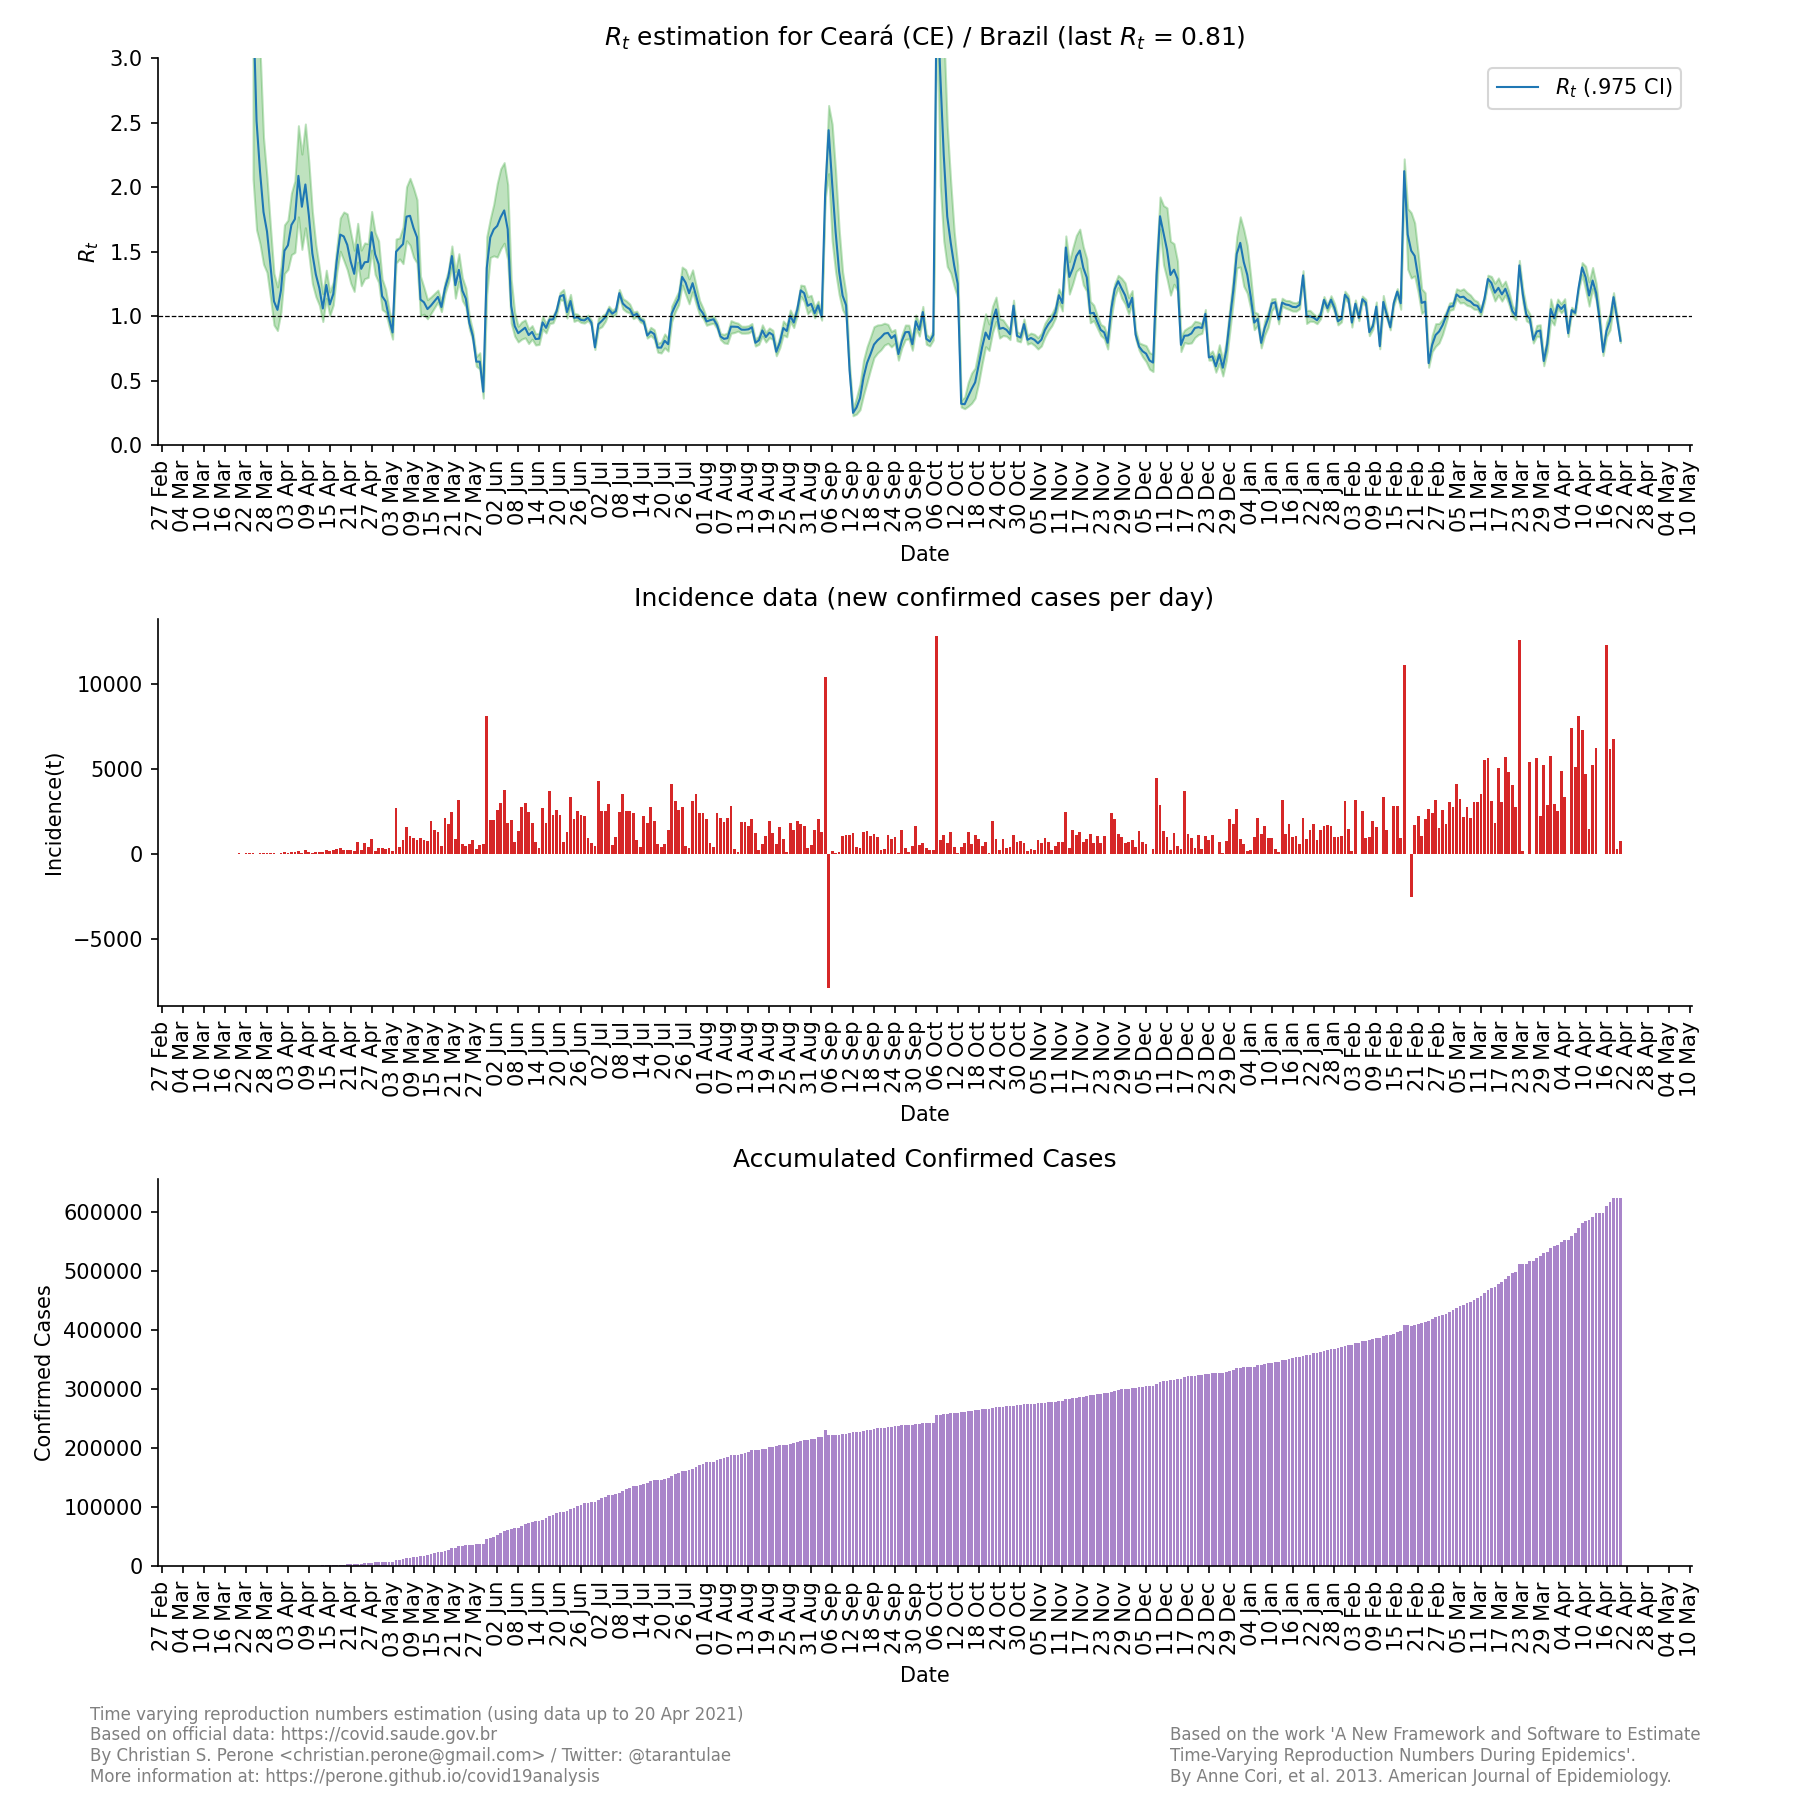
| CE | 0.81 (0.80 - 0.83) |
| RN | 0.80 (0.73 - 0.85) |
| AC | 0.74 (0.69 - 0.79) |
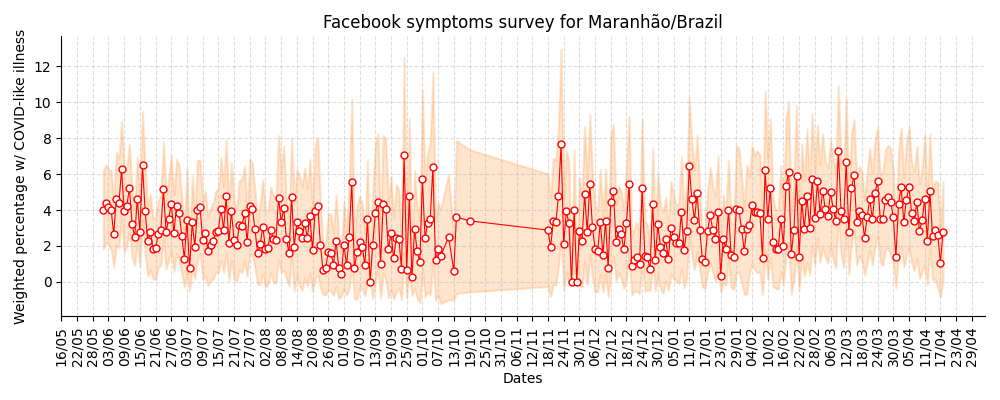
Summary for the Facebook COVID-like illness survey (last date)

Note
This is the summary for the Facebook COVID-like illness survey using the last survey date available for each state. Note that not all states have the same last date available, for more information please look at the plots for each state to see dynamics of these results and also the last available date.
Summary table for the Facebook COVID-like illness (CLI) survey (last date)
| State | Weighted Percent of CLI responses (95% CI) | Sample Size | Survey Date |
|---|---|---|---|
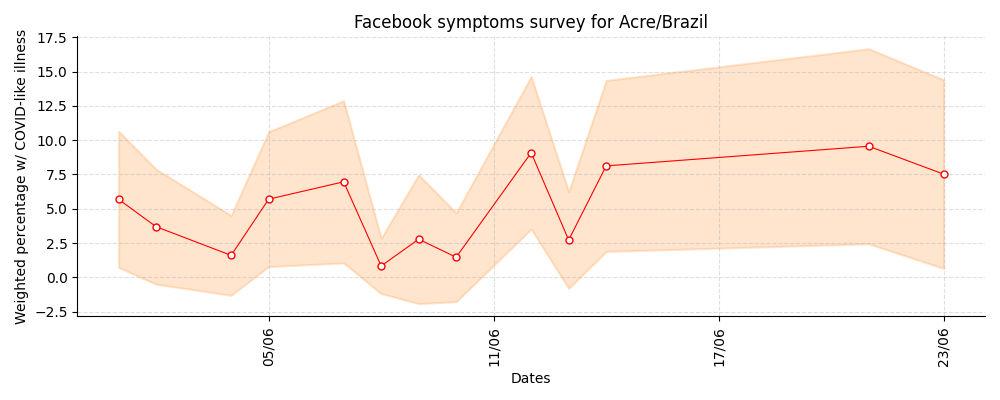
| Acre | 7.52 (0.65 - 14.39) | 107 | 23-06-2020 |
| Roraima | 7.18 (1.20 - 13.15) | 111 | 14-06-2020 |
| Amapá | 6.79 (1.12 - 12.47) | 101 | 15-01-2021 |
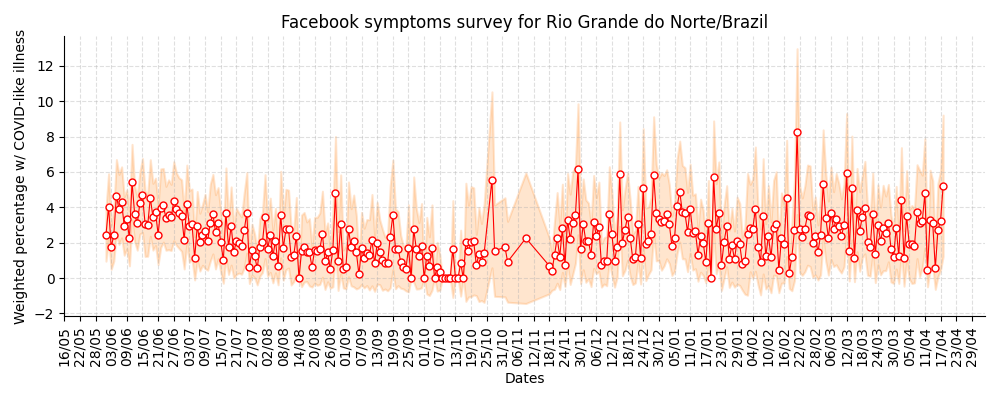
| Rio Grande do Norte | 5.22 (1.23 - 9.22) | 213 | 18-04-2021 |
| Distrito Federal | 5.17 (2.43 - 7.91) | 446 | 18-04-2021 |
| ParaÃba | 4.47 (0.91 - 8.02) | 198 | 18-04-2021 |
| Sergipe | 4.27 (-0.00 - 8.55) | 118 | 18-04-2021 |
| EspÃrito Santo | 4.24 (1.34 - 7.13) | 319 | 18-04-2021 |
| Rondônia | 4.04 (-0.06 - 8.14) | 120 | 18-04-2021 |
| Tocantins | 3.39 (-0.42 - 7.20) | 110 | 30-03-2021 |
| Pará | 3.24 (1.01 - 5.46) | 332 | 18-04-2021 |
| Ceará | 3.22 (1.26 - 5.18) | 431 | 18-04-2021 |
| Mato Grosso do Sul | 2.84 (0.41 - 5.28) | 262 | 18-04-2021 |
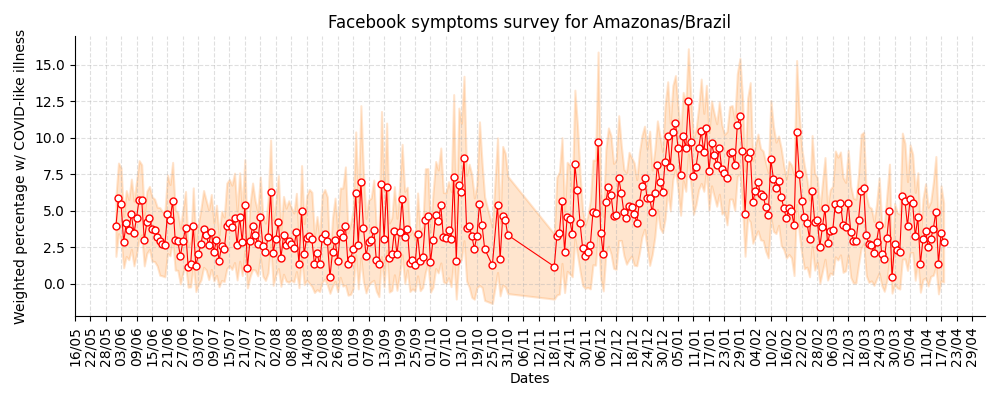
| Amazonas | 2.83 (0.12 - 5.54) | 208 | 18-04-2021 |
| Maranhão | 2.78 (-0.01 - 5.58) | 188 | 18-04-2021 |
| Pernambuco | 2.32 (0.47 - 4.18) | 368 | 18-04-2021 |
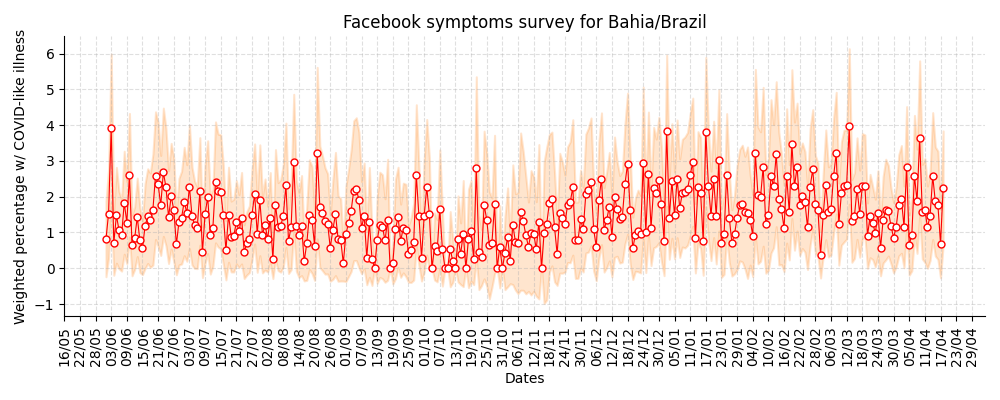
| Bahia | 2.24 (0.65 - 3.84) | 449 | 18-04-2021 |
| Minas Gerais | 2.20 (1.18 - 3.23) | 1246 | 18-04-2021 |
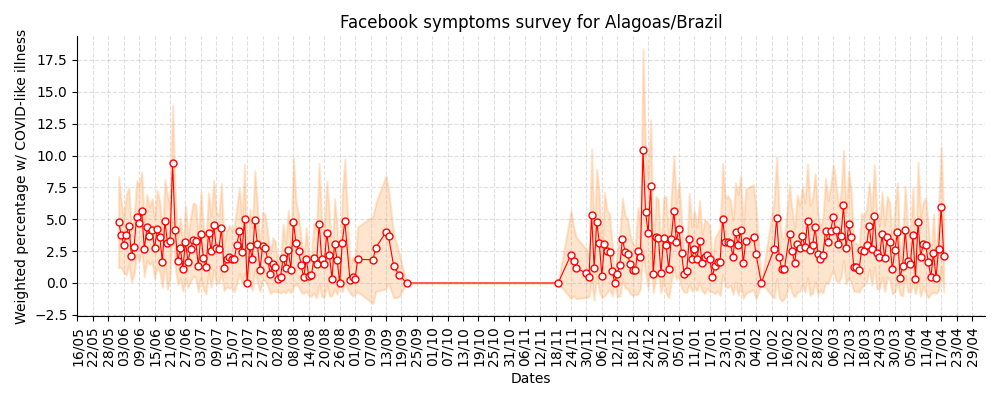
| Alagoas | 2.15 (-0.69 - 4.99) | 130 | 18-04-2021 |
| Rio de Janeiro | 1.75 (0.85 - 2.65) | 1333 | 18-04-2021 |
| Paraná | 1.60 (0.66 - 2.54) | 992 | 18-04-2021 |
| São Paulo | 1.56 (1.10 - 2.02) | 4244 | 18-04-2021 |
| Santa Catarina | 1.51 (0.18 - 2.84) | 521 | 18-04-2021 |
| Goiás | 1.48 (0.18 - 2.78) | 456 | 18-04-2021 |
| Piauà | 1.36 (-1.18 - 3.90) | 129 | 18-04-2021 |
| Rio Grande do Sul | 1.20 (0.38 - 2.03) | 997 | 18-04-2021 |
| Mato Grosso | 0.62 (-0.51 - 1.74) | 287 | 18-04-2021 |
State: Acre / AC
R(t) estimate, incidence and accumulated cases
![]()
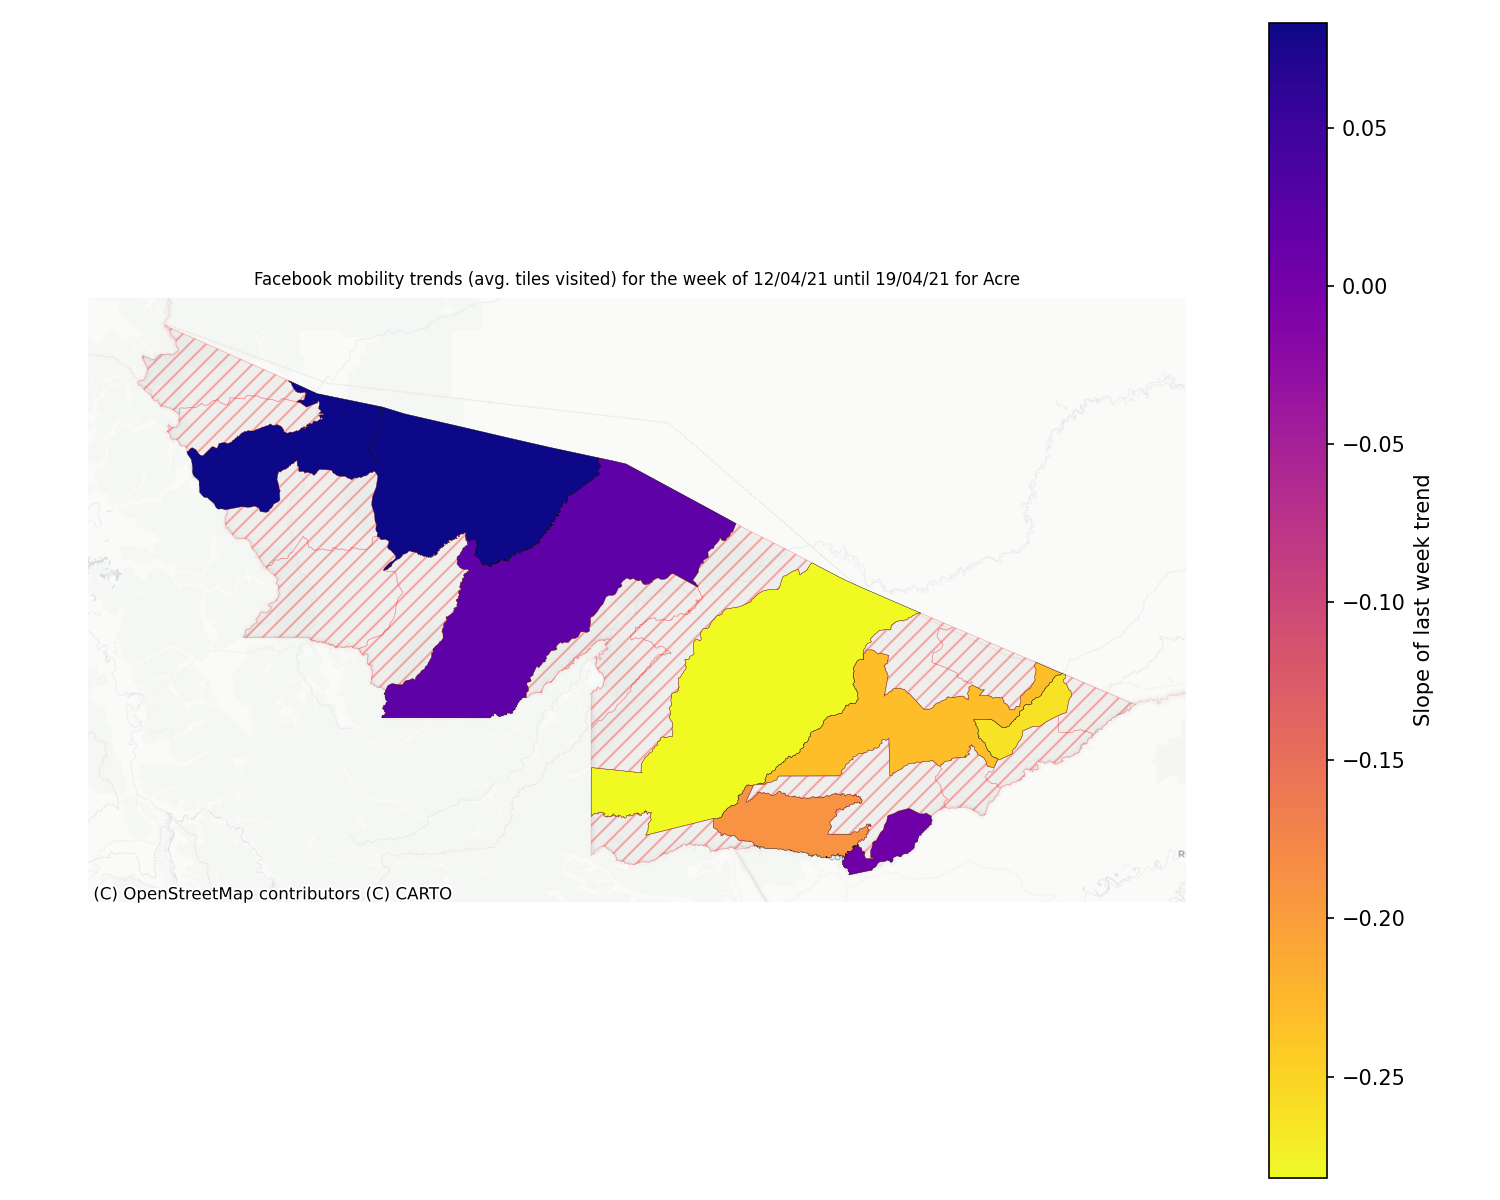
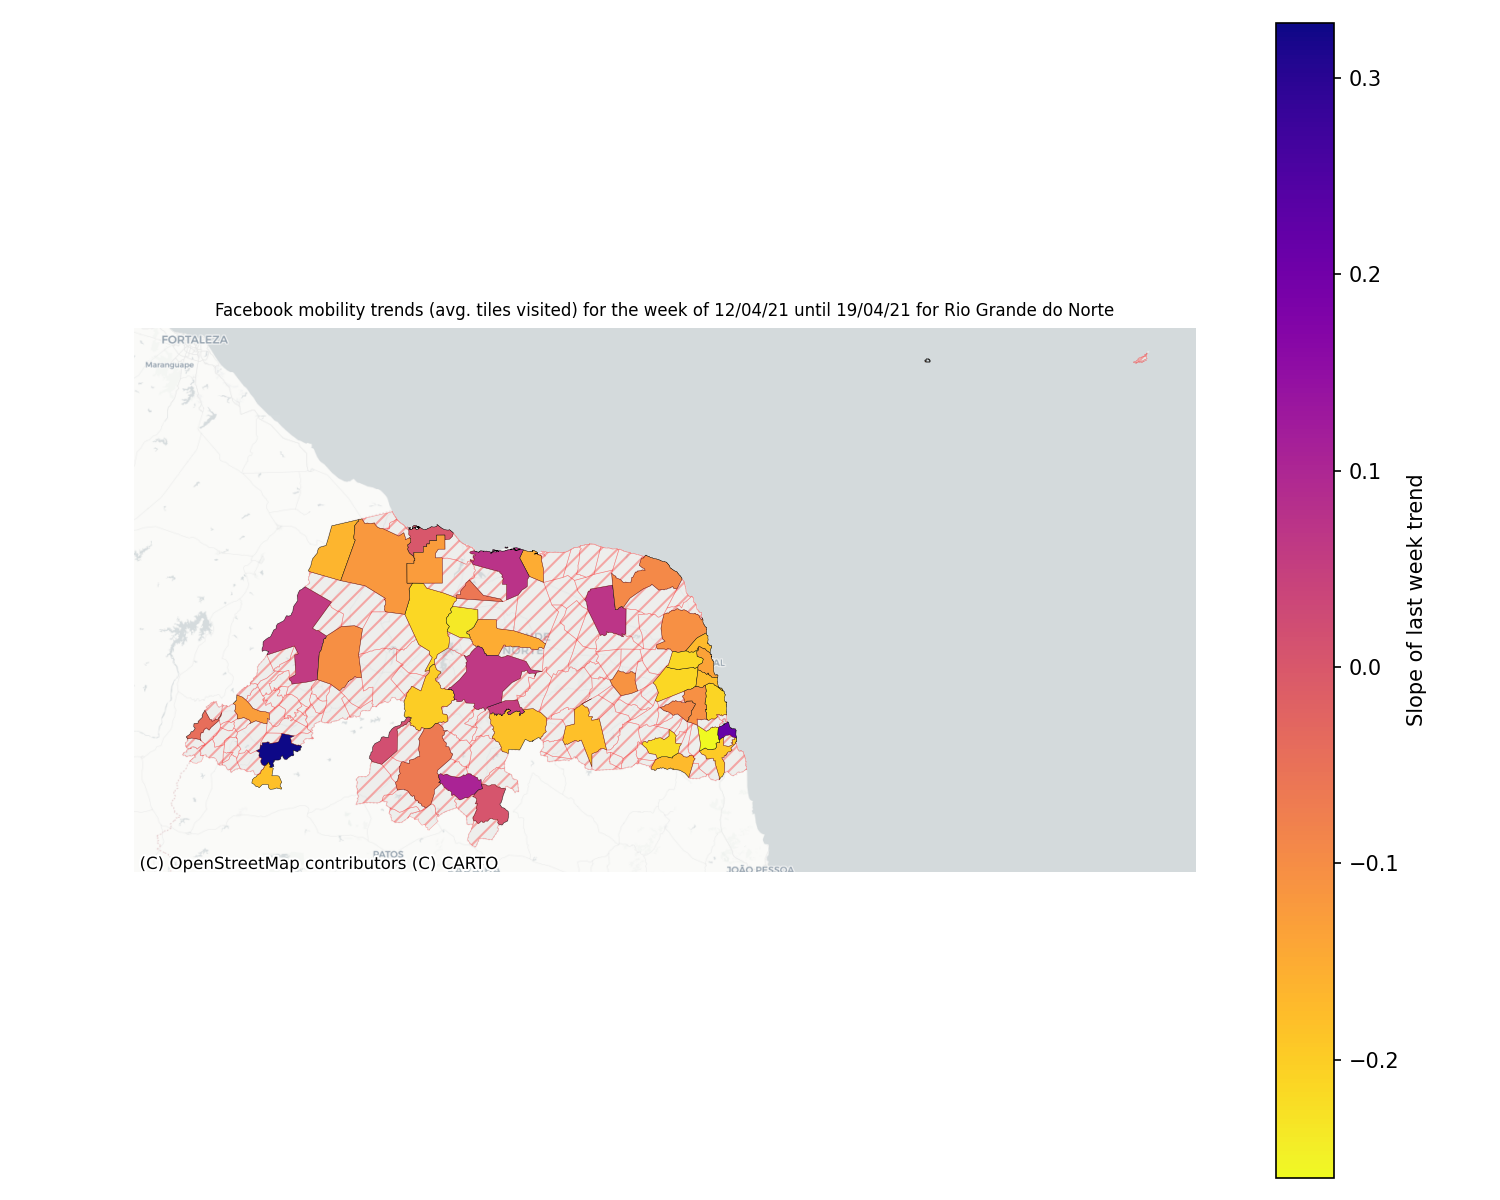
Facebook mobility trend data for the state
Note
This plot uses official data from Facebook mobility data. This data is released with a Creative Commons Attribution International license.
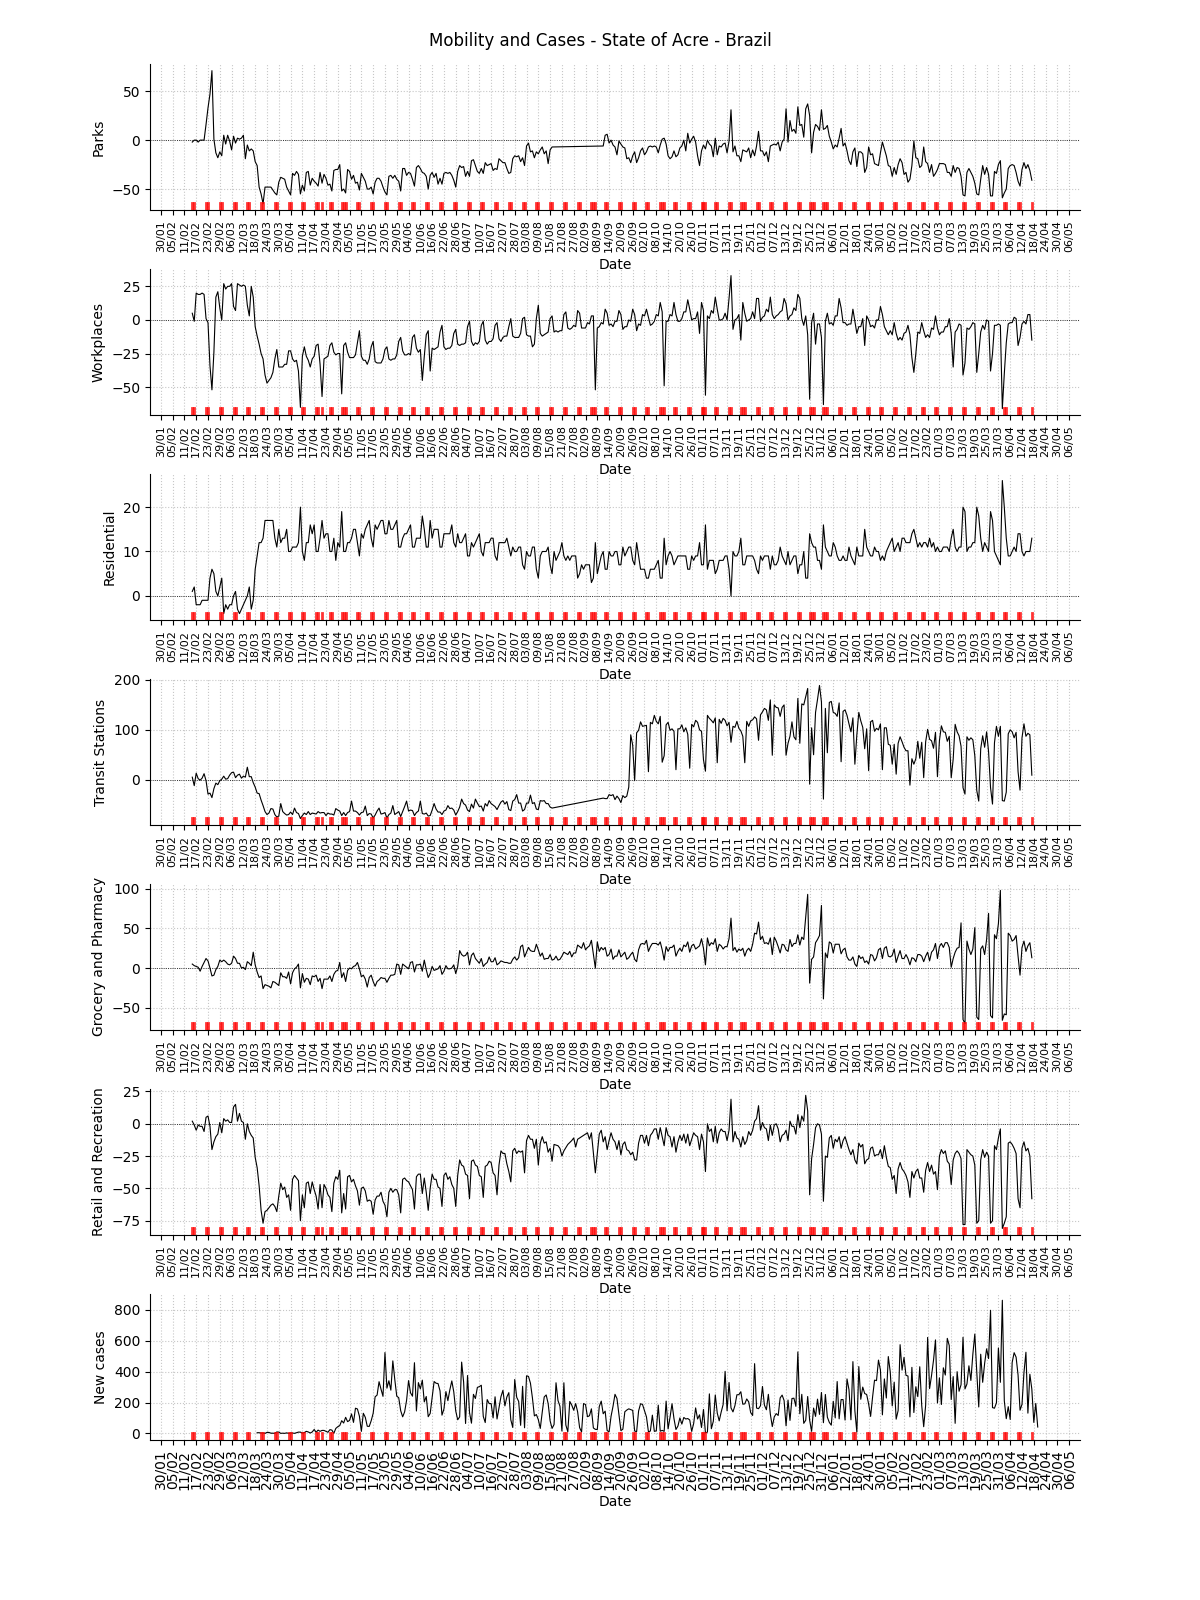
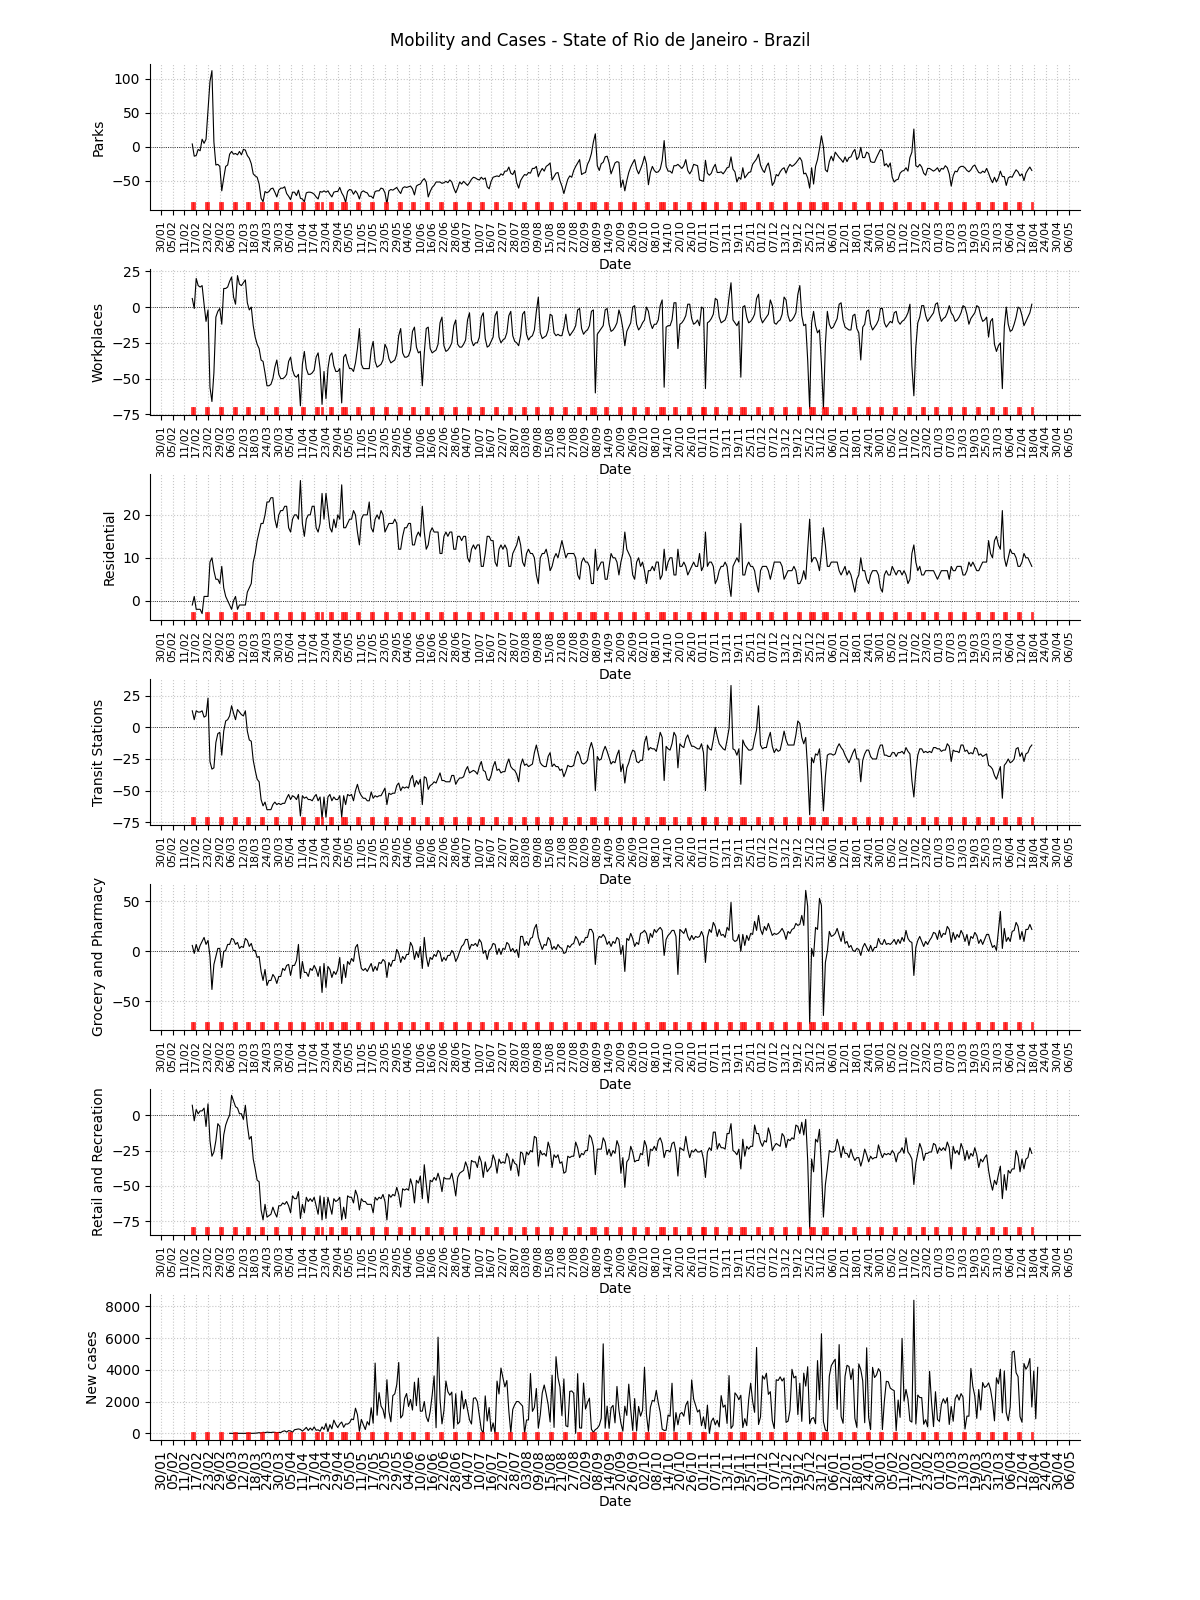
Mobility data for the state
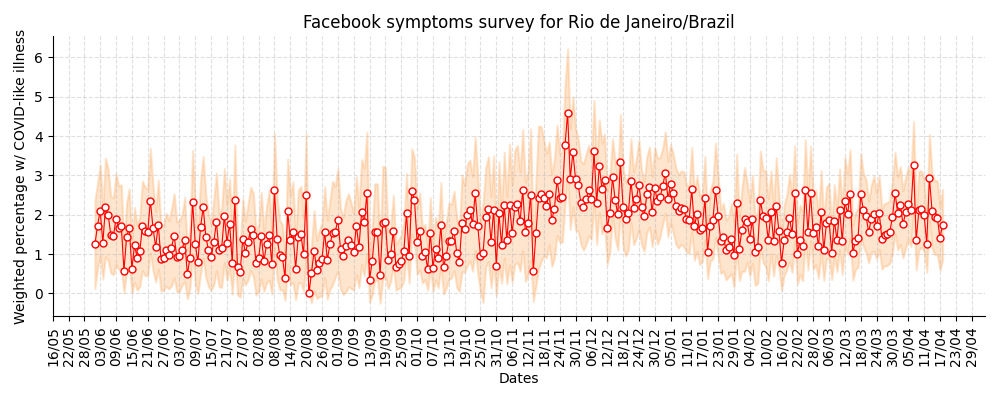
Facebook symptom survey for the state
Note
This plot uses official data from Brazilian government as well as mobility data from Google Community Mobility Reports. The red markers on the x-axis are weekends or holidays. This plot also uses data from the Facebook Symptom survey data kindly hosted by University of Maryland.
State: Alagoas / AL
R(t) estimate, incidence and accumulated cases
![]()
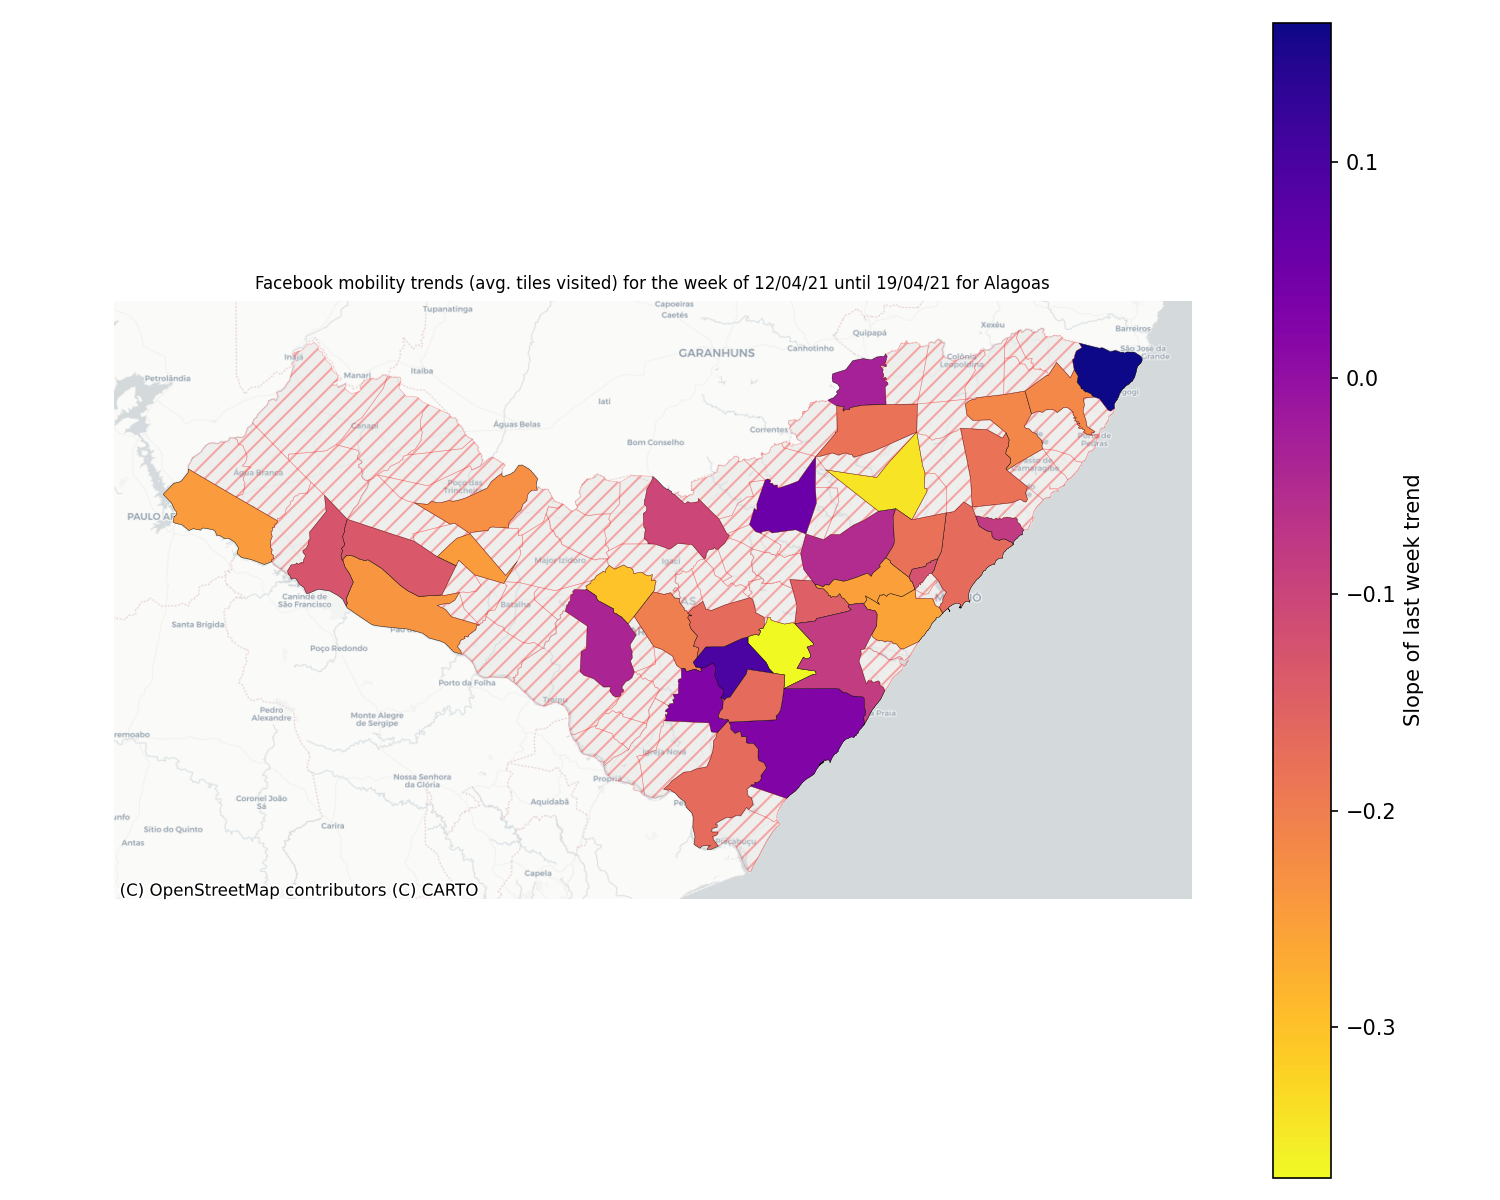
Facebook mobility trend data for the state
Note
This plot uses official data from Facebook mobility data. This data is released with a Creative Commons Attribution International license.
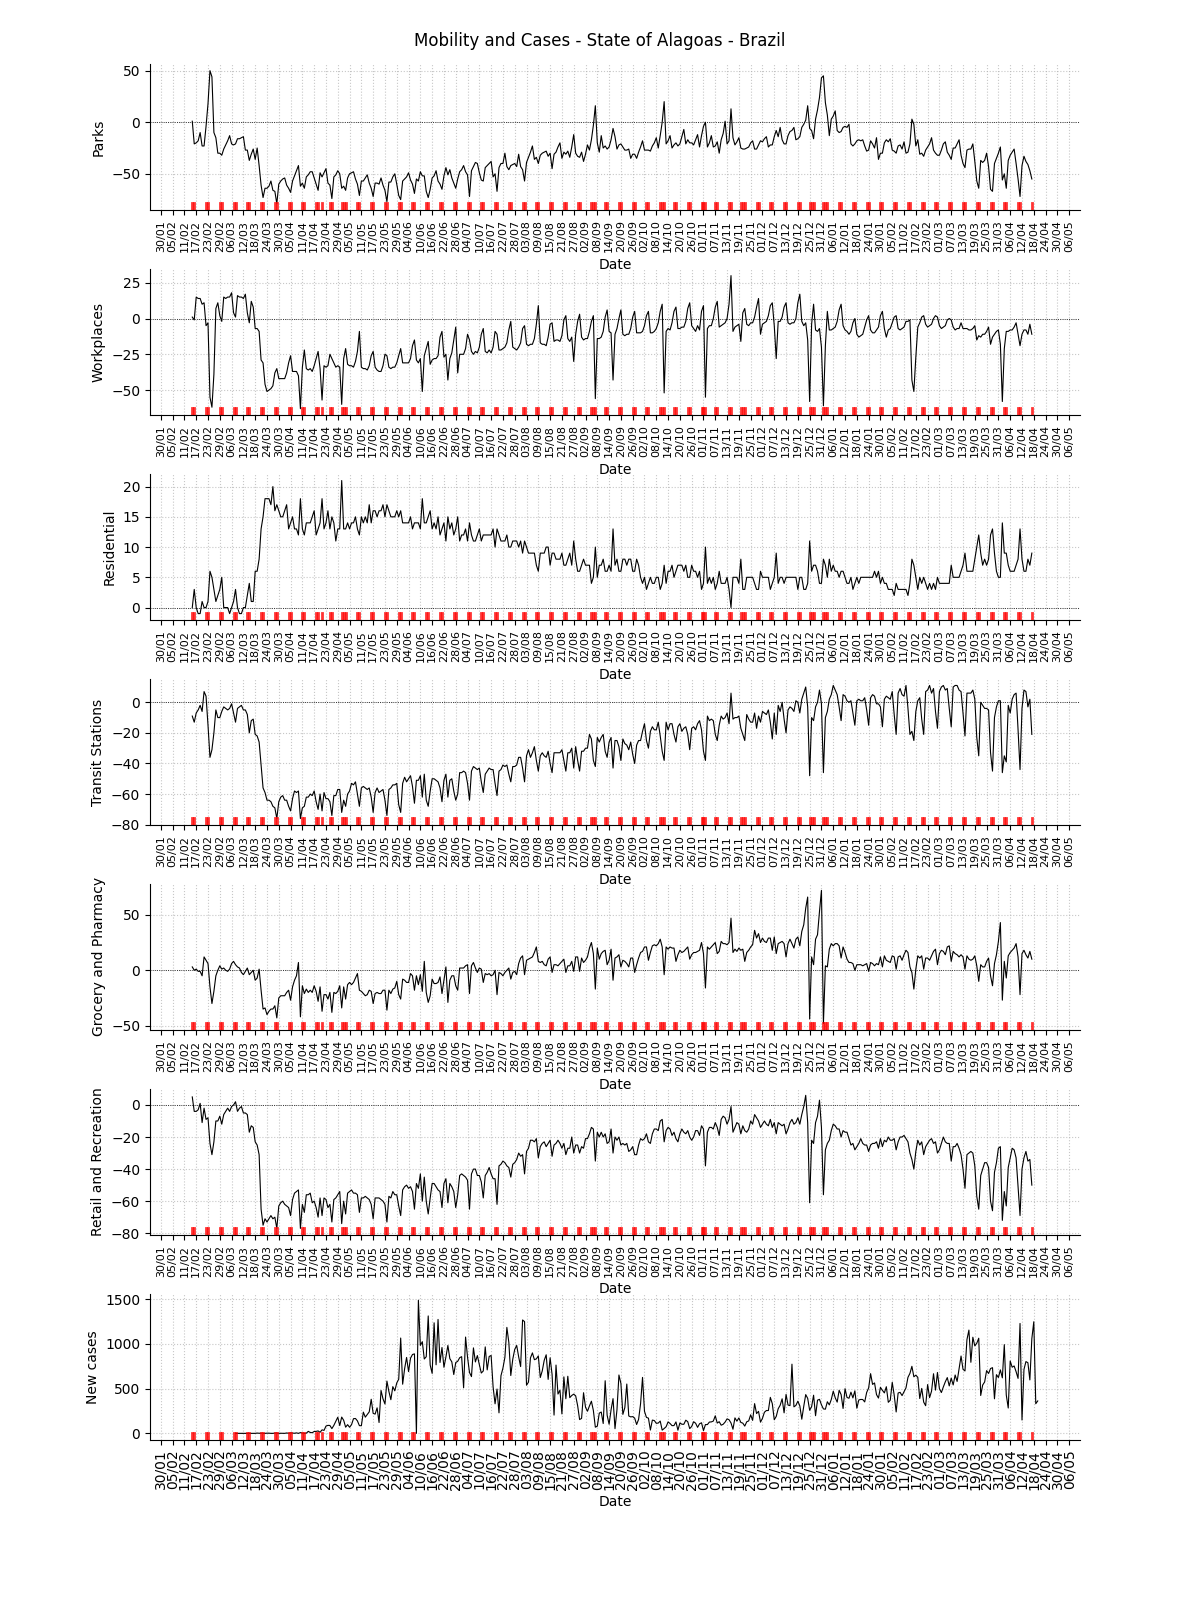
Mobility data for the state
Facebook symptom survey for the state
Note
This plot uses official data from Brazilian government as well as mobility data from Google Community Mobility Reports. The red markers on the x-axis are weekends or holidays. This plot also uses data from the Facebook Symptom survey data kindly hosted by University of Maryland.
State: Amazonas / AM
R(t) estimate, incidence and accumulated cases
![]()
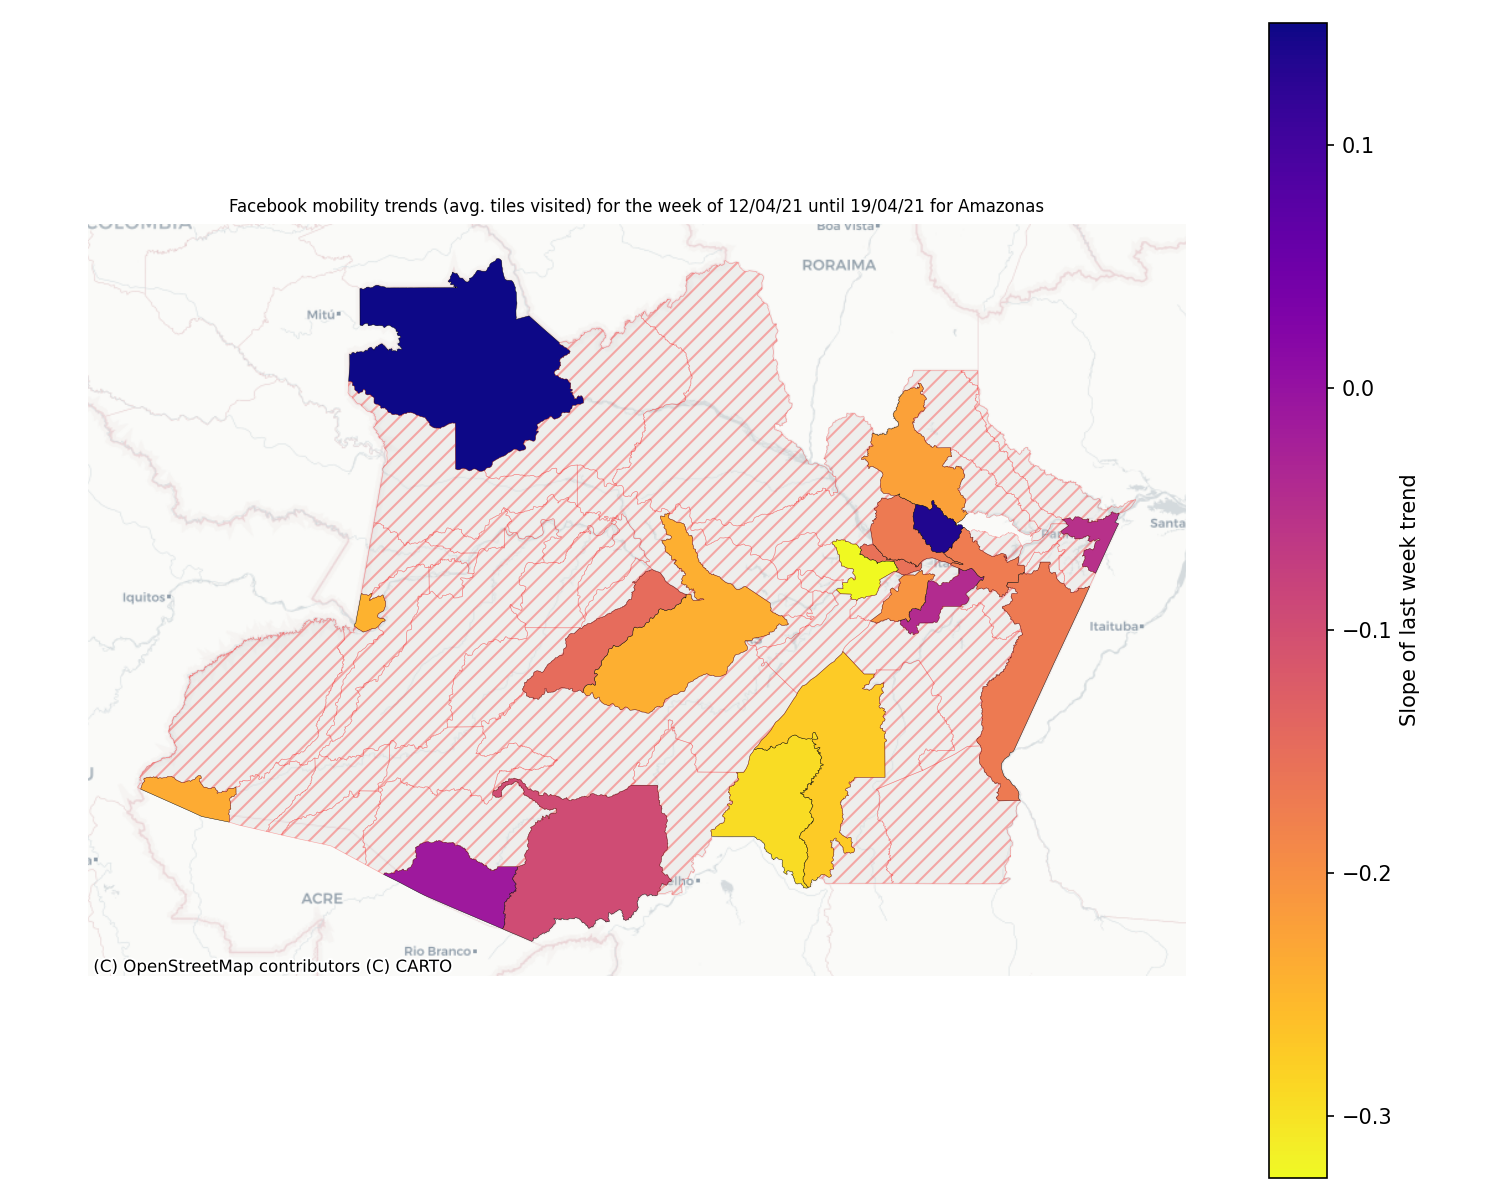
Facebook mobility trend data for the state
Note
This plot uses official data from Facebook mobility data. This data is released with a Creative Commons Attribution International license.
Mobility data for the state
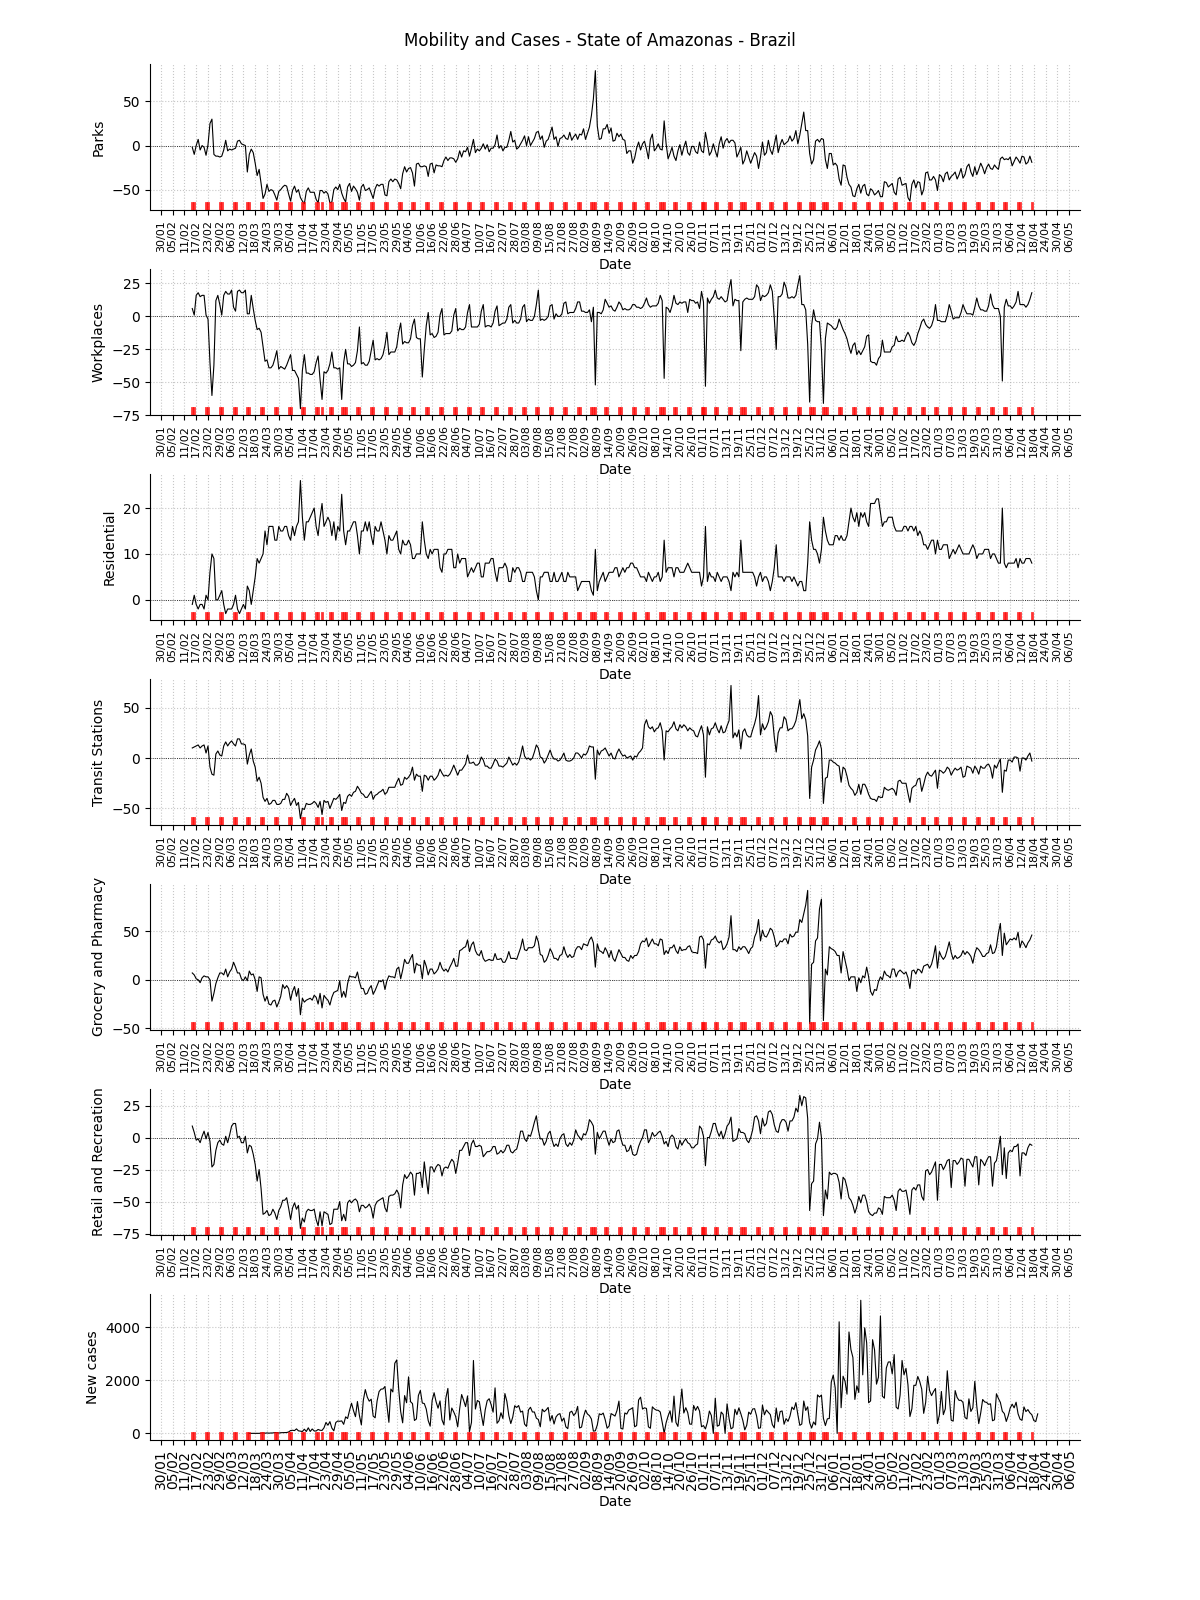
Facebook symptom survey for the state
Note
This plot uses official data from Brazilian government as well as mobility data from Google Community Mobility Reports. The red markers on the x-axis are weekends or holidays. This plot also uses data from the Facebook Symptom survey data kindly hosted by University of Maryland.
State: Amapá / AP
R(t) estimate, incidence and accumulated cases
![]()
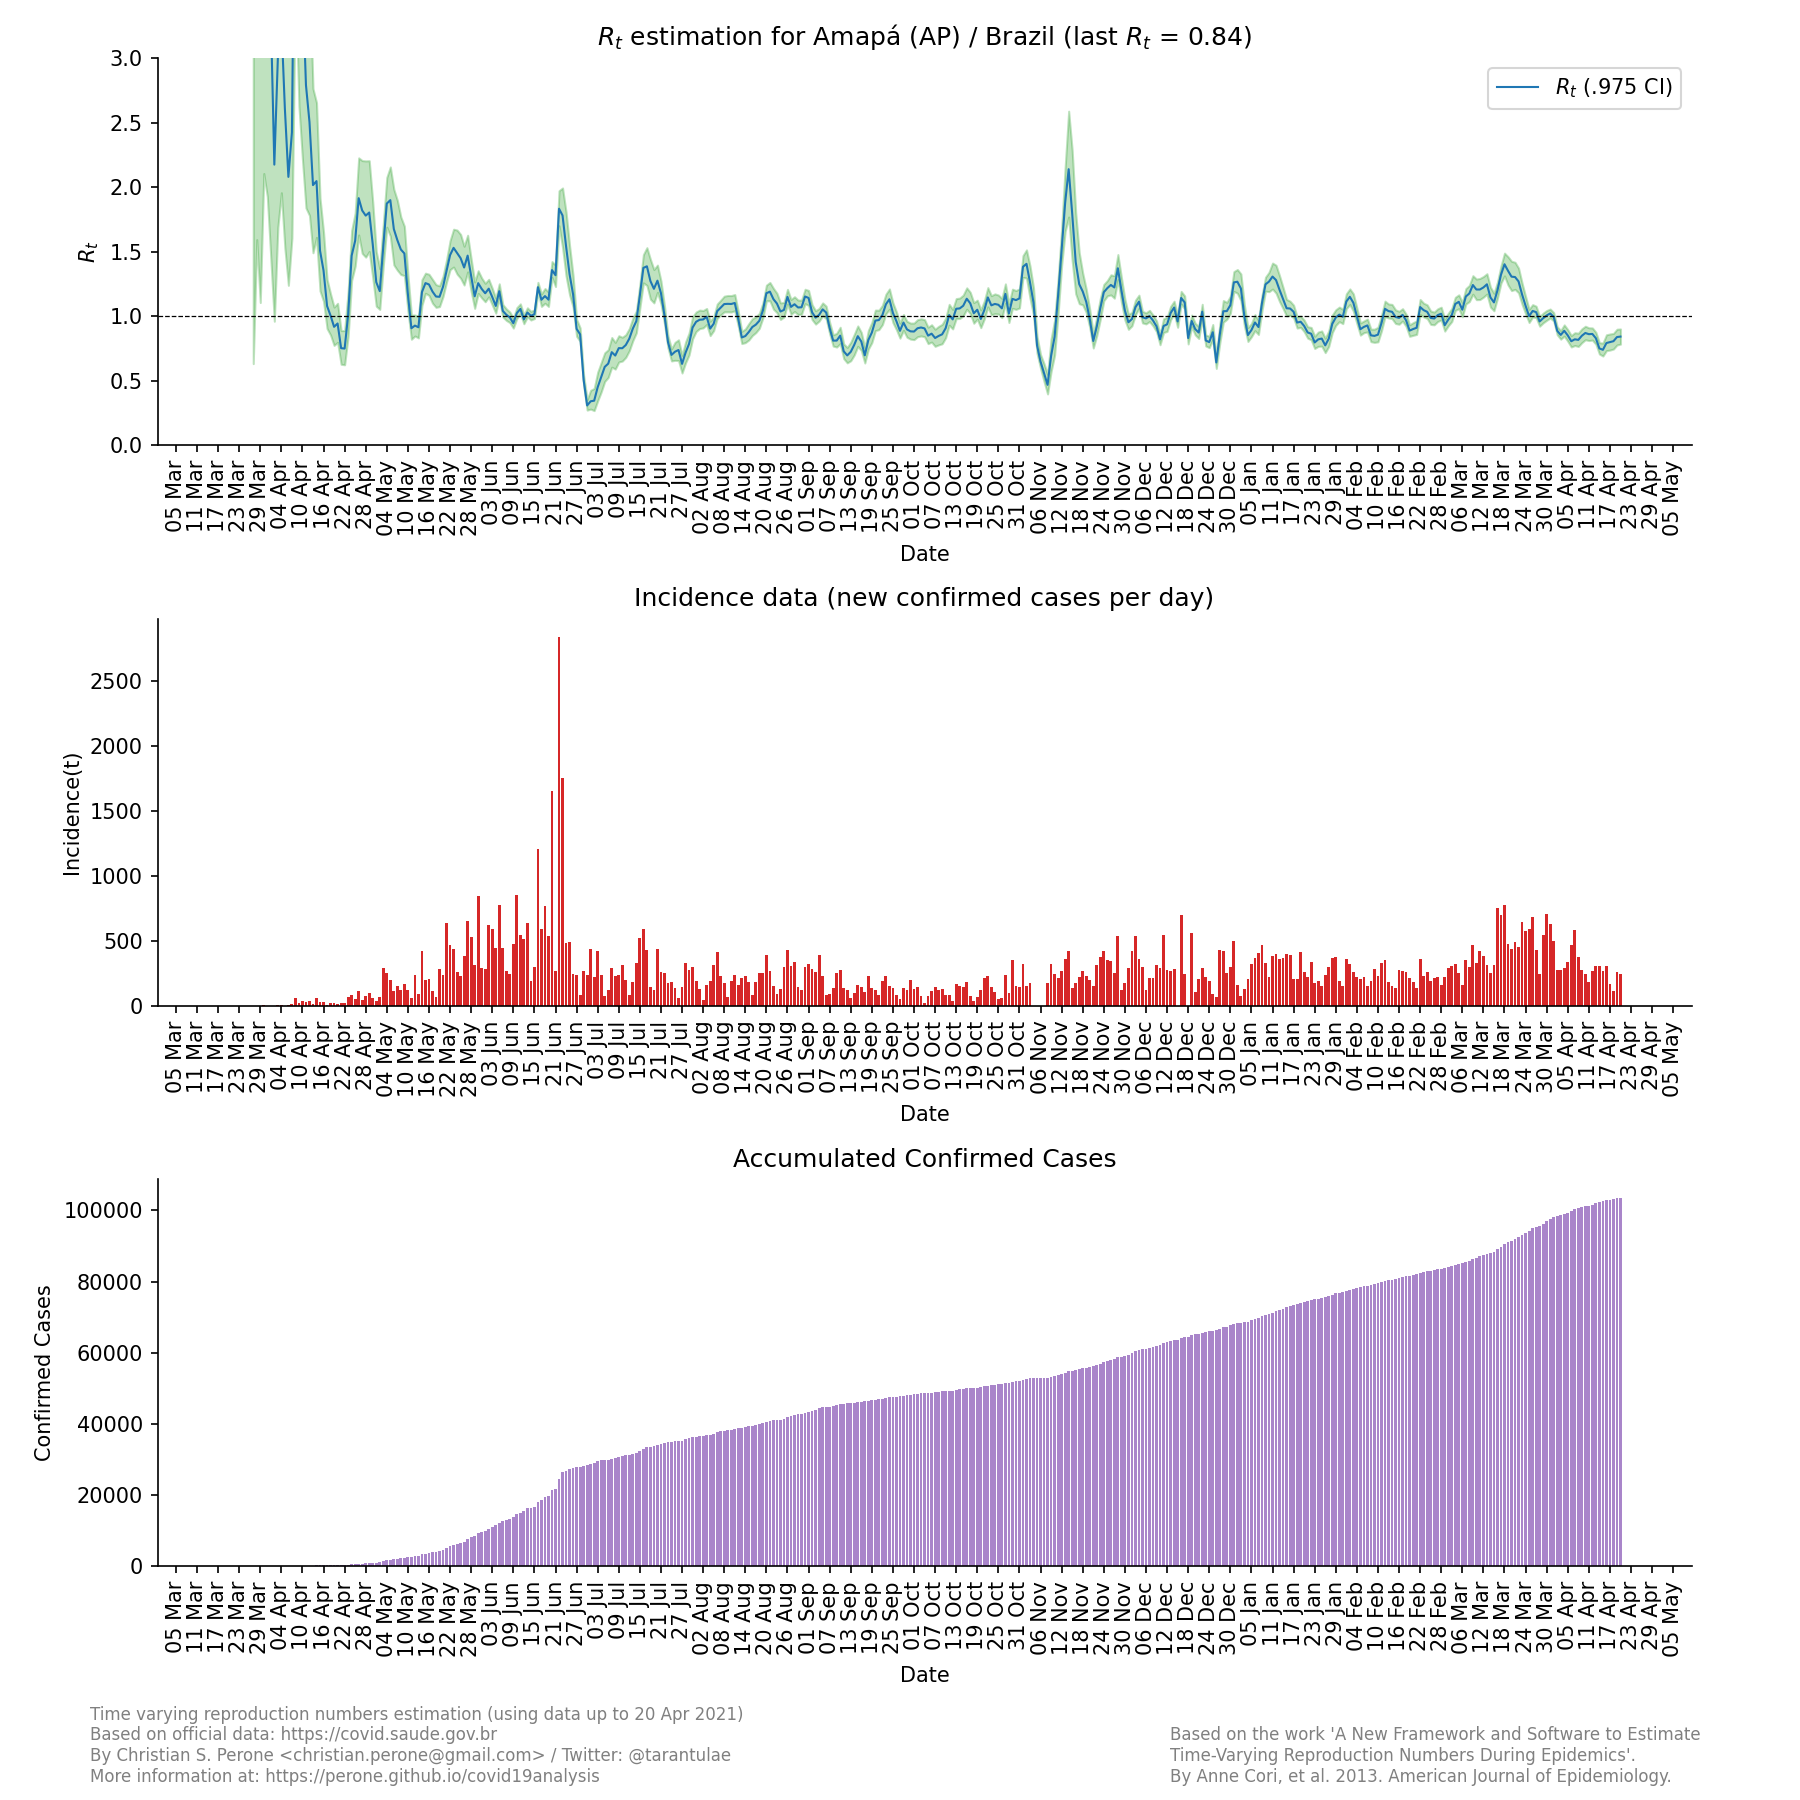
Facebook mobility trend data for the state
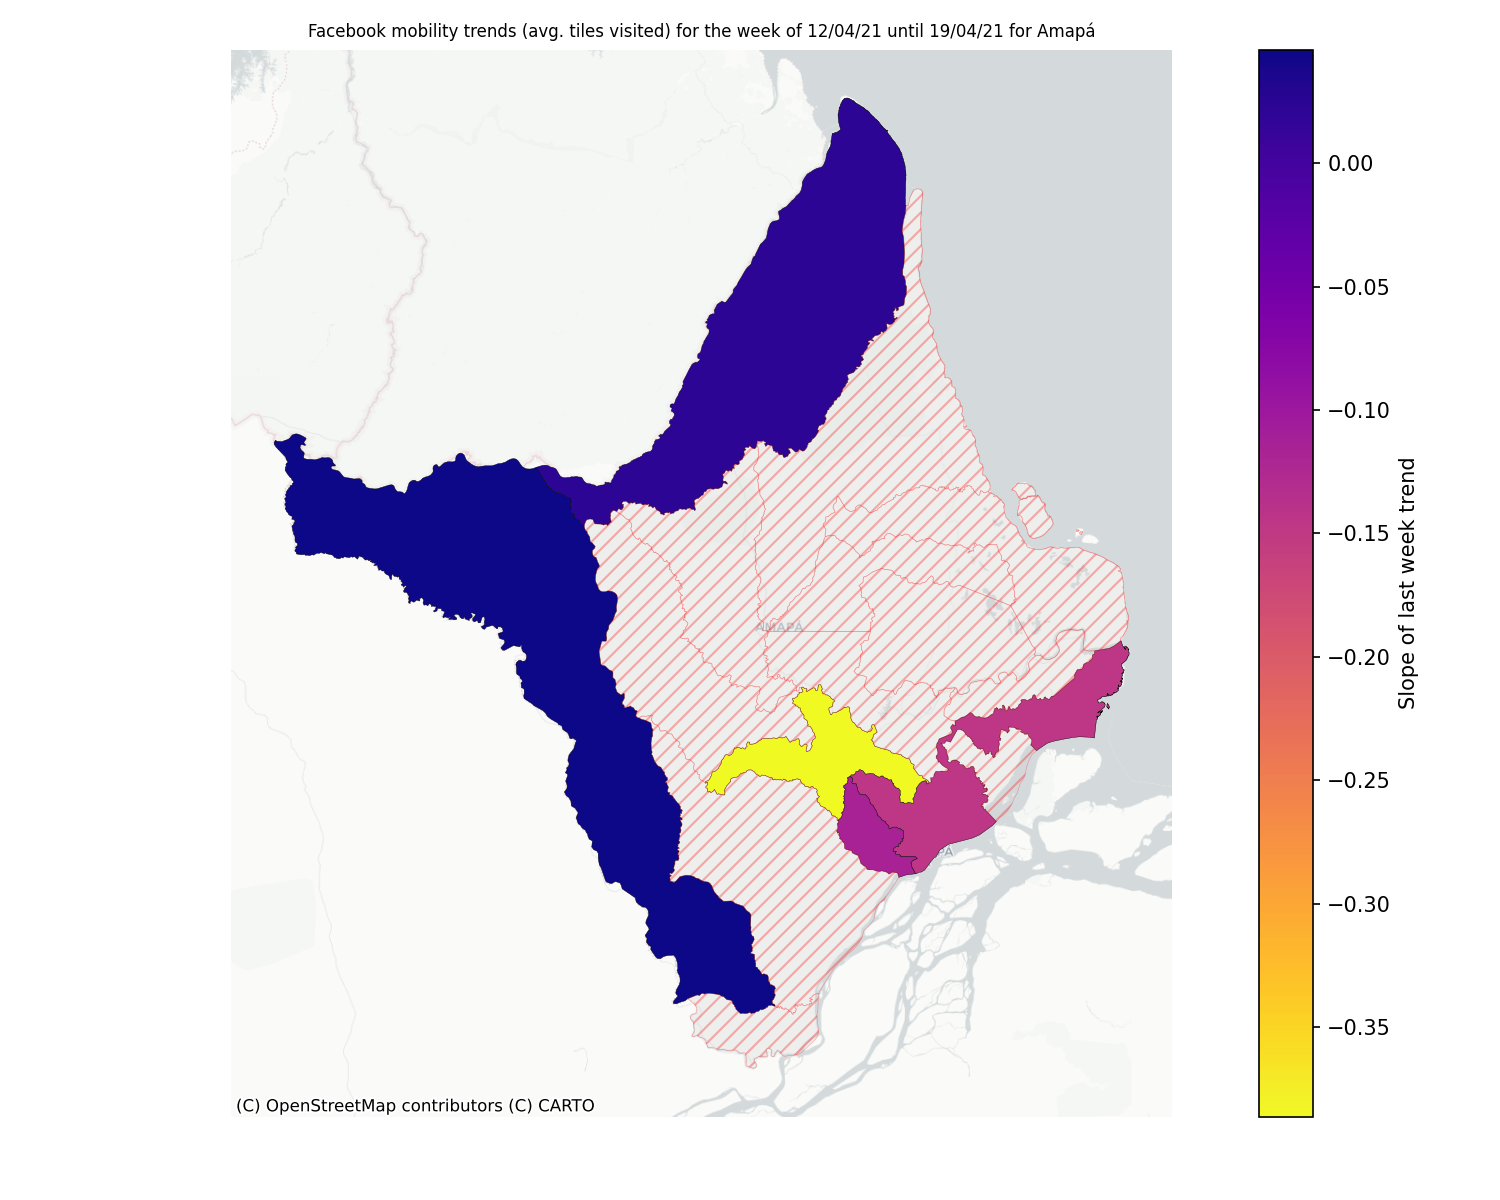
Note
This plot uses official data from Facebook mobility data. This data is released with a Creative Commons Attribution International license.
Mobility data for the state
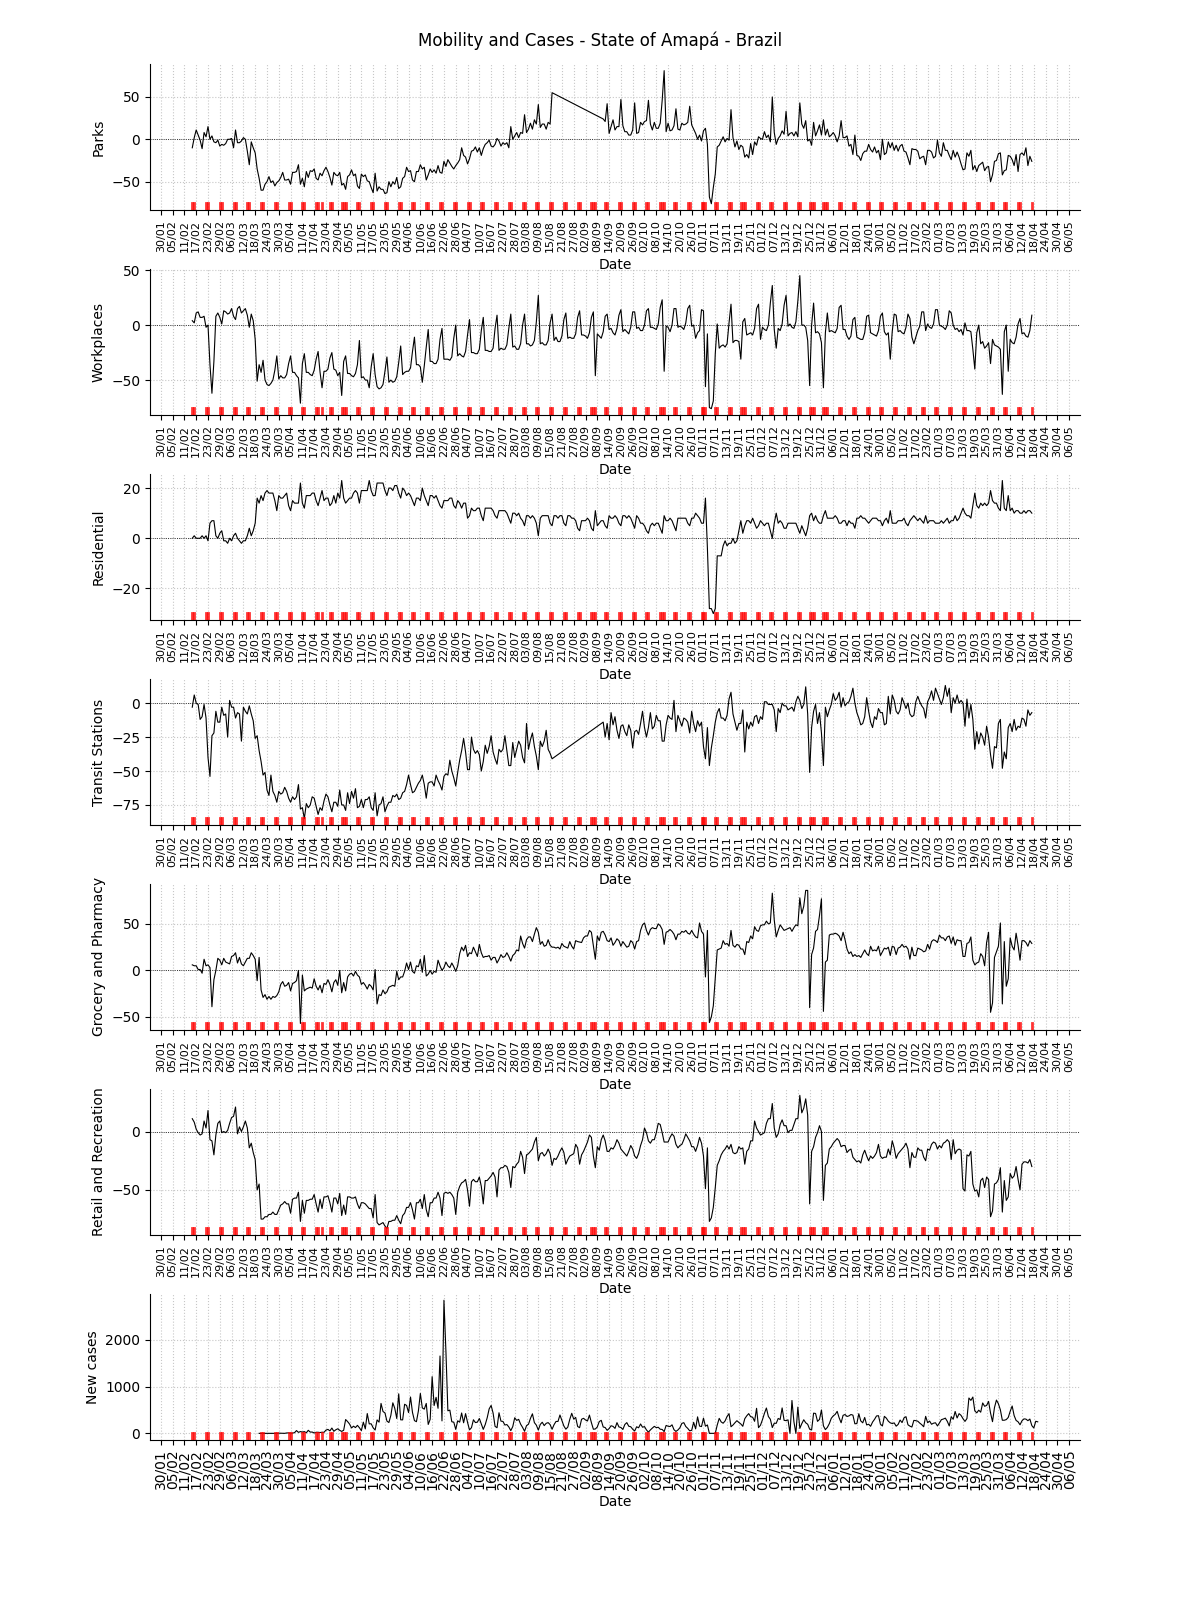
Facebook symptom survey for the state
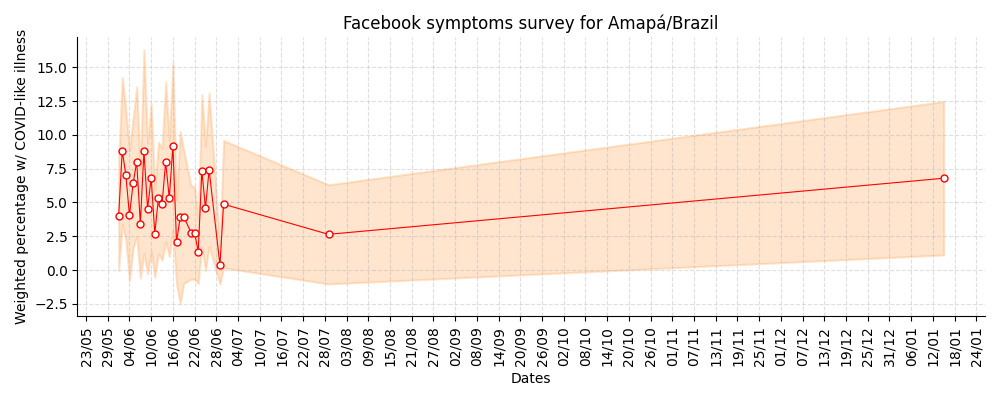
Note
This plot uses official data from Brazilian government as well as mobility data from Google Community Mobility Reports. The red markers on the x-axis are weekends or holidays. This plot also uses data from the Facebook Symptom survey data kindly hosted by University of Maryland.
State: Bahia / BA
R(t) estimate, incidence and accumulated cases
![]()
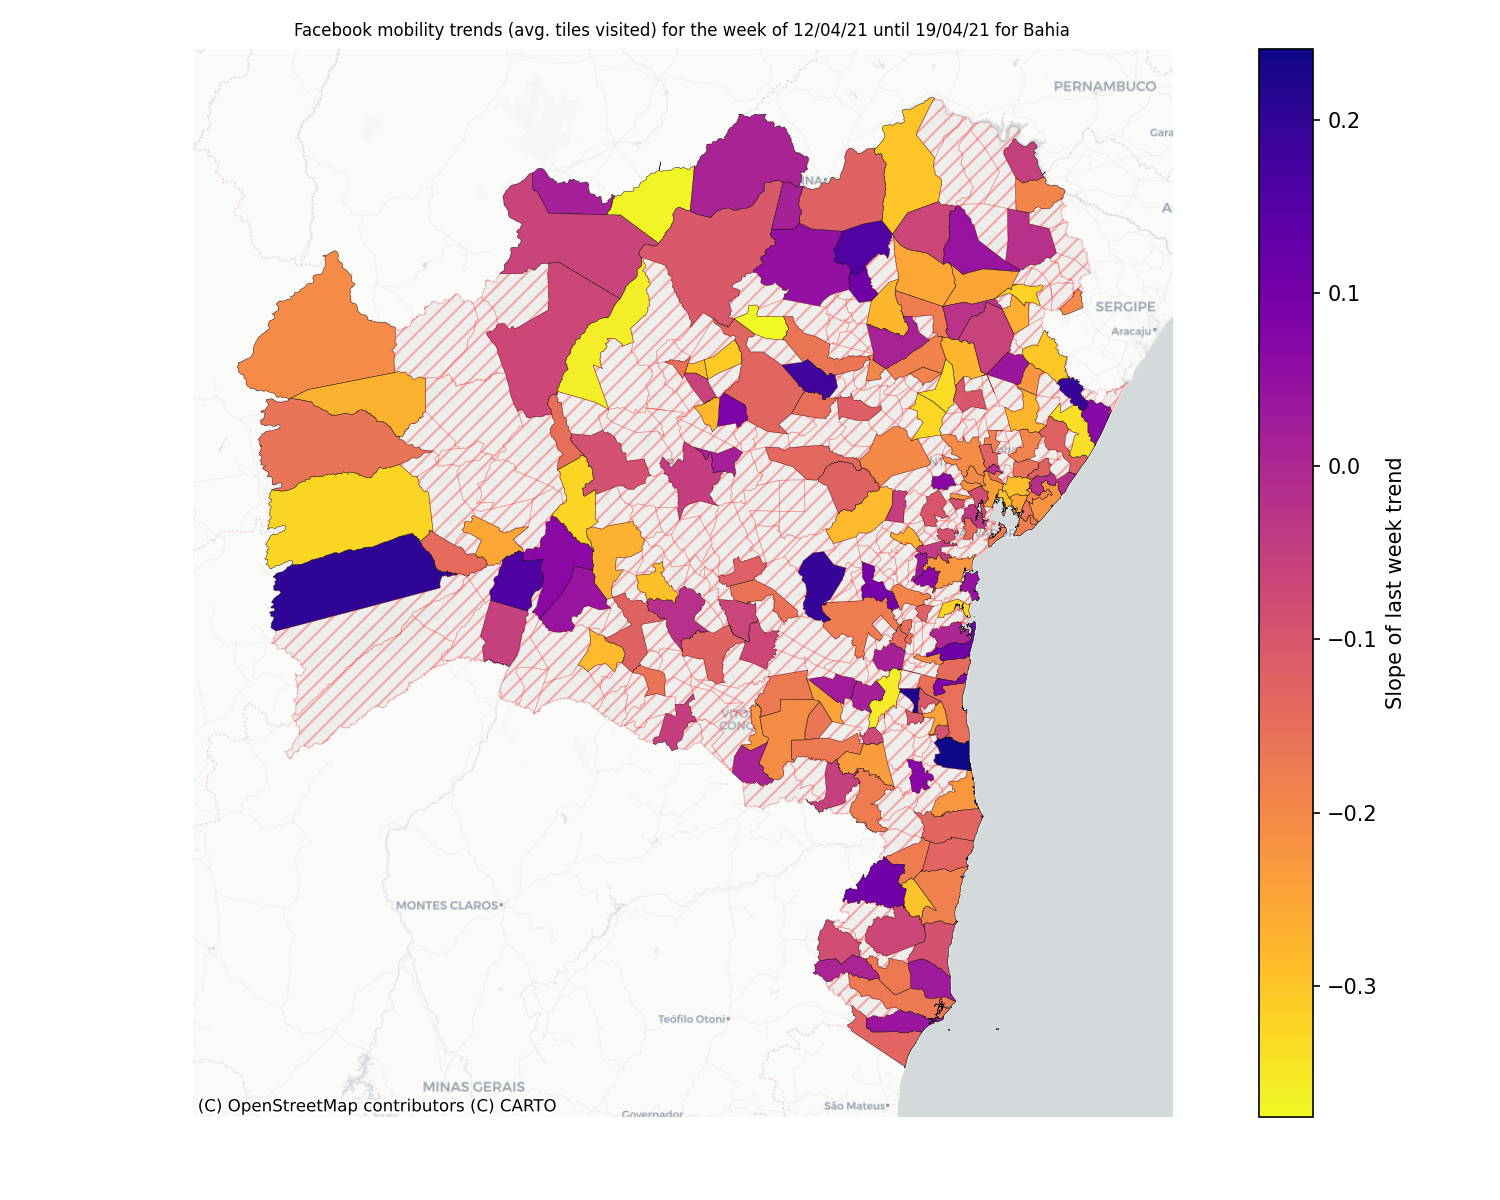
Facebook mobility trend data for the state
Note
This plot uses official data from Facebook mobility data. This data is released with a Creative Commons Attribution International license.
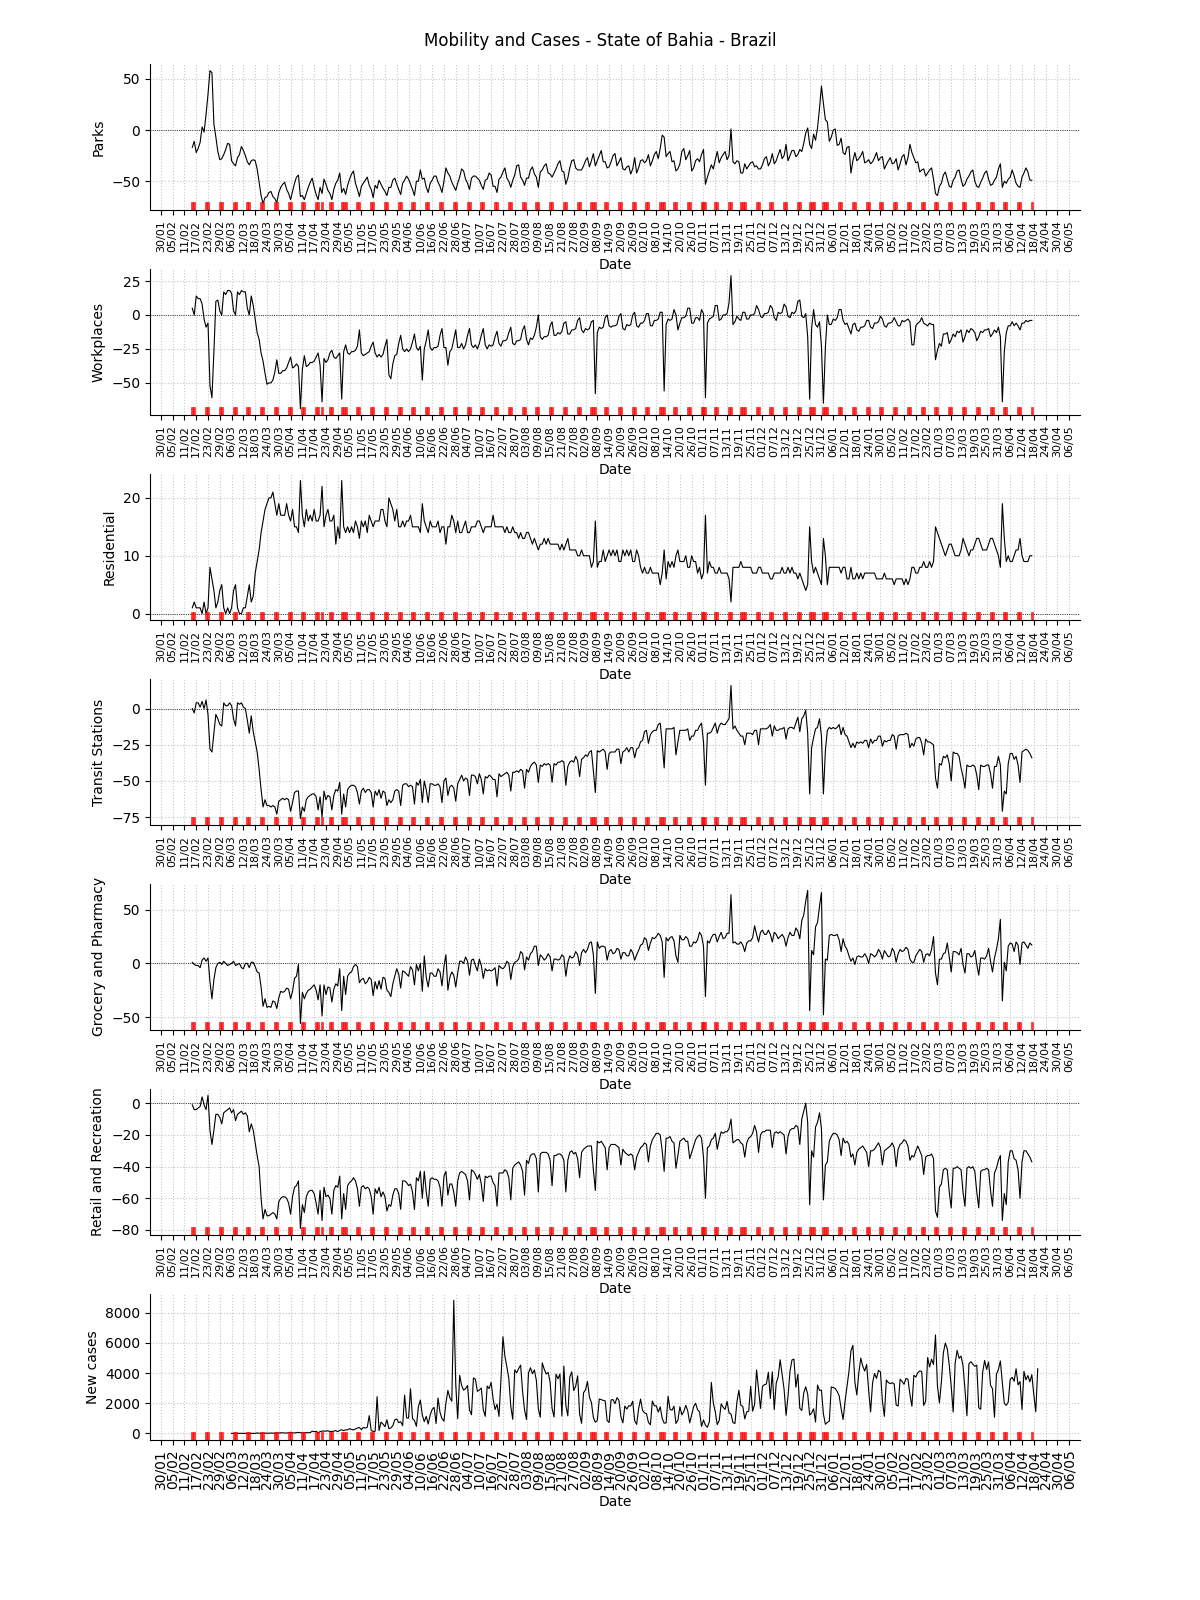
Mobility data for the state
Facebook symptom survey for the state
Note
This plot uses official data from Brazilian government as well as mobility data from Google Community Mobility Reports. The red markers on the x-axis are weekends or holidays. This plot also uses data from the Facebook Symptom survey data kindly hosted by University of Maryland.
State: Ceará / CE
R(t) estimate, incidence and accumulated cases
![]()
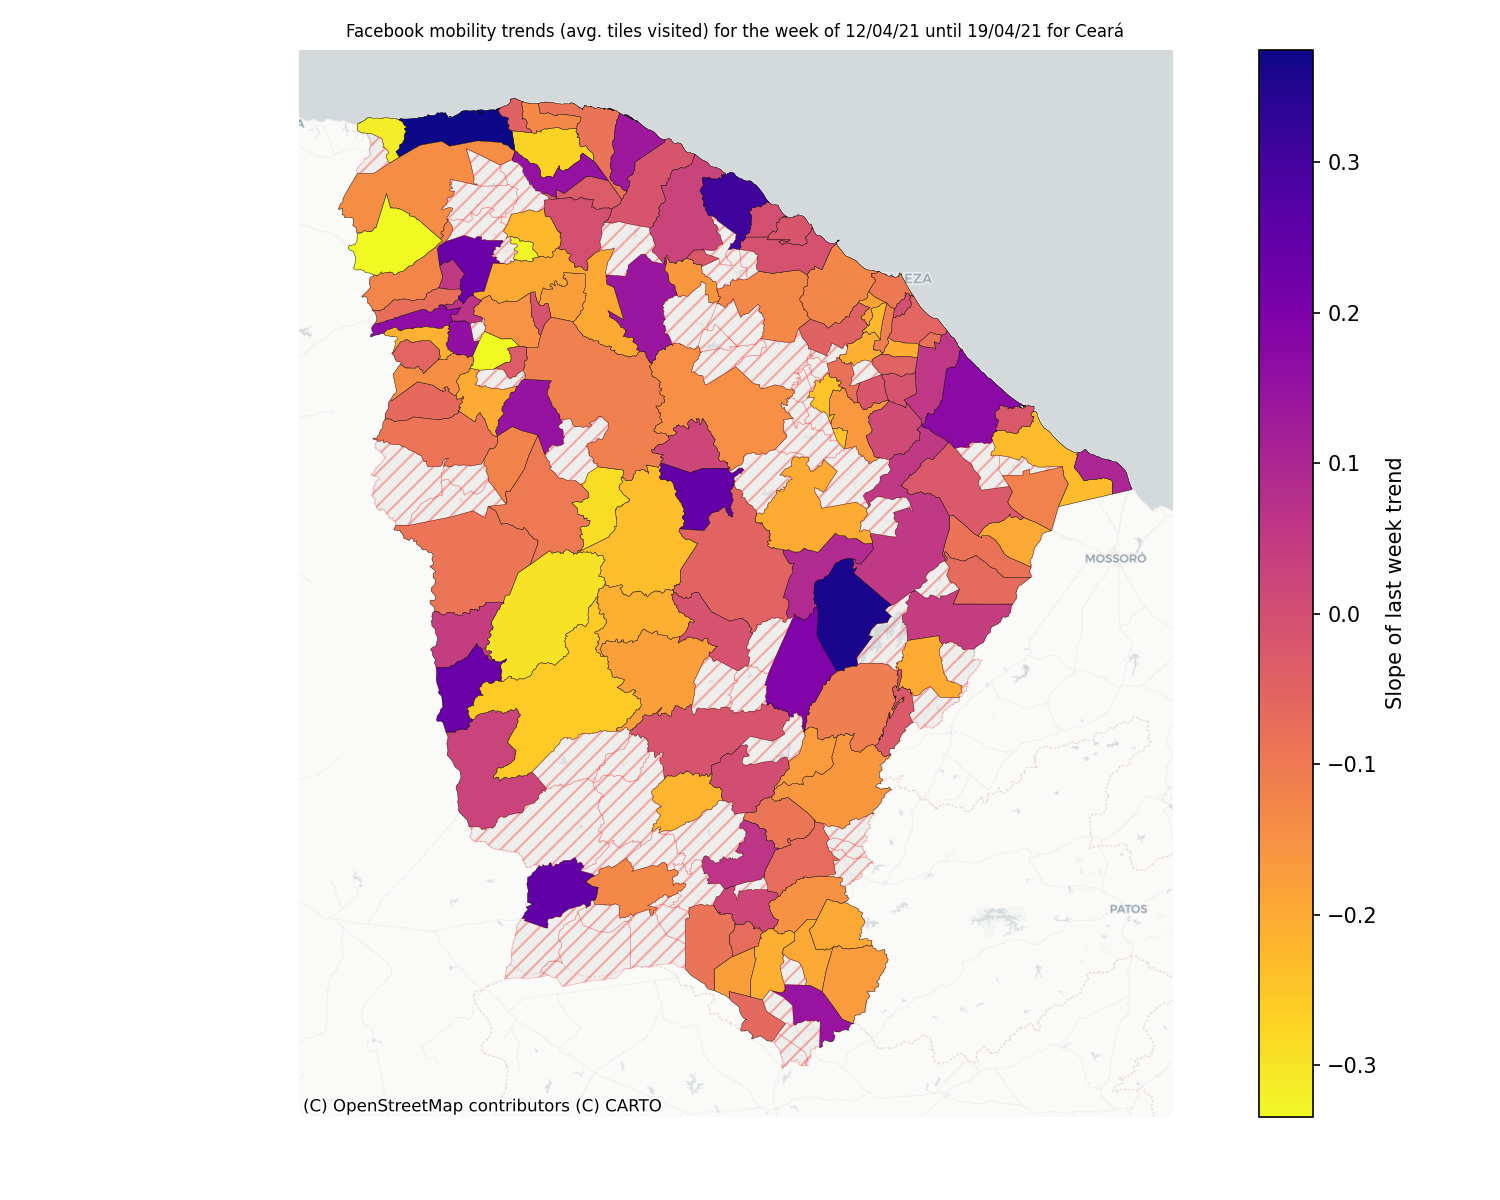
Facebook mobility trend data for the state
Note
This plot uses official data from Facebook mobility data. This data is released with a Creative Commons Attribution International license.
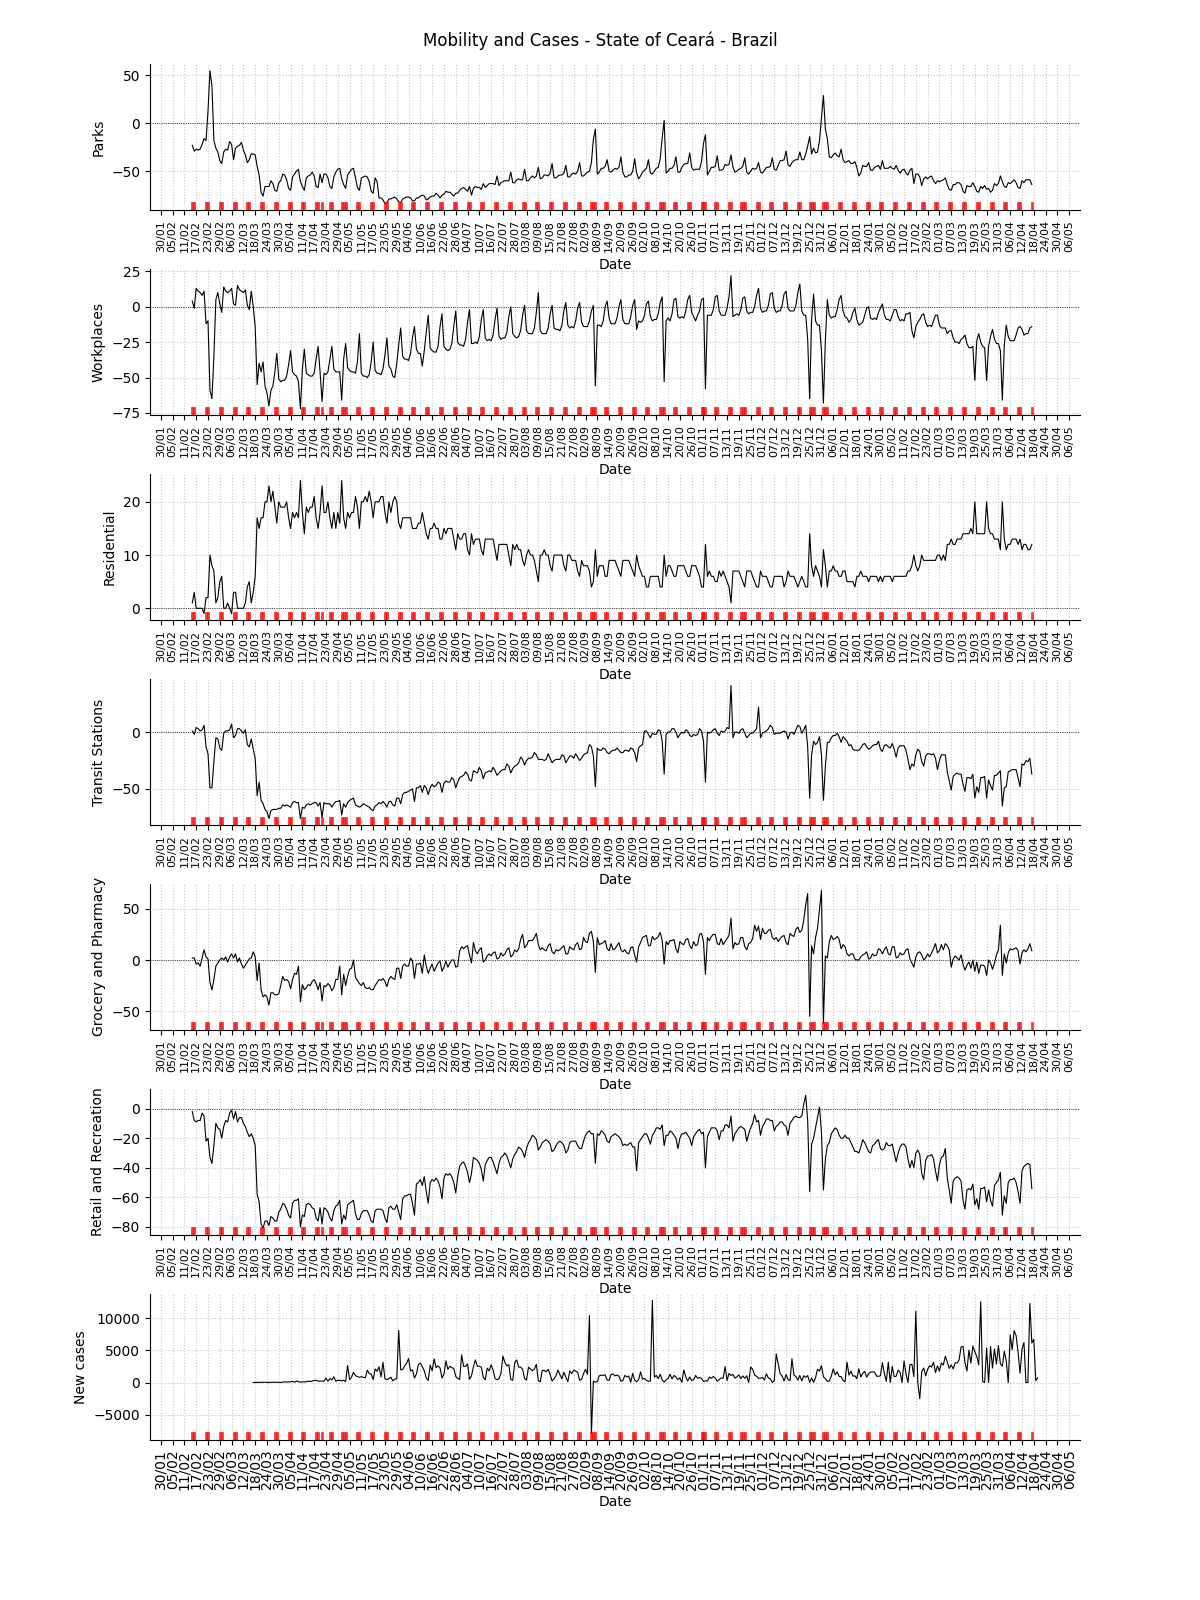
Mobility data for the state
Facebook symptom survey for the state
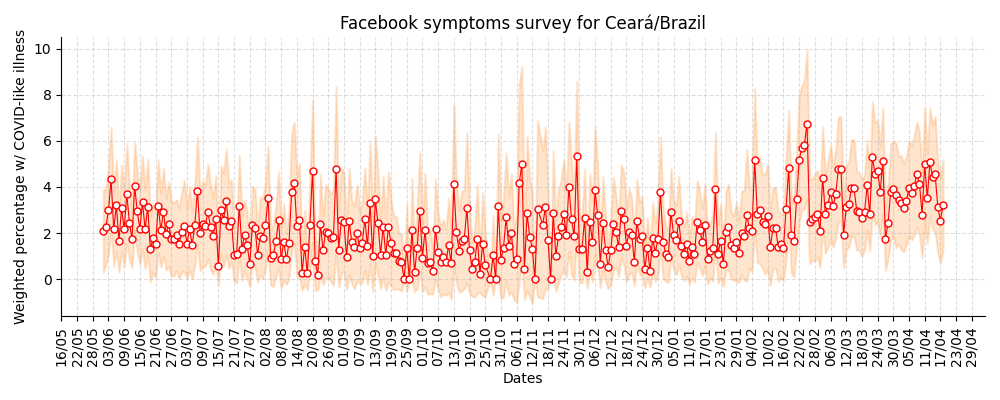
Note
This plot uses official data from Brazilian government as well as mobility data from Google Community Mobility Reports. The red markers on the x-axis are weekends or holidays. This plot also uses data from the Facebook Symptom survey data kindly hosted by University of Maryland.
State: Distrito Federal / DF
R(t) estimate, incidence and accumulated cases
![]()
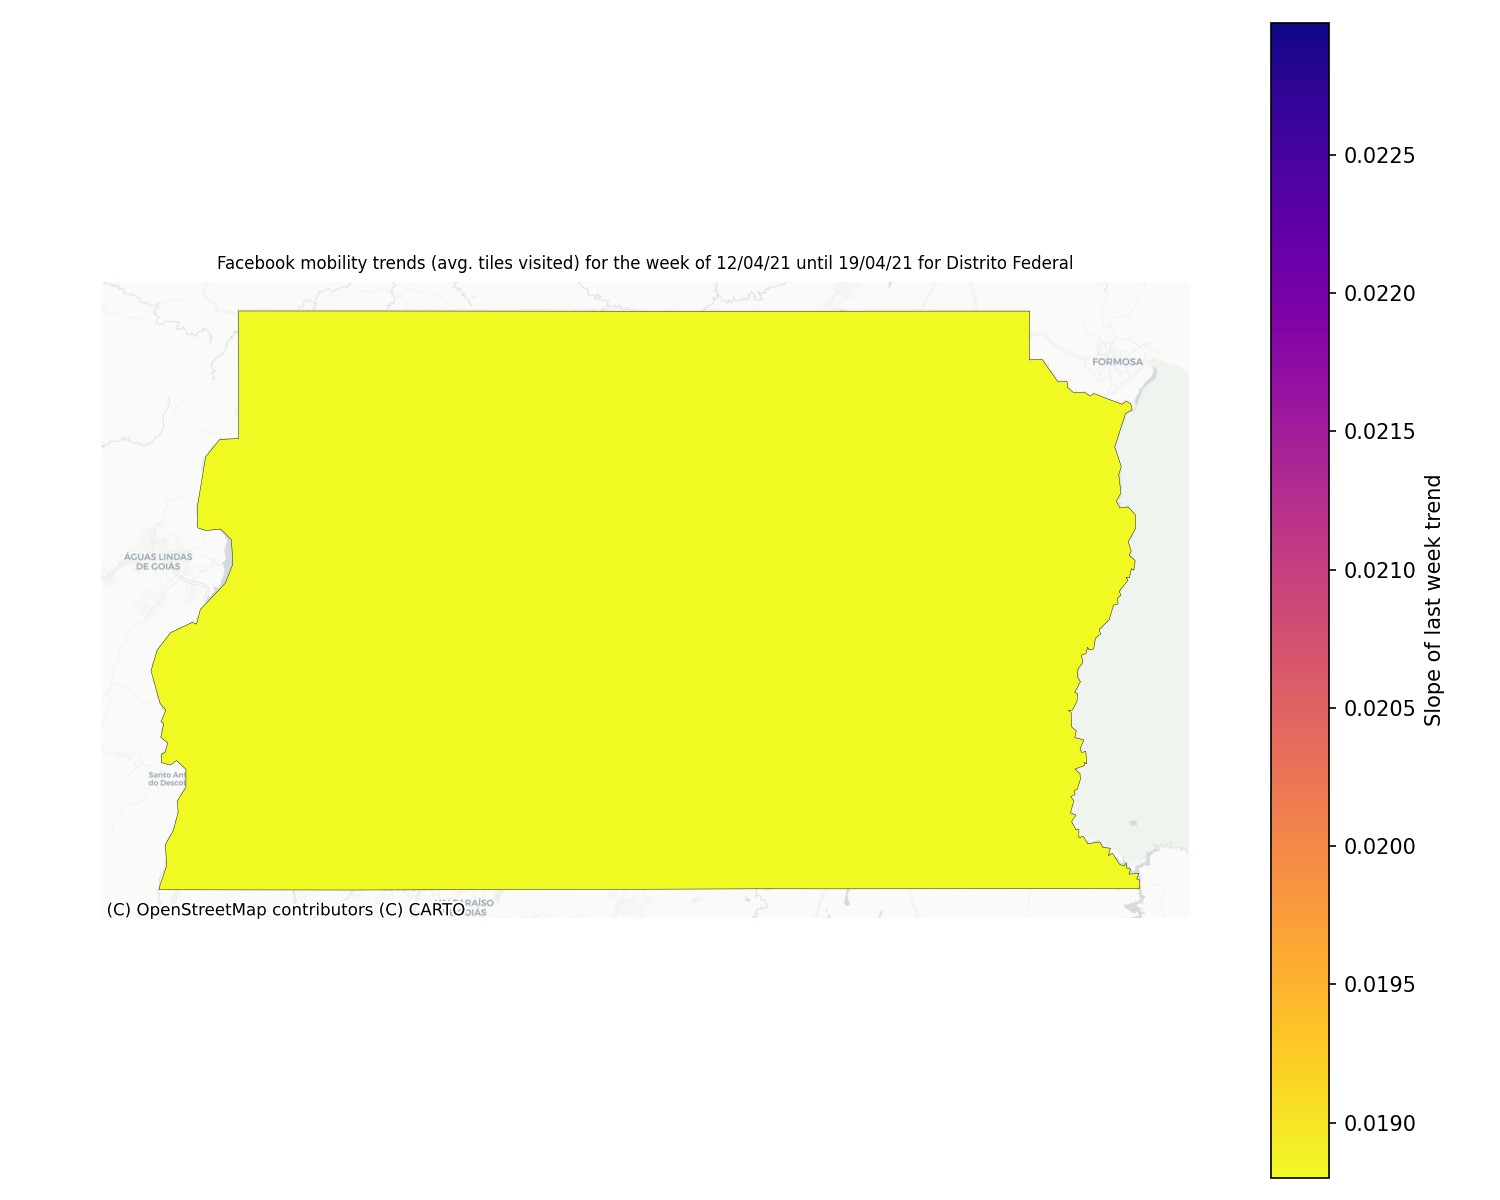
Facebook mobility trend data for the state
Note
This plot uses official data from Facebook mobility data. This data is released with a Creative Commons Attribution International license.
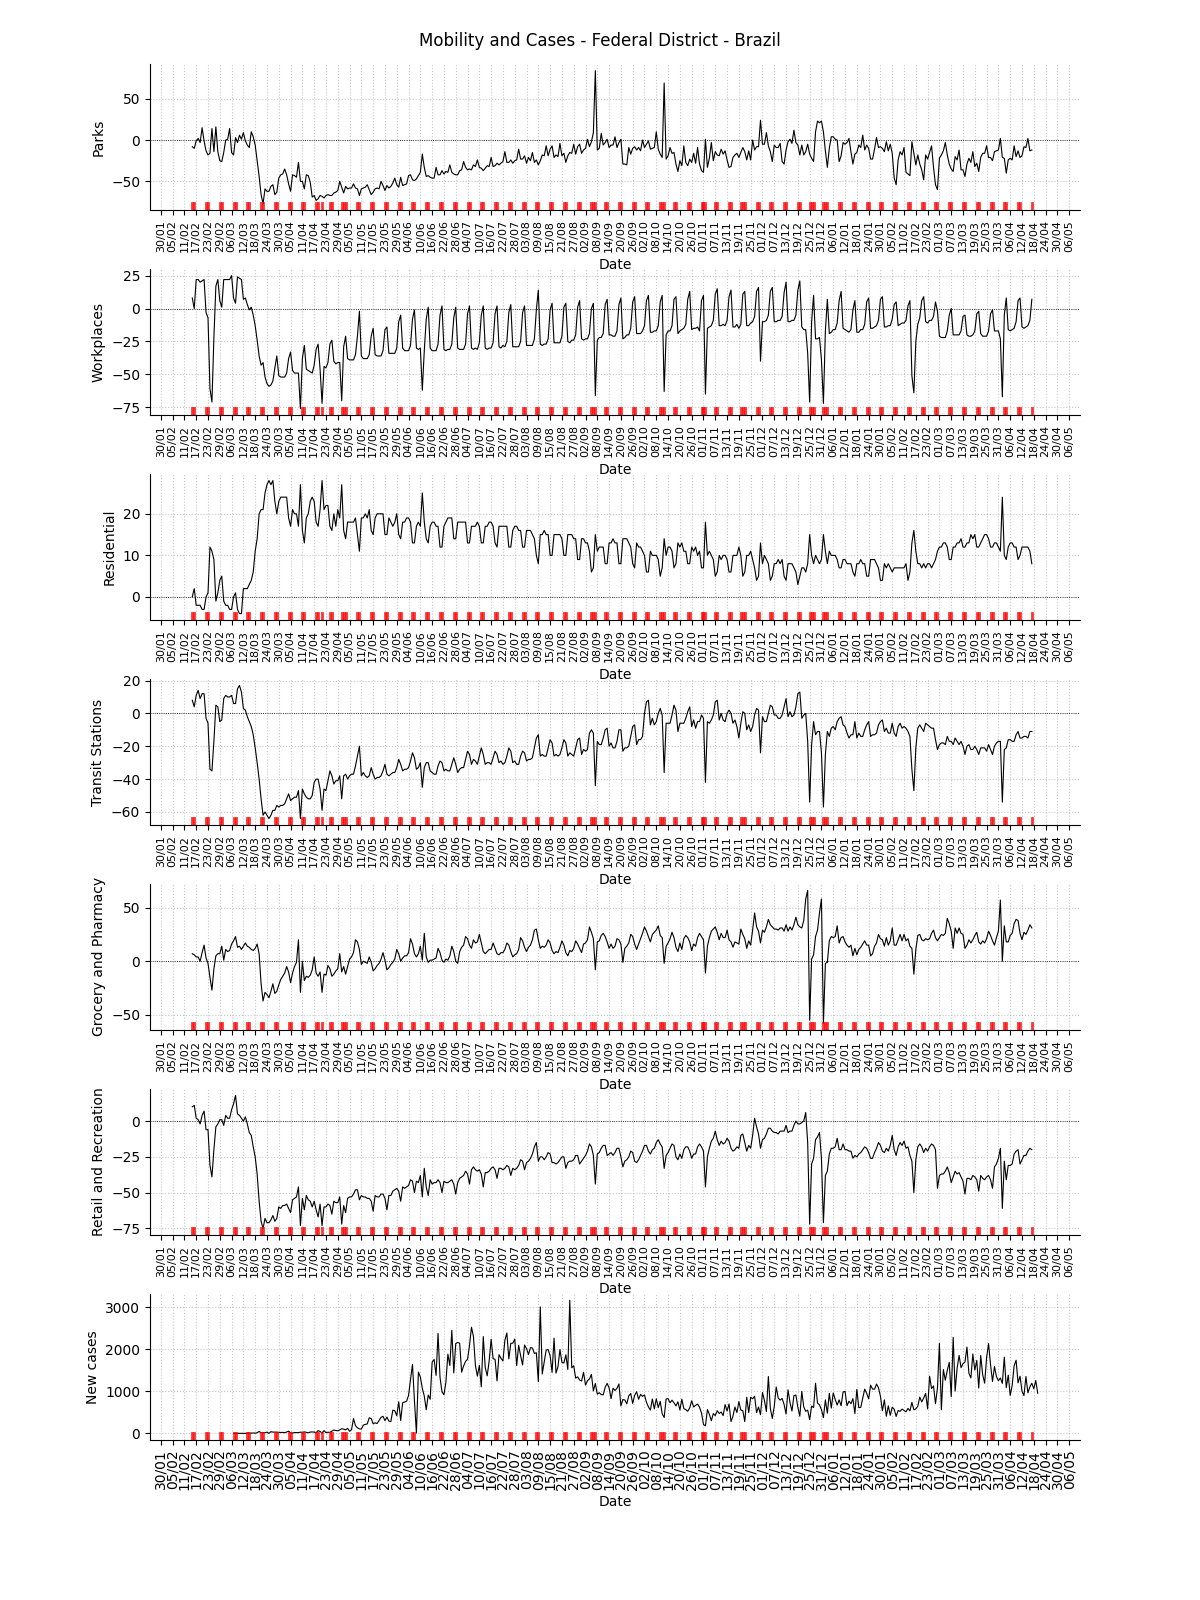
Mobility data for the state
Facebook symptom survey for the state
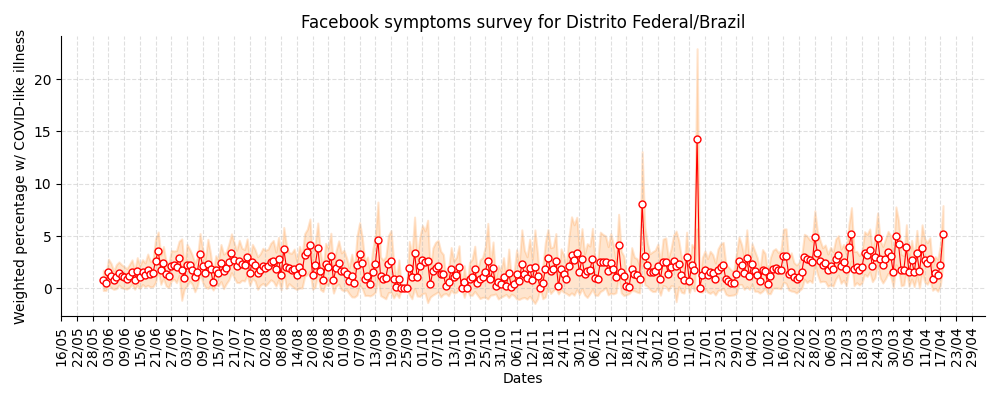
Note
This plot uses official data from Brazilian government as well as mobility data from Google Community Mobility Reports. The red markers on the x-axis are weekends or holidays. This plot also uses data from the Facebook Symptom survey data kindly hosted by University of Maryland.
State: Espírito Santo / ES
R(t) estimate, incidence and accumulated cases
![]()
Facebook mobility trend data for the state
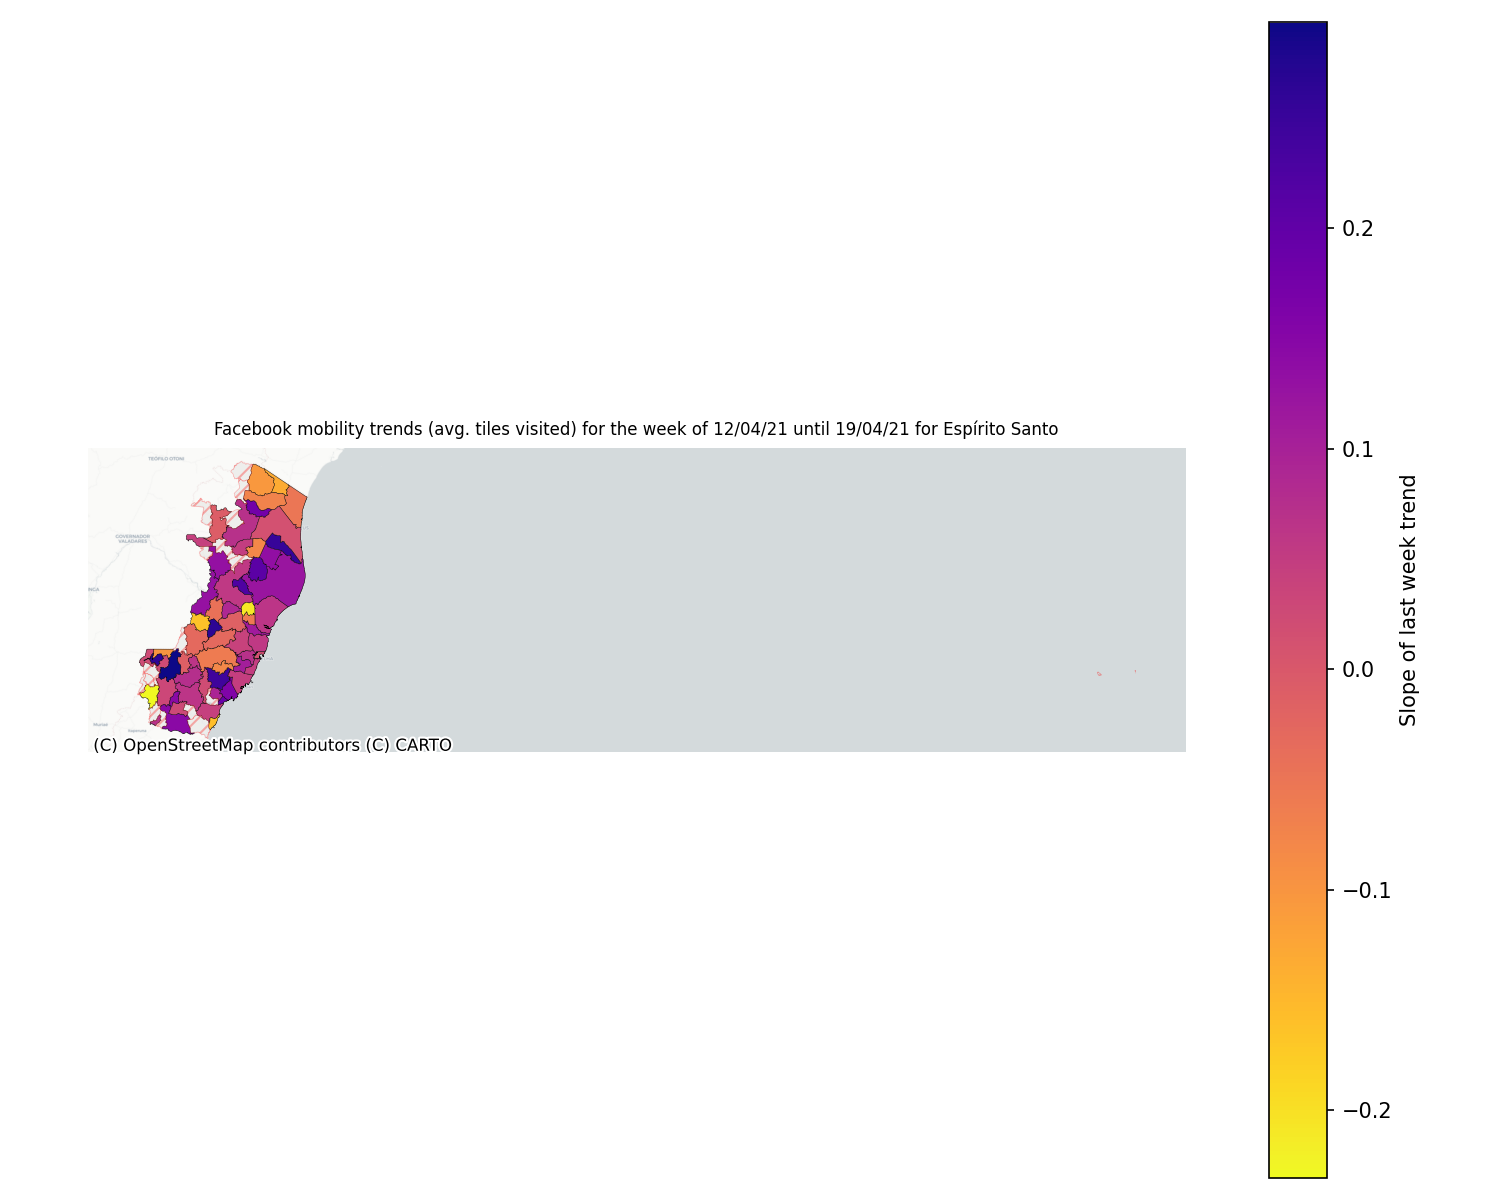
Note
This plot uses official data from Facebook mobility data. This data is released with a Creative Commons Attribution International license.
Mobility data for the state
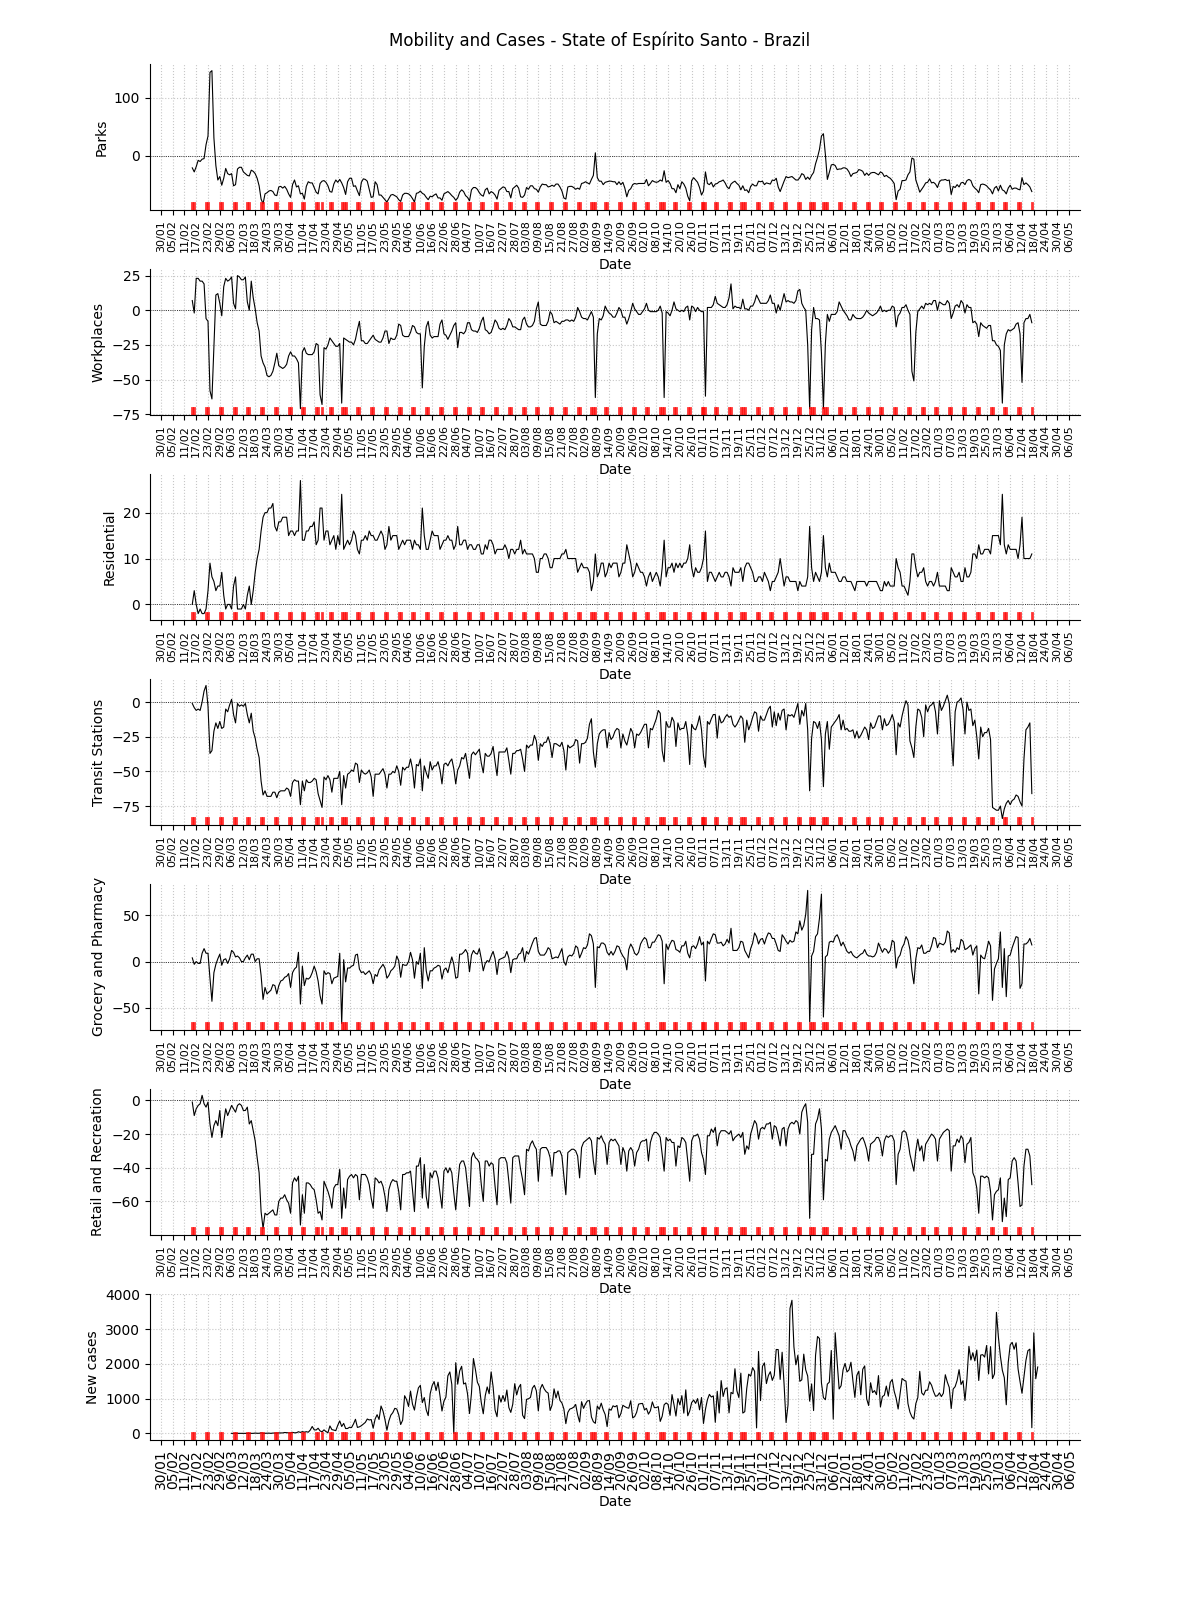
Facebook symptom survey for the state

Note
This plot uses official data from Brazilian government as well as mobility data from Google Community Mobility Reports. The red markers on the x-axis are weekends or holidays. This plot also uses data from the Facebook Symptom survey data kindly hosted by University of Maryland.
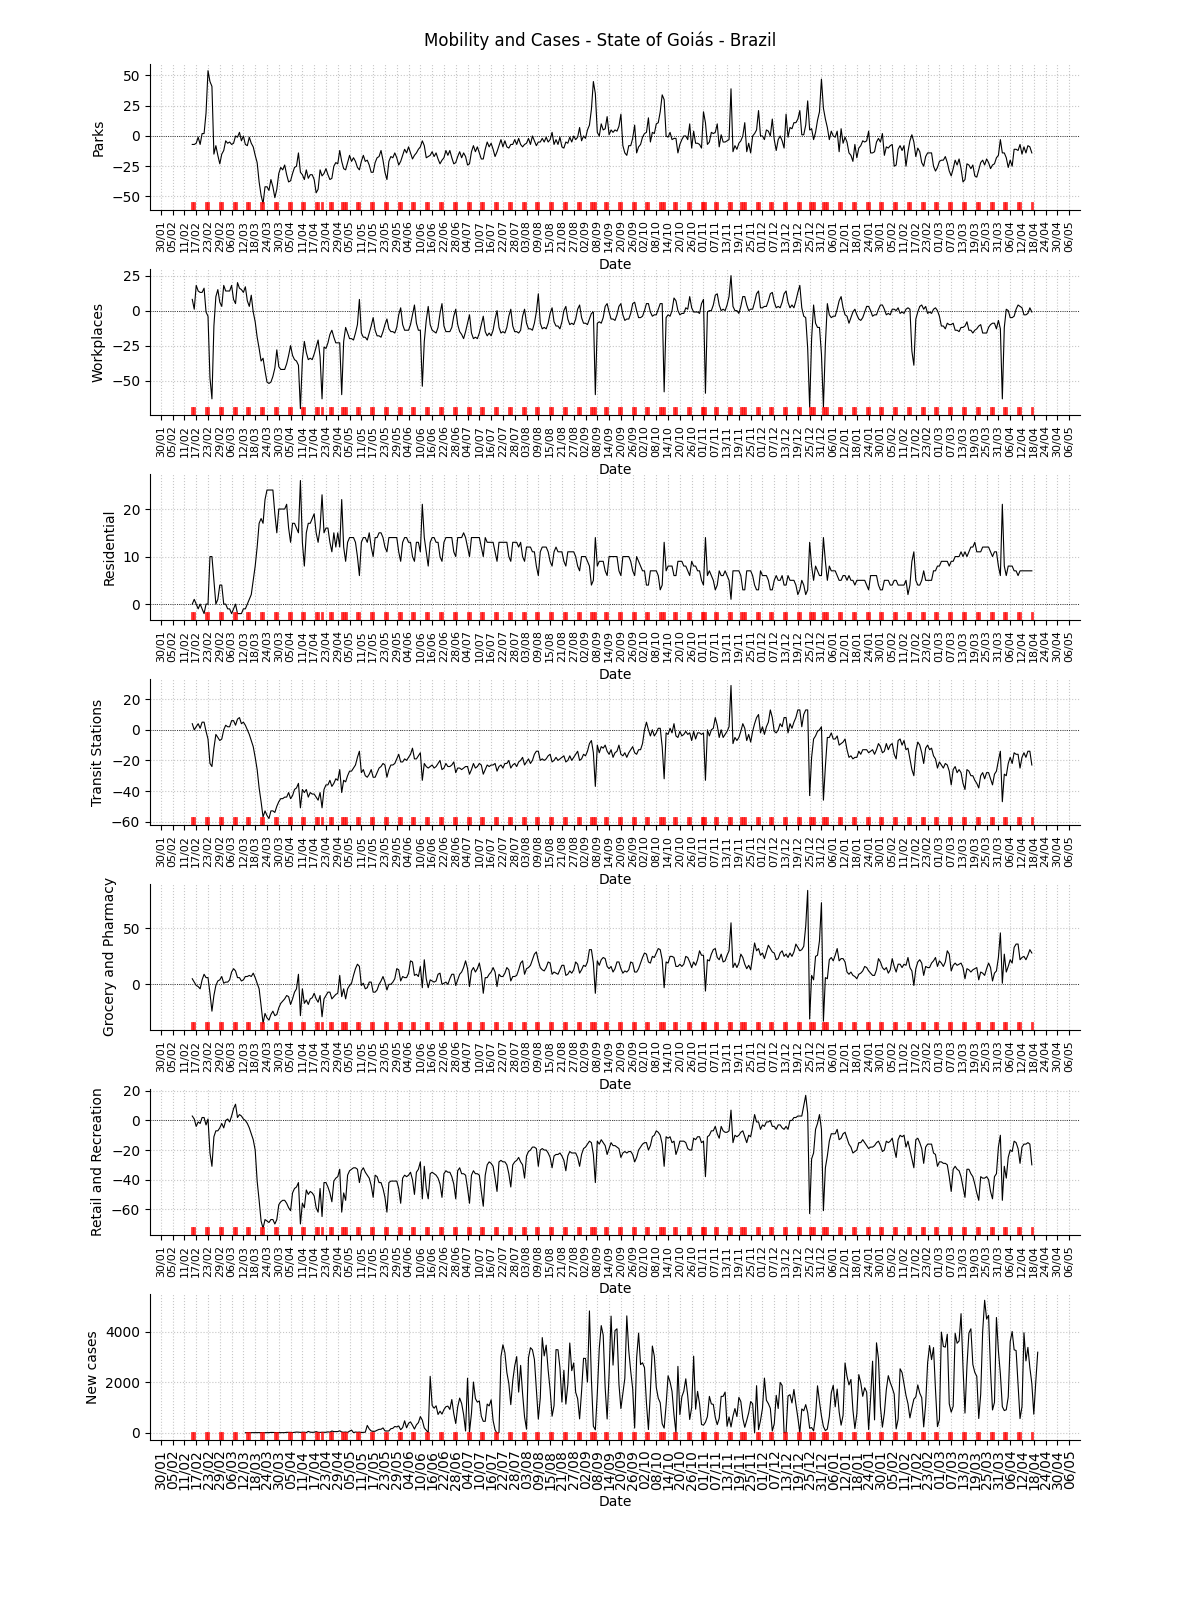
State: Goiás / GO
R(t) estimate, incidence and accumulated cases
![]()
Facebook mobility trend data for the state

Note
This plot uses official data from Facebook mobility data. This data is released with a Creative Commons Attribution International license.
Mobility data for the state
Facebook symptom survey for the state
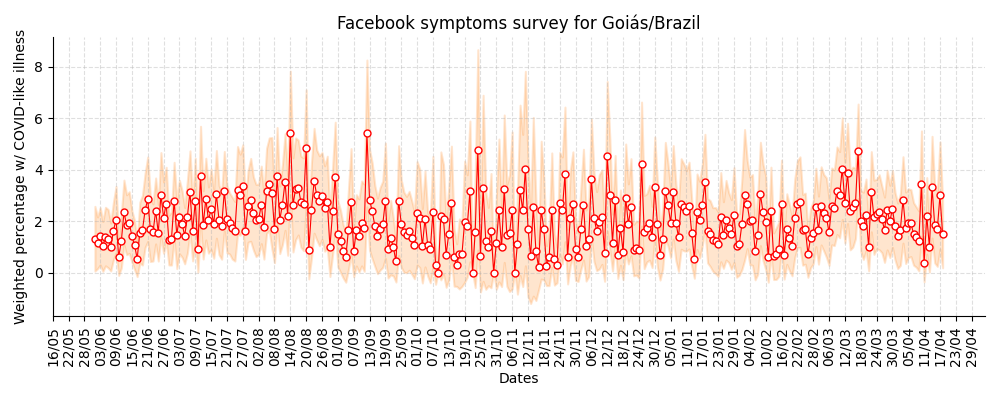
Note
This plot uses official data from Brazilian government as well as mobility data from Google Community Mobility Reports. The red markers on the x-axis are weekends or holidays. This plot also uses data from the Facebook Symptom survey data kindly hosted by University of Maryland.
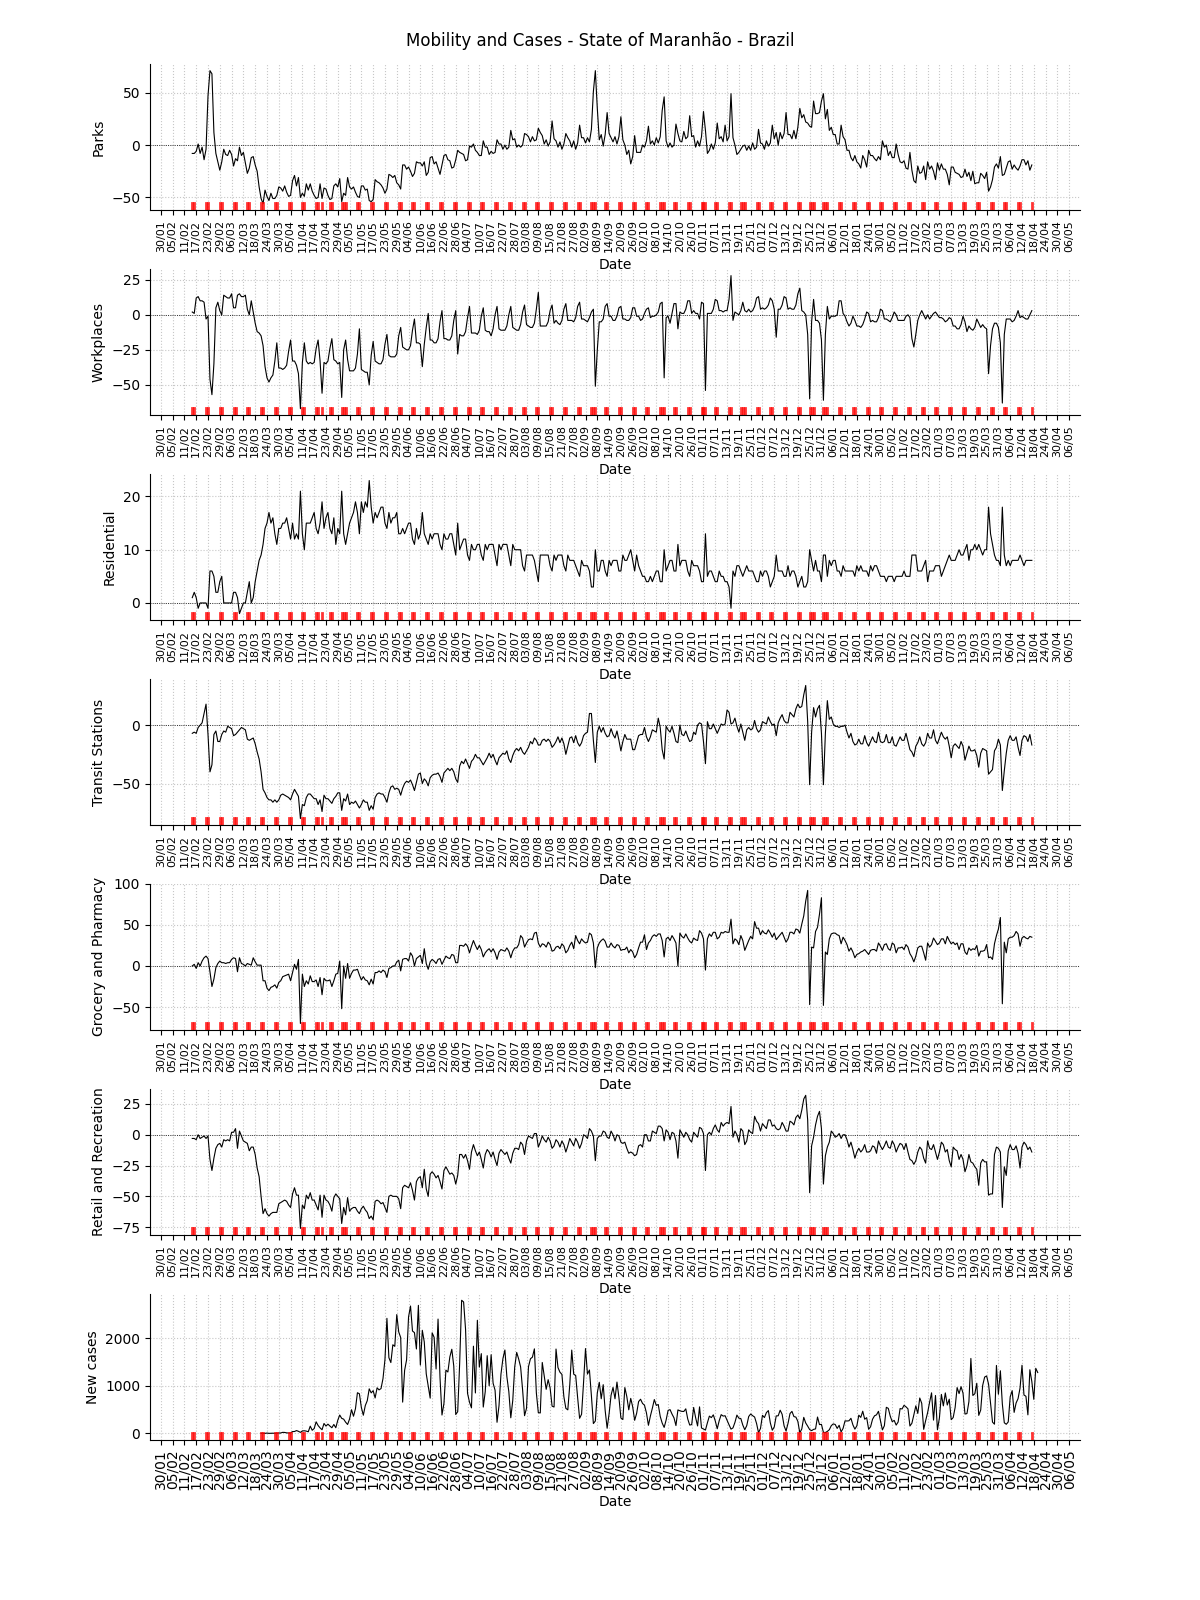
State: Maranhão / MA
R(t) estimate, incidence and accumulated cases
![]()

Facebook mobility trend data for the state
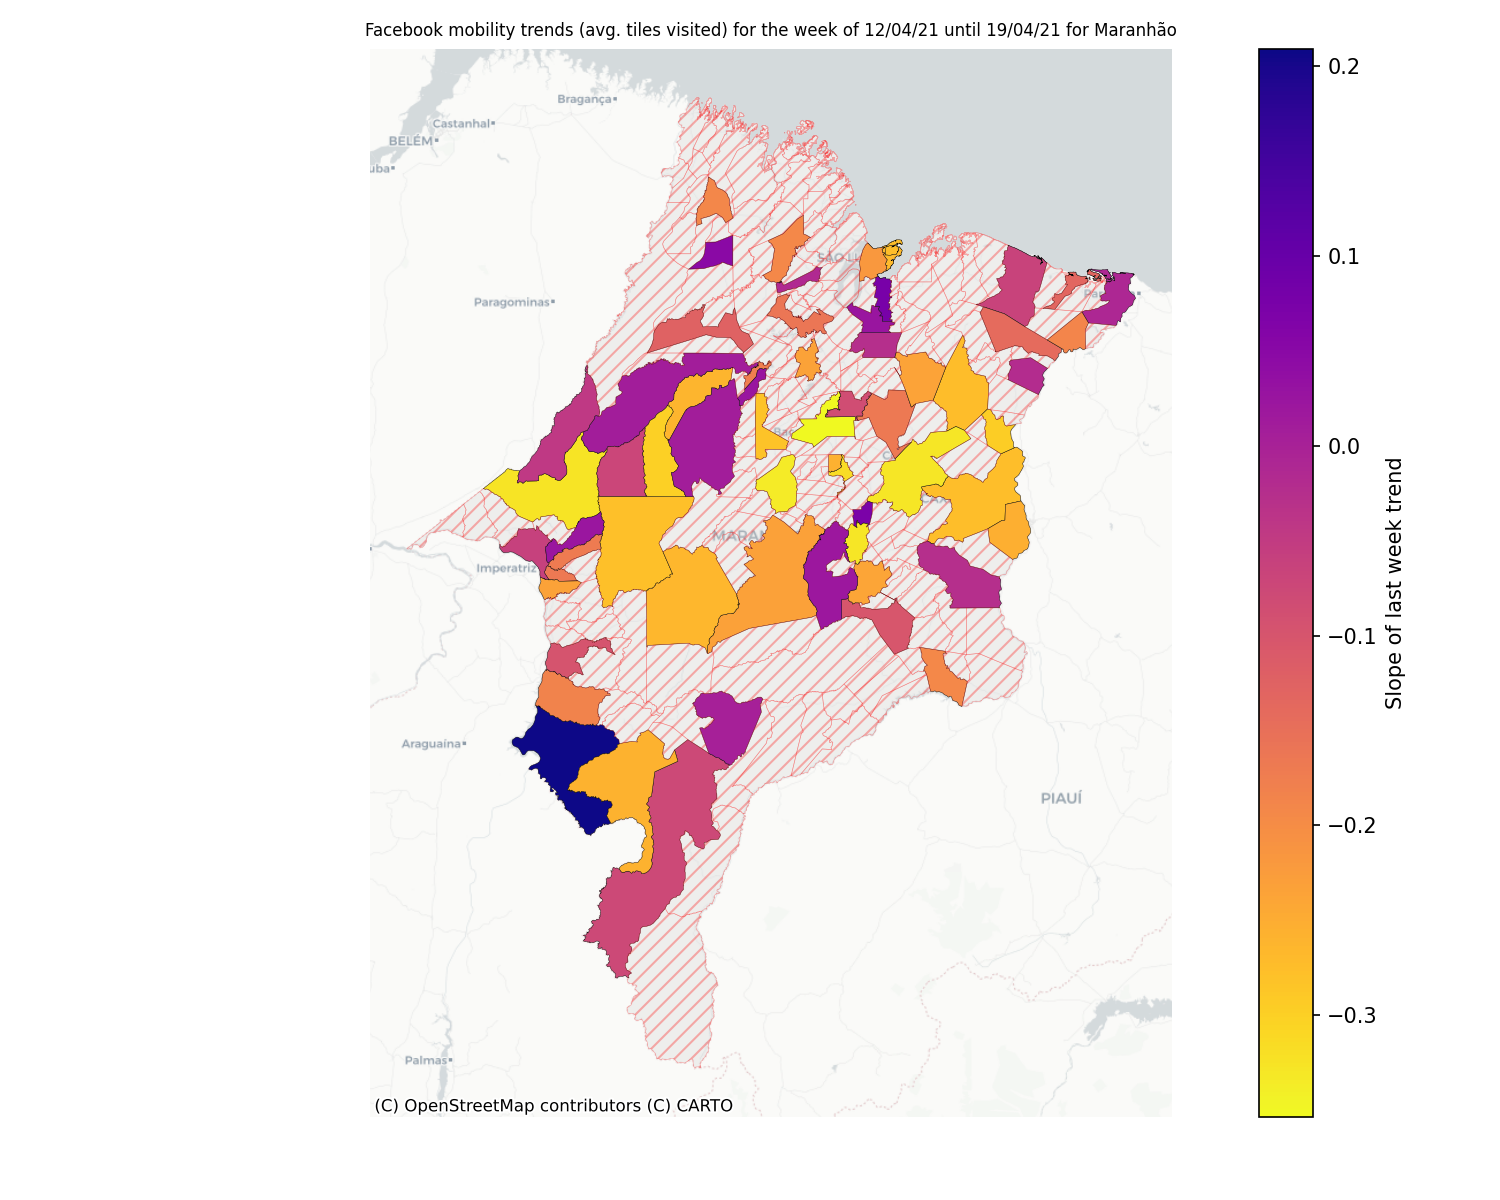
Note
This plot uses official data from Facebook mobility data. This data is released with a Creative Commons Attribution International license.
Mobility data for the state
Facebook symptom survey for the state
Note
This plot uses official data from Brazilian government as well as mobility data from Google Community Mobility Reports. The red markers on the x-axis are weekends or holidays. This plot also uses data from the Facebook Symptom survey data kindly hosted by University of Maryland.
State: Minas Gerais / MG
R(t) estimate, incidence and accumulated cases
![]()
Facebook mobility trend data for the state

Note
This plot uses official data from Facebook mobility data. This data is released with a Creative Commons Attribution International license.
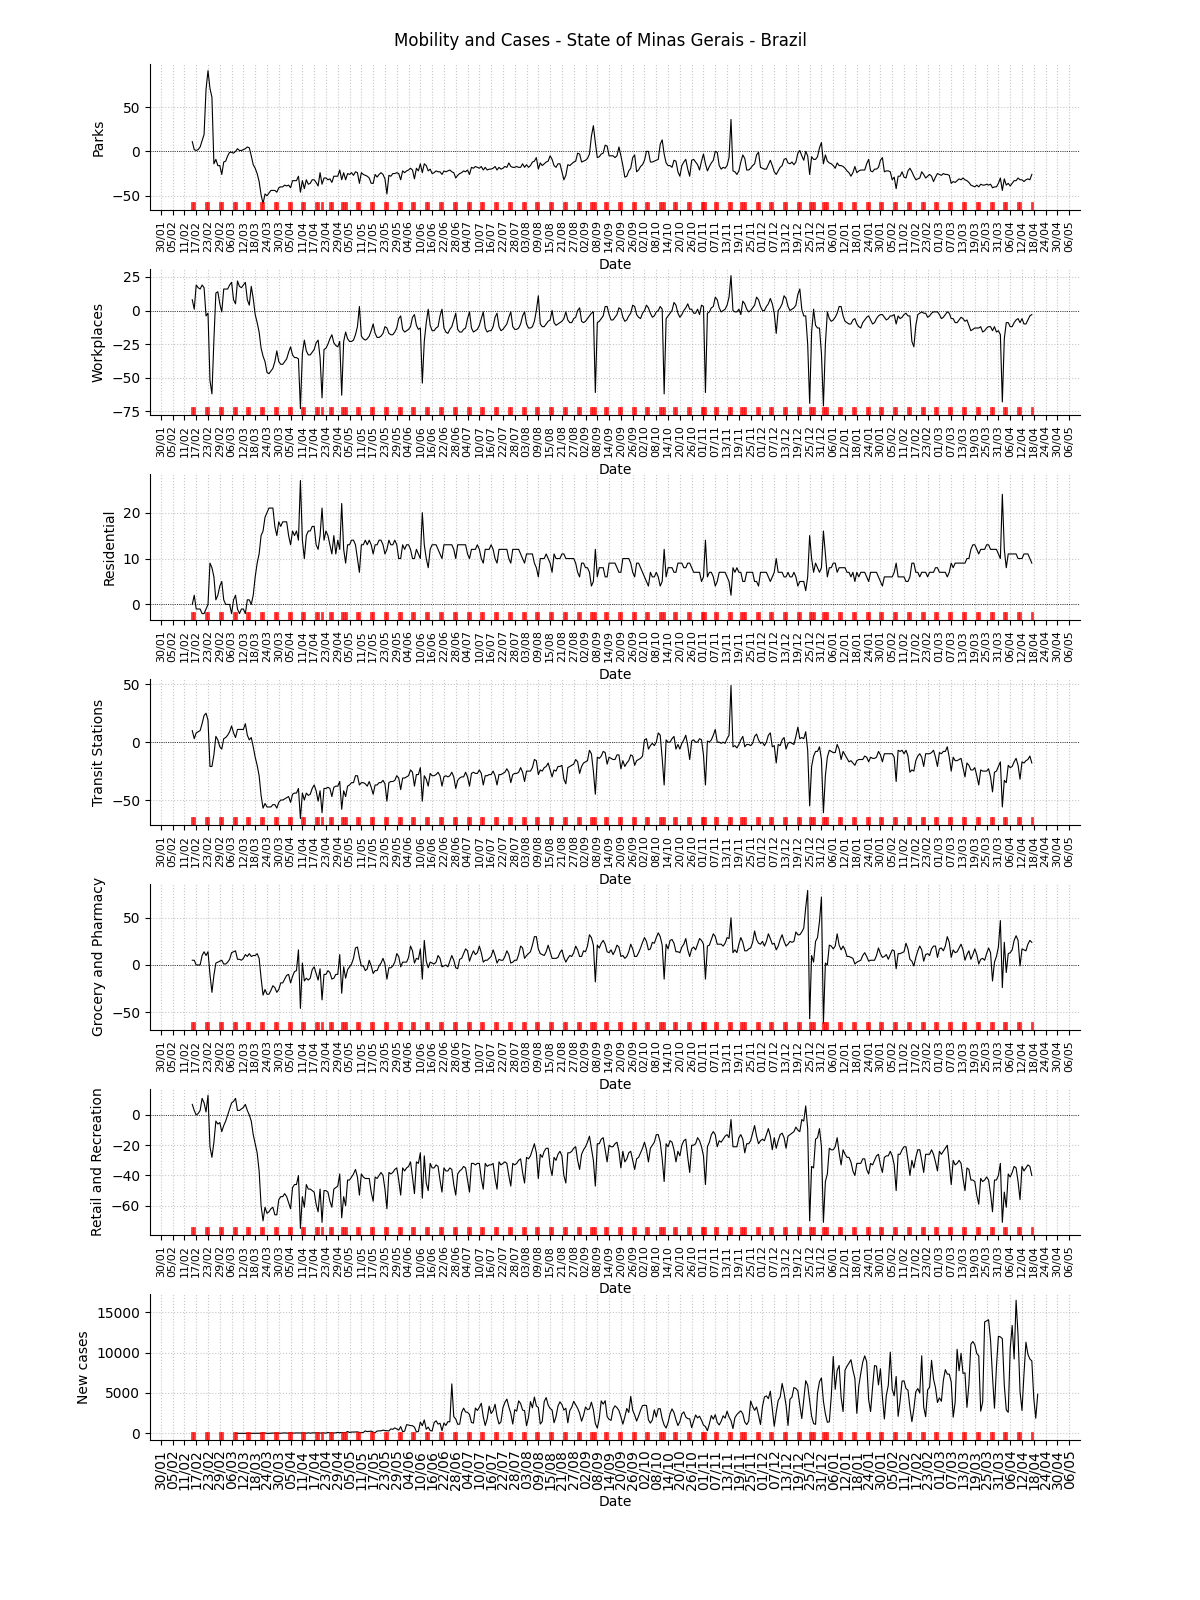
Mobility data for the state
Facebook symptom survey for the state

Note
This plot uses official data from Brazilian government as well as mobility data from Google Community Mobility Reports. The red markers on the x-axis are weekends or holidays. This plot also uses data from the Facebook Symptom survey data kindly hosted by University of Maryland.
State: Mato Grosso do Sul / MS
R(t) estimate, incidence and accumulated cases
![]()
Facebook mobility trend data for the state
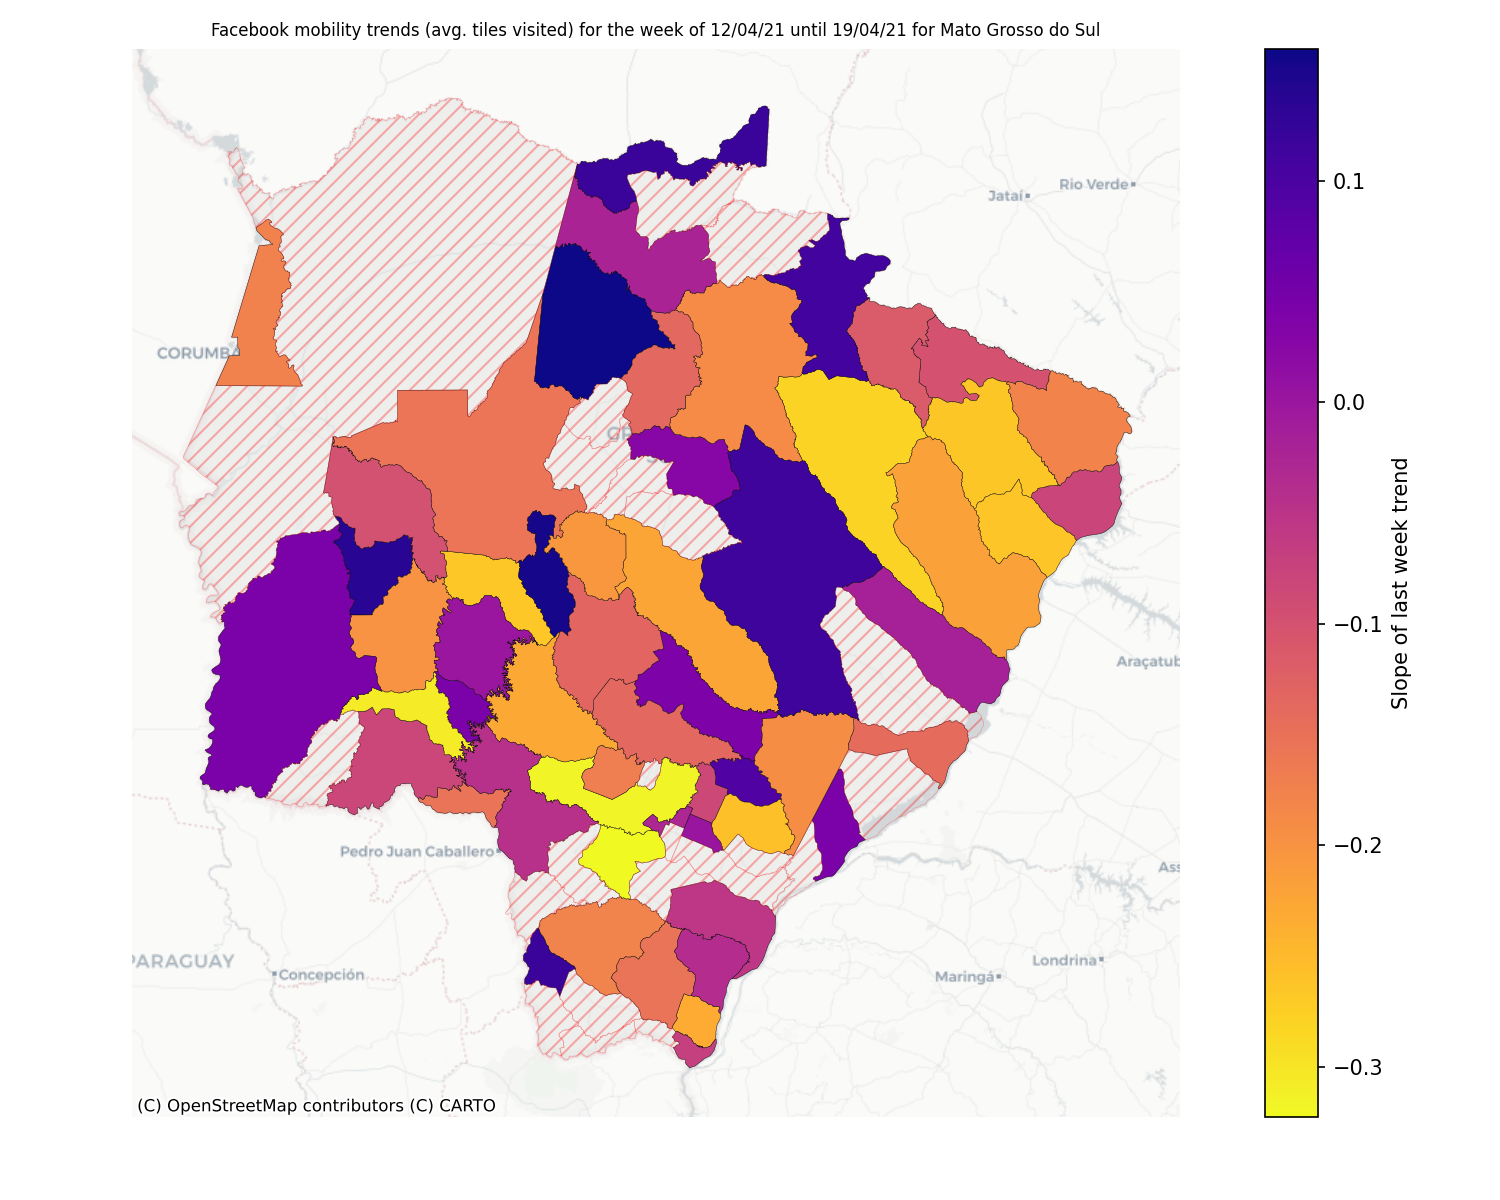
Note
This plot uses official data from Facebook mobility data. This data is released with a Creative Commons Attribution International license.
Mobility data for the state
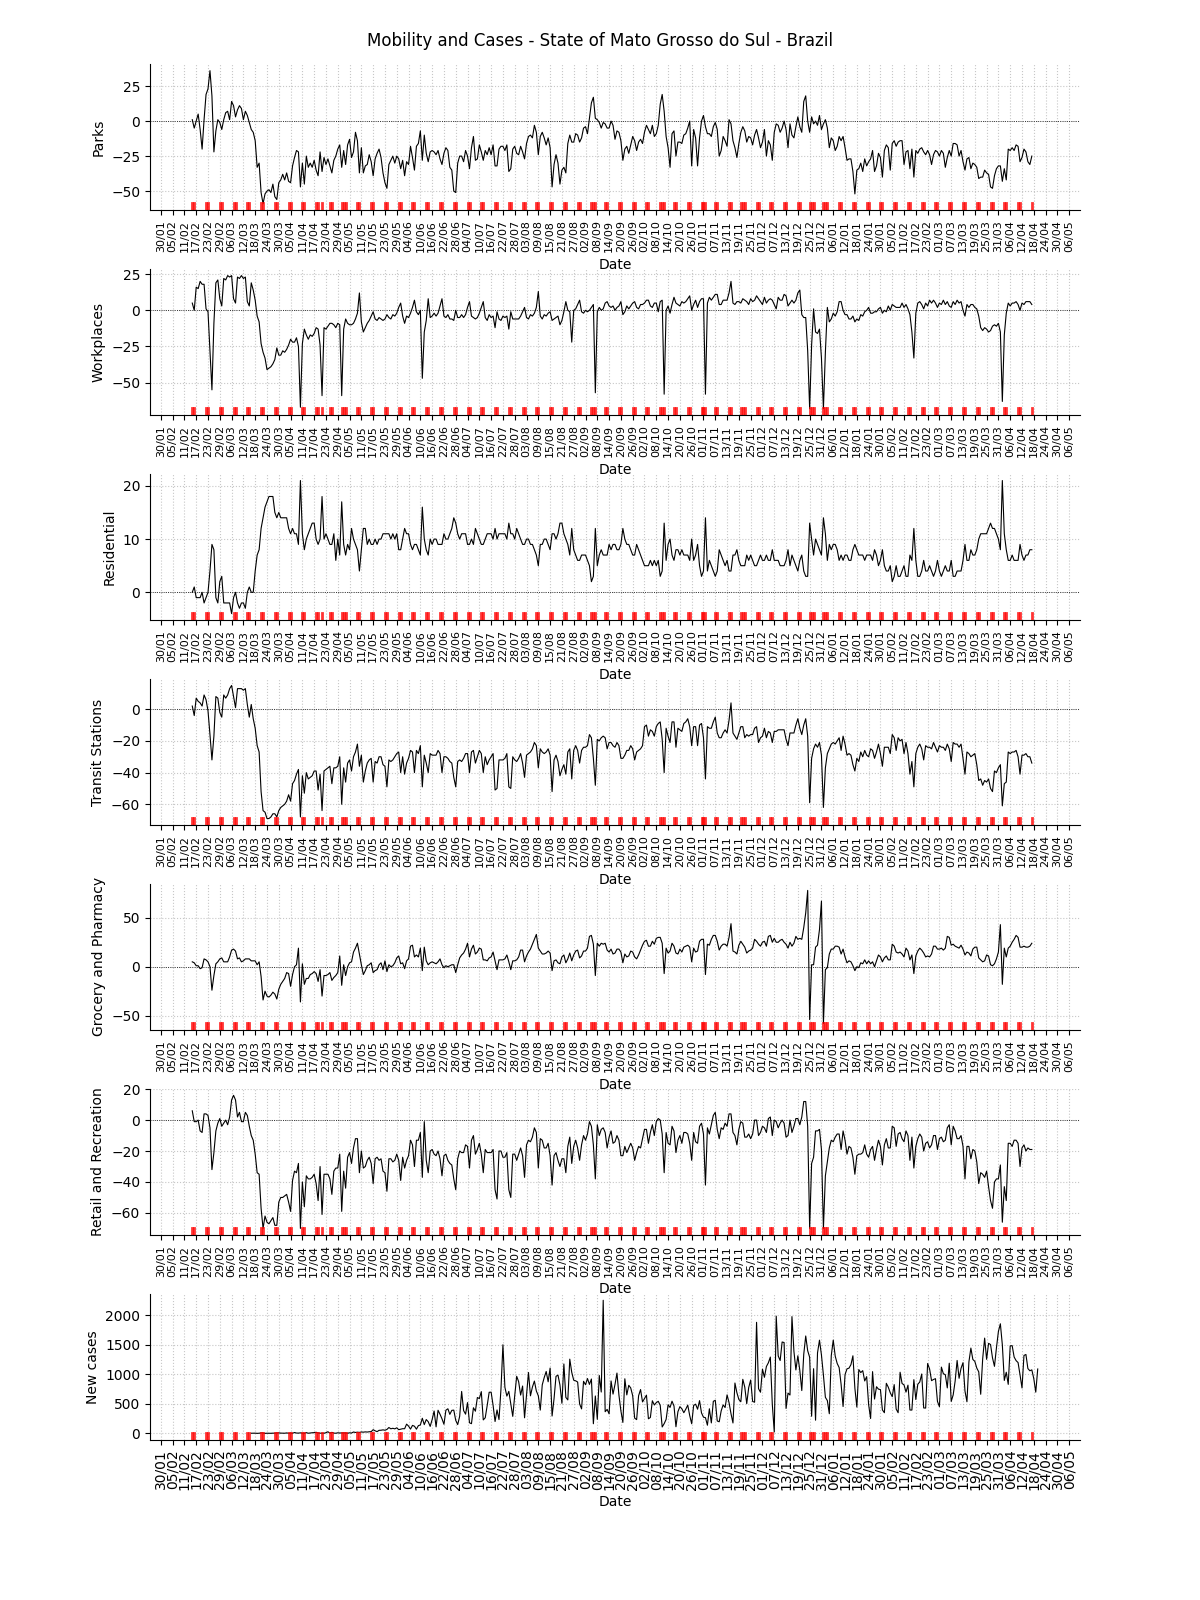
Facebook symptom survey for the state
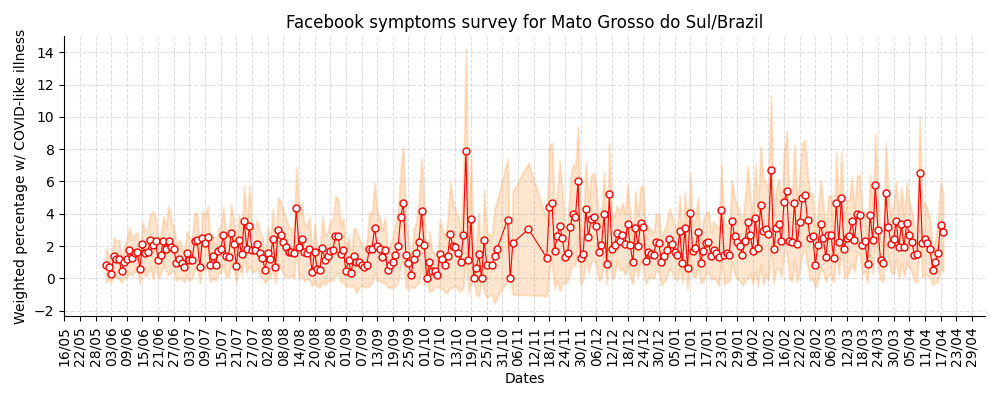
Note
This plot uses official data from Brazilian government as well as mobility data from Google Community Mobility Reports. The red markers on the x-axis are weekends or holidays. This plot also uses data from the Facebook Symptom survey data kindly hosted by University of Maryland.
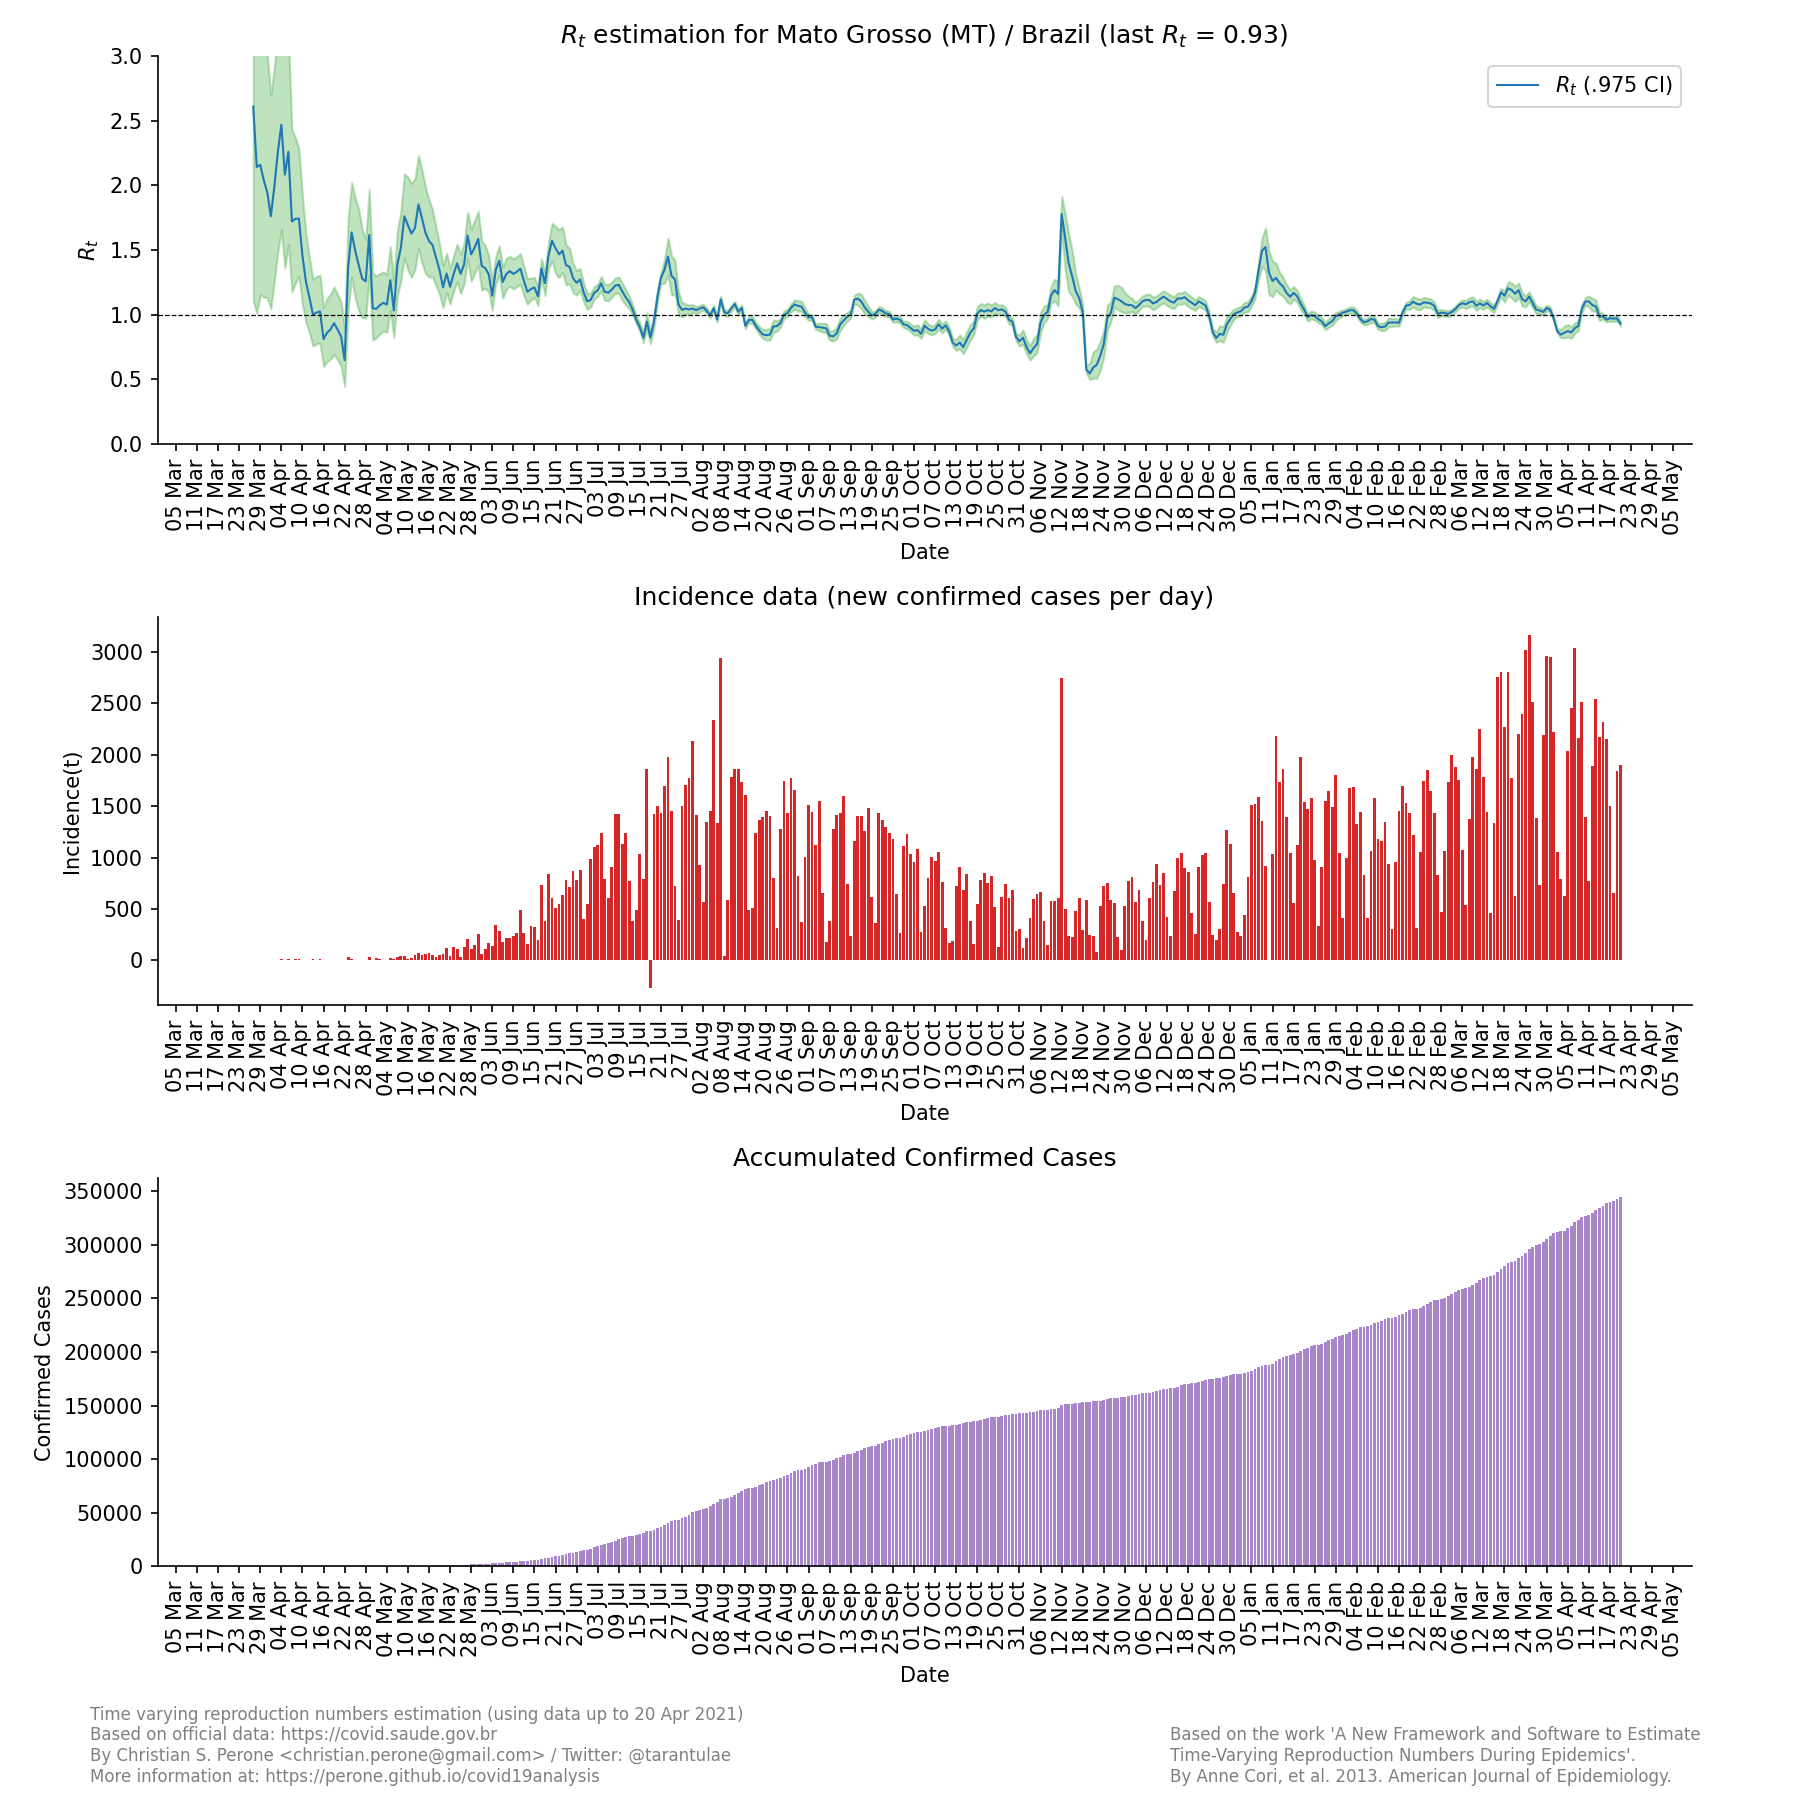
State: Mato Grosso / MT
R(t) estimate, incidence and accumulated cases
![]()
Facebook mobility trend data for the state
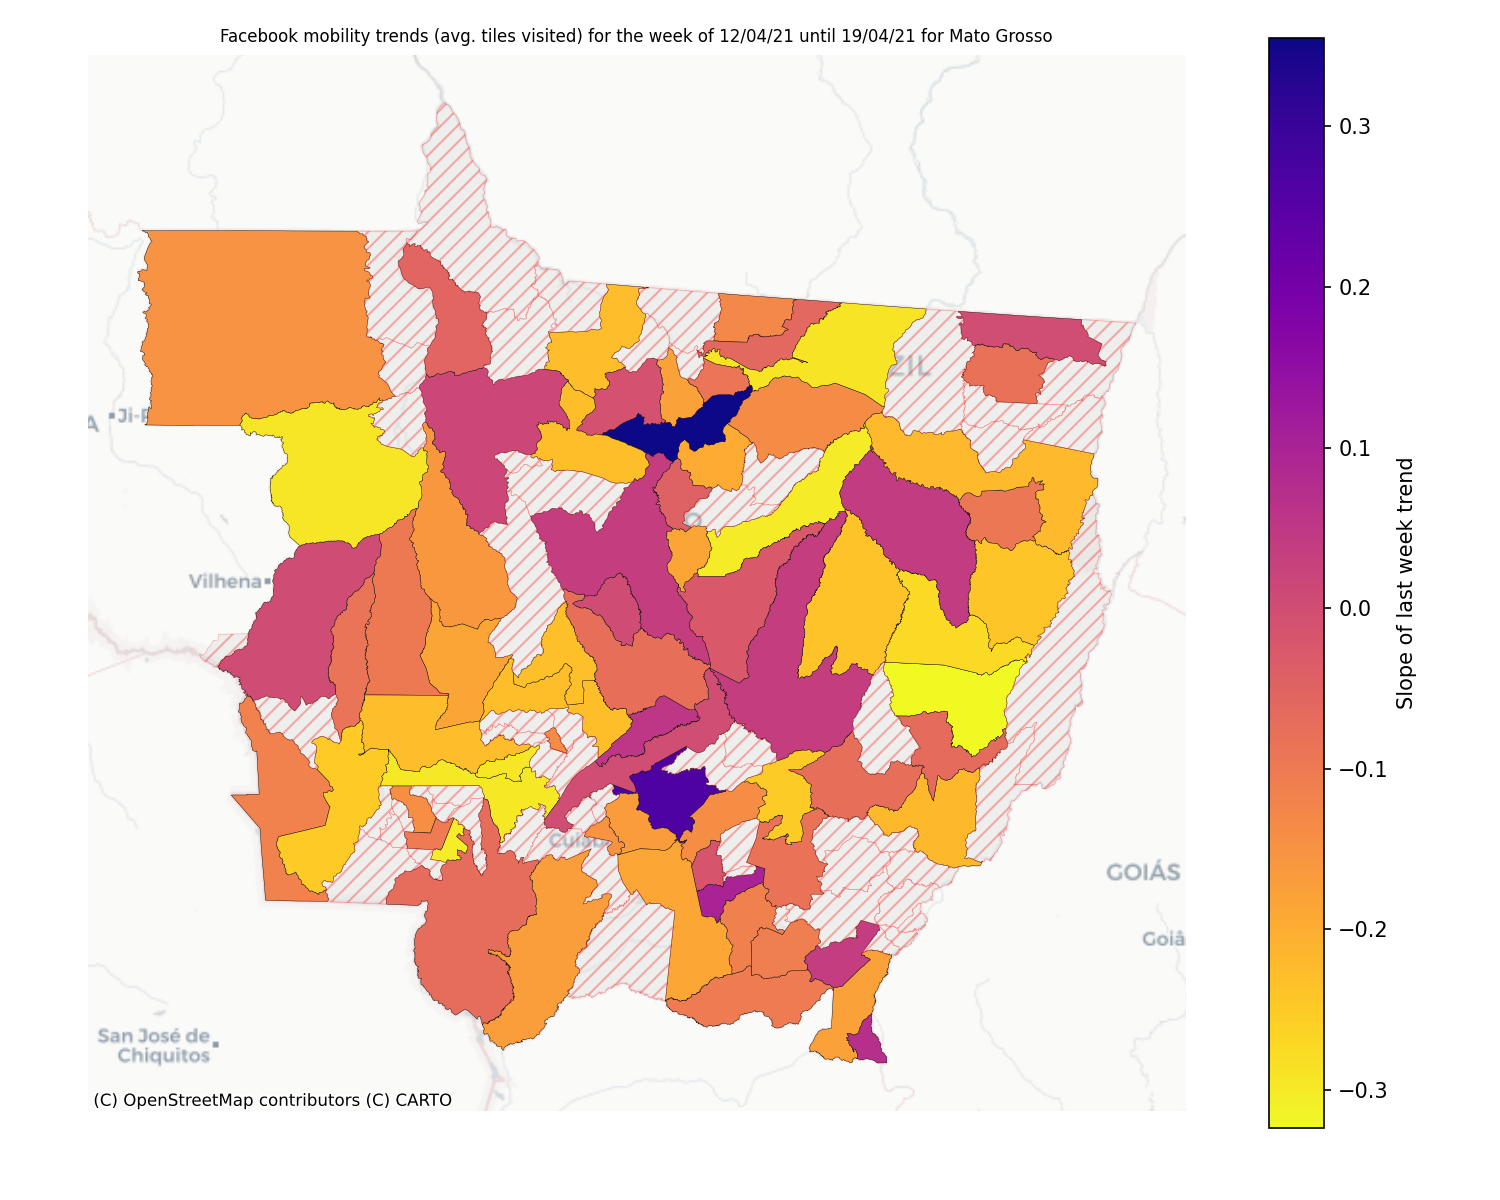
Note
This plot uses official data from Facebook mobility data. This data is released with a Creative Commons Attribution International license.
Mobility data for the state
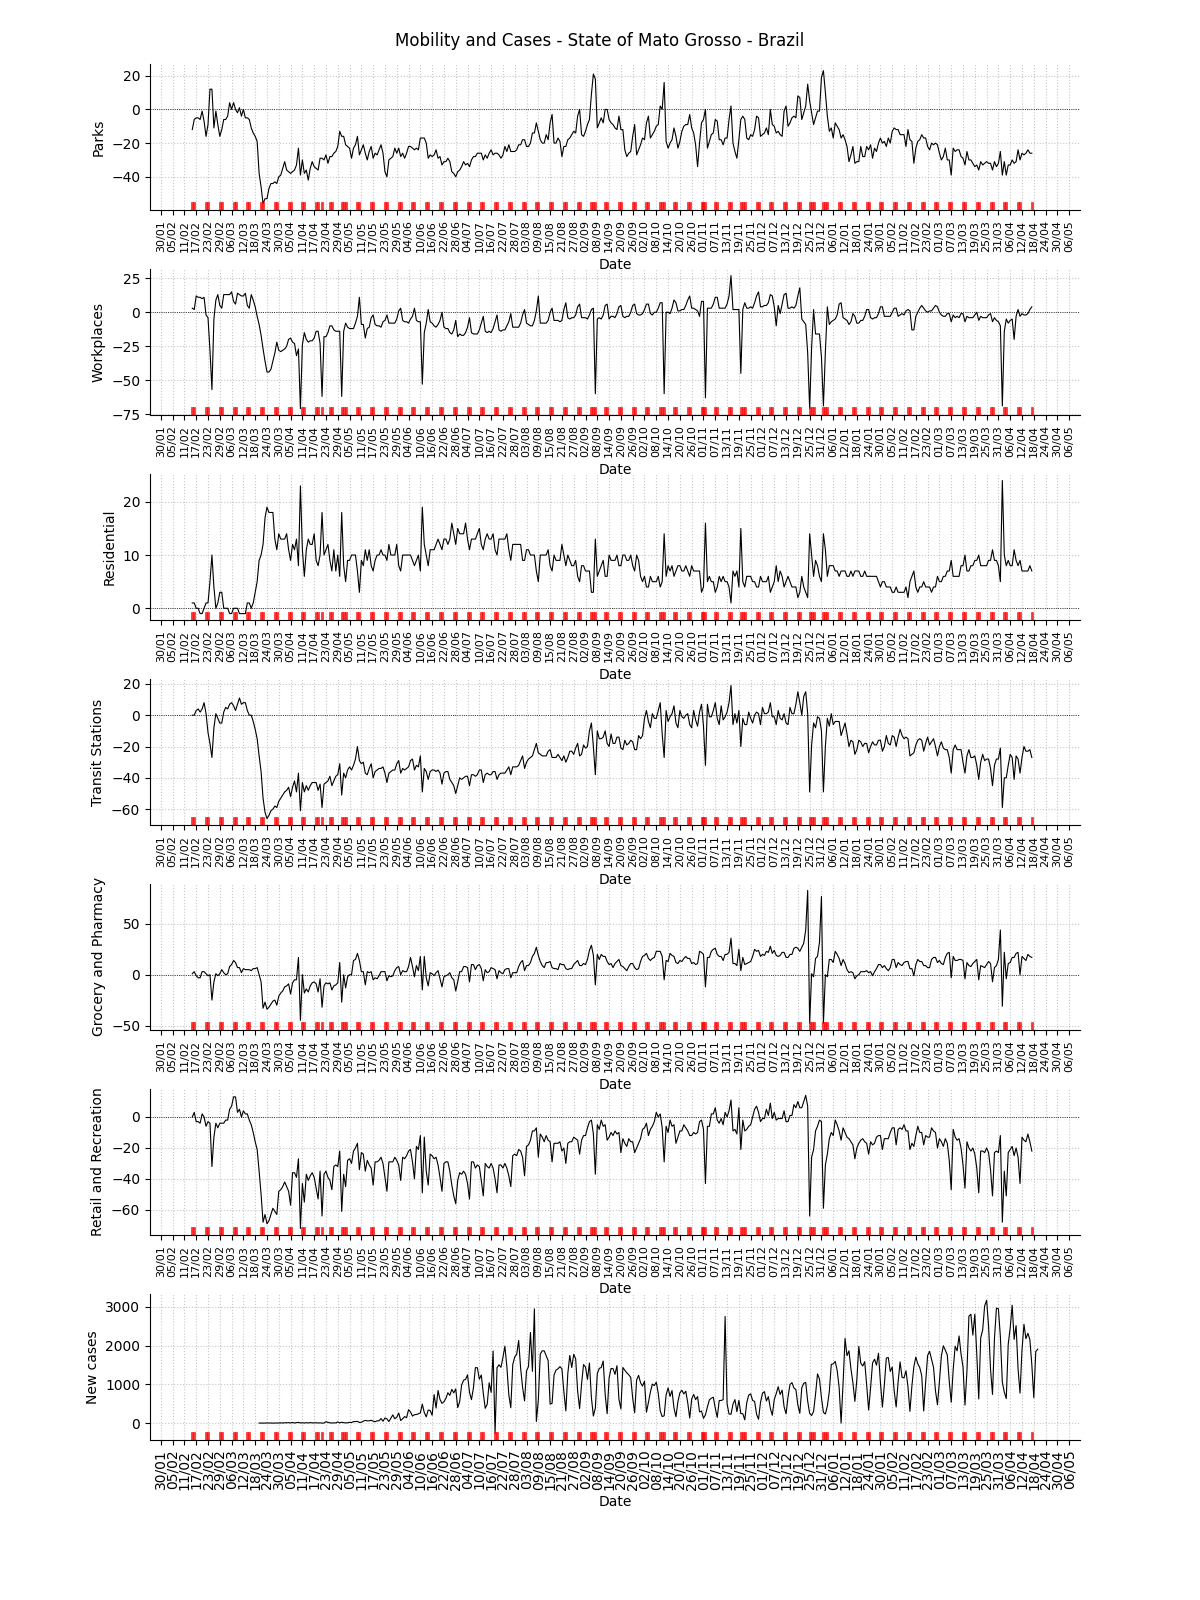
Facebook symptom survey for the state

Note
This plot uses official data from Brazilian government as well as mobility data from Google Community Mobility Reports. The red markers on the x-axis are weekends or holidays. This plot also uses data from the Facebook Symptom survey data kindly hosted by University of Maryland.
State: Pará / PA
R(t) estimate, incidence and accumulated cases
![]()
Facebook mobility trend data for the state
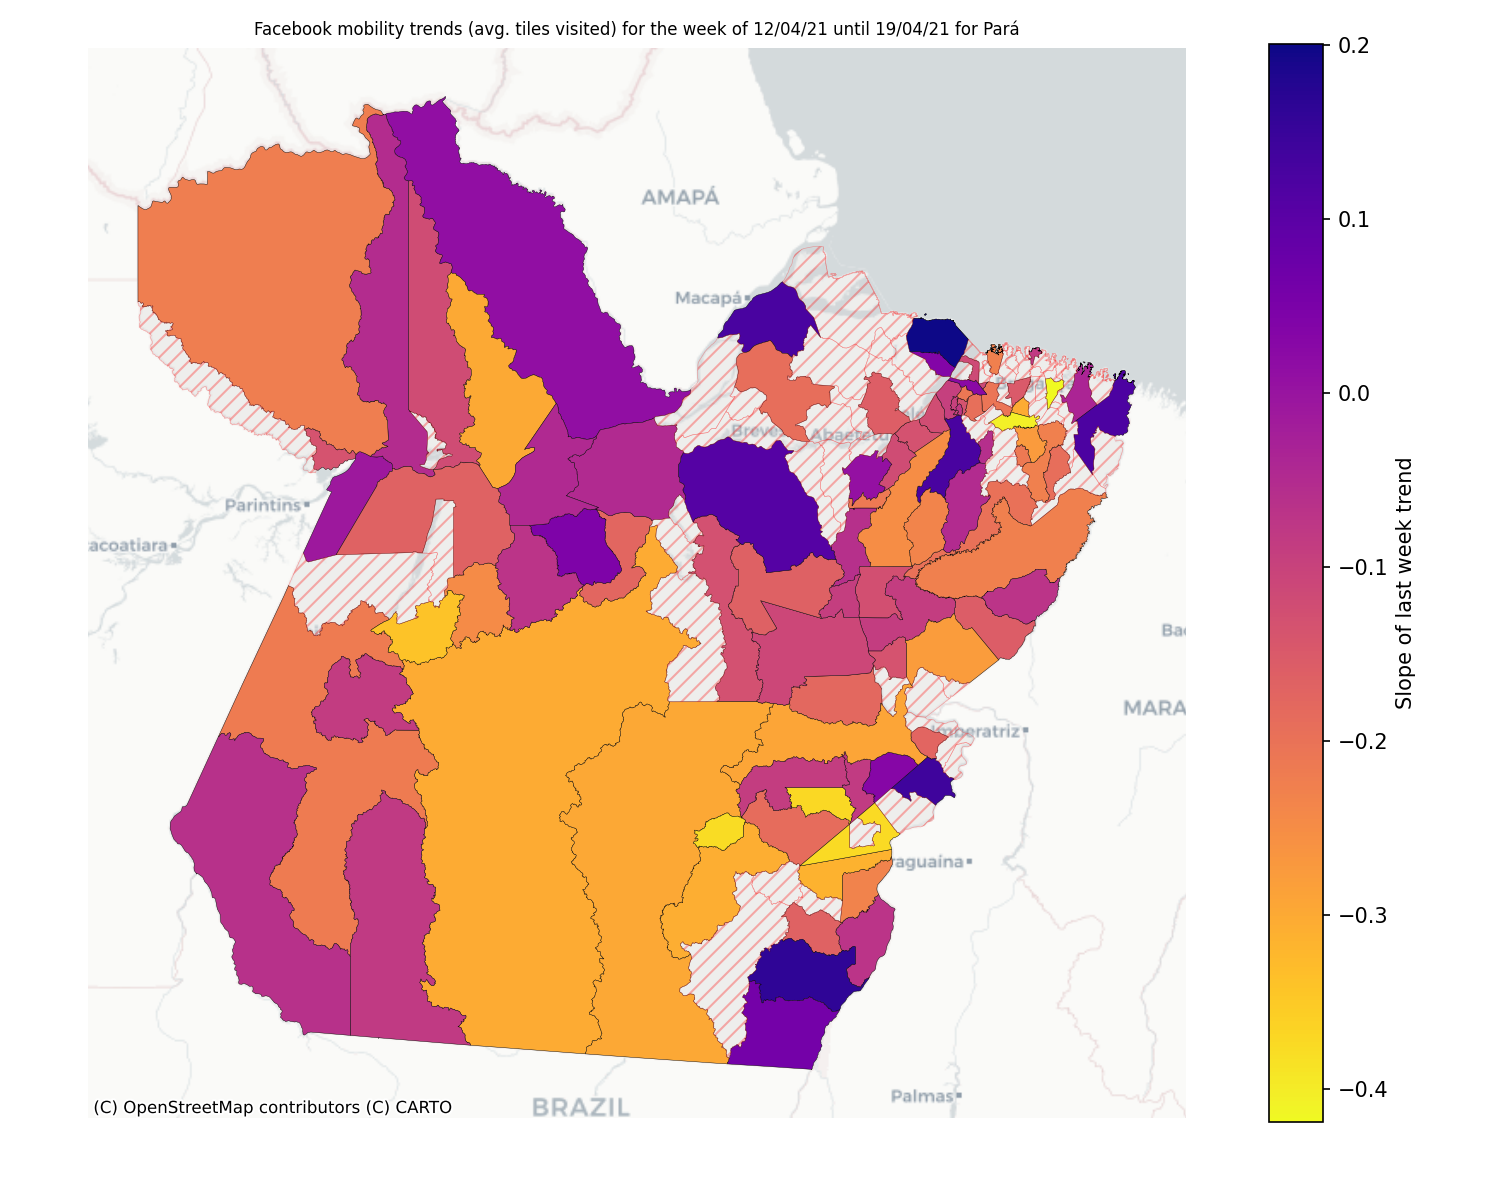
Note
This plot uses official data from Facebook mobility data. This data is released with a Creative Commons Attribution International license.
Mobility data for the state
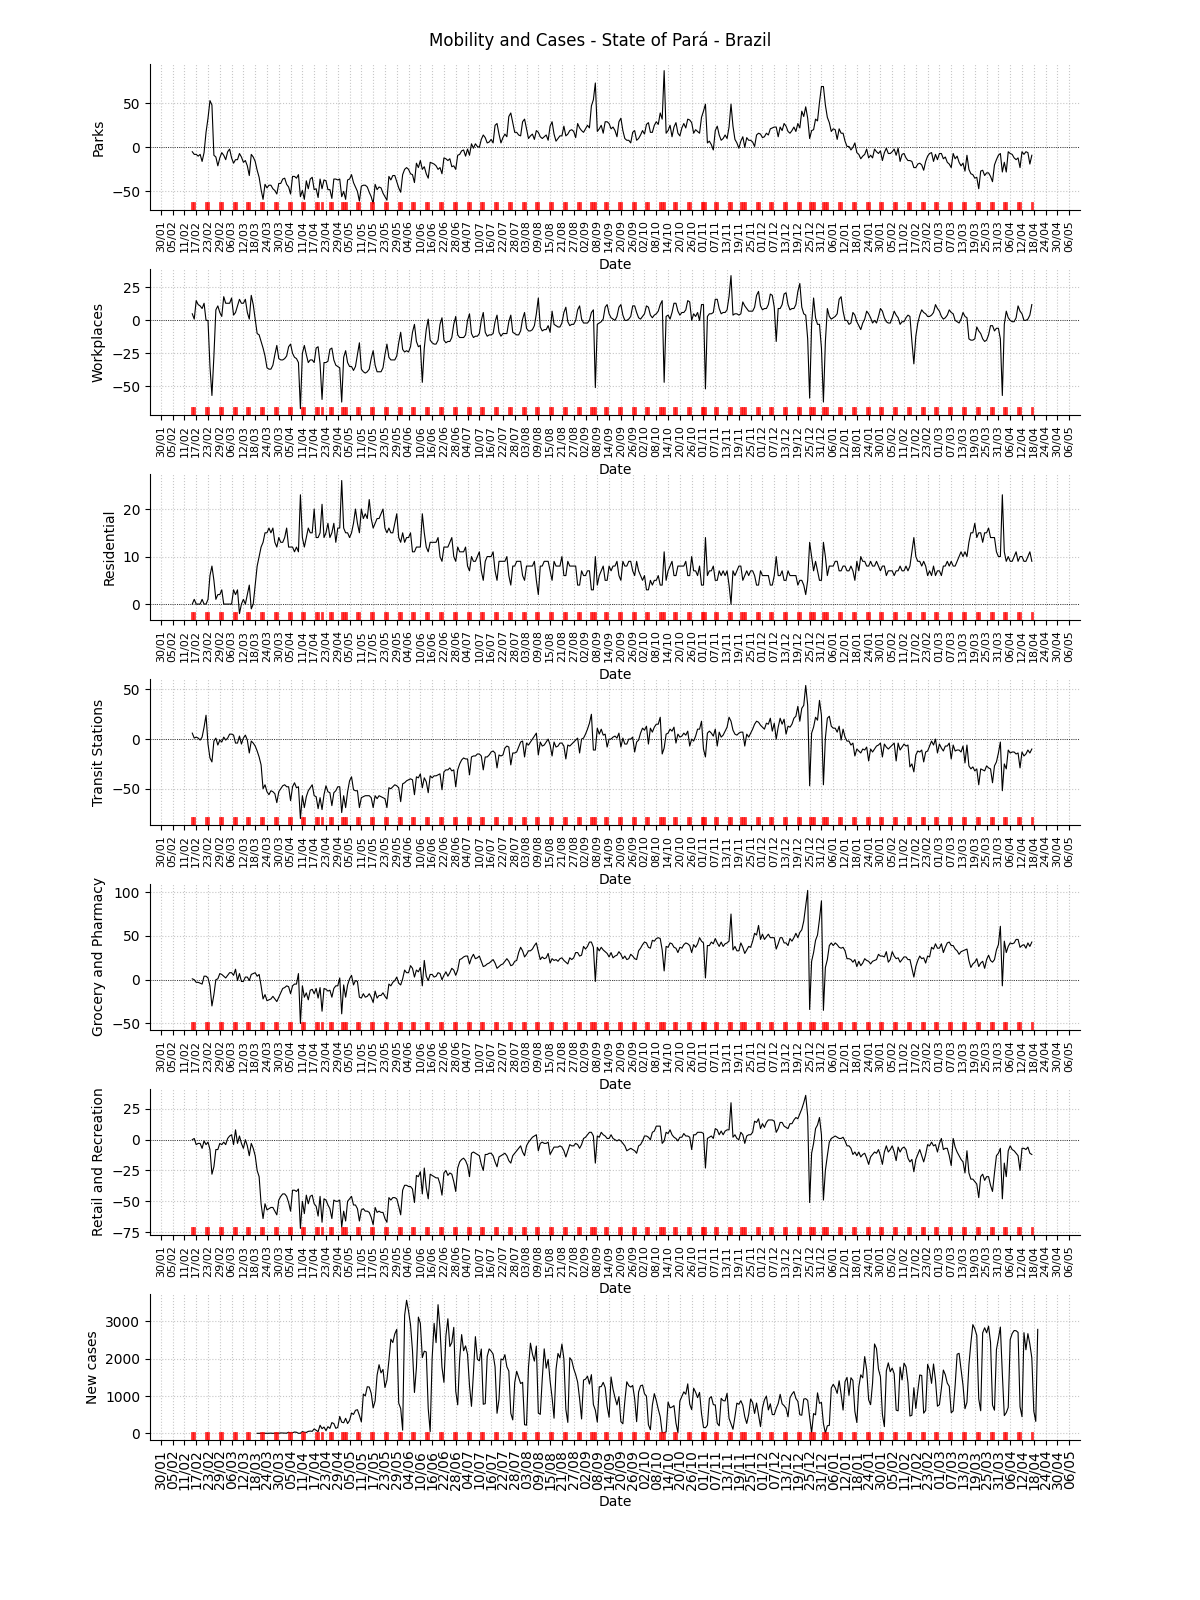
Facebook symptom survey for the state
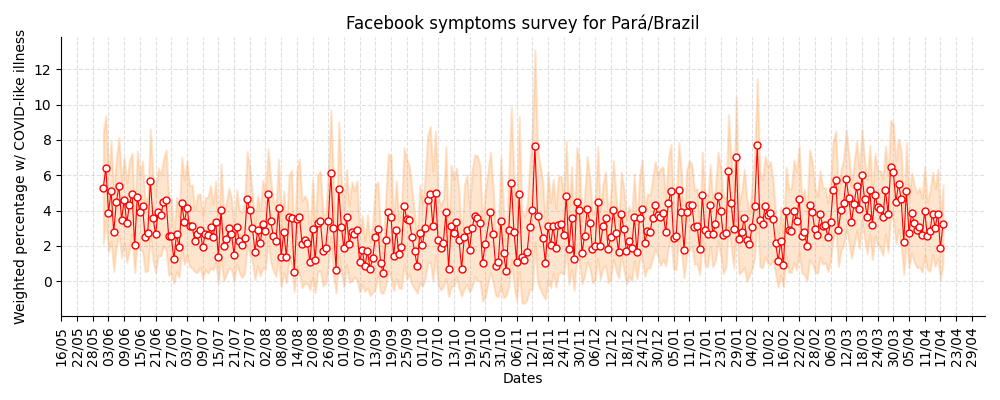
Note
This plot uses official data from Brazilian government as well as mobility data from Google Community Mobility Reports. The red markers on the x-axis are weekends or holidays. This plot also uses data from the Facebook Symptom survey data kindly hosted by University of Maryland.
State: Paraíba / PB
R(t) estimate, incidence and accumulated cases
![]()

Facebook mobility trend data for the state
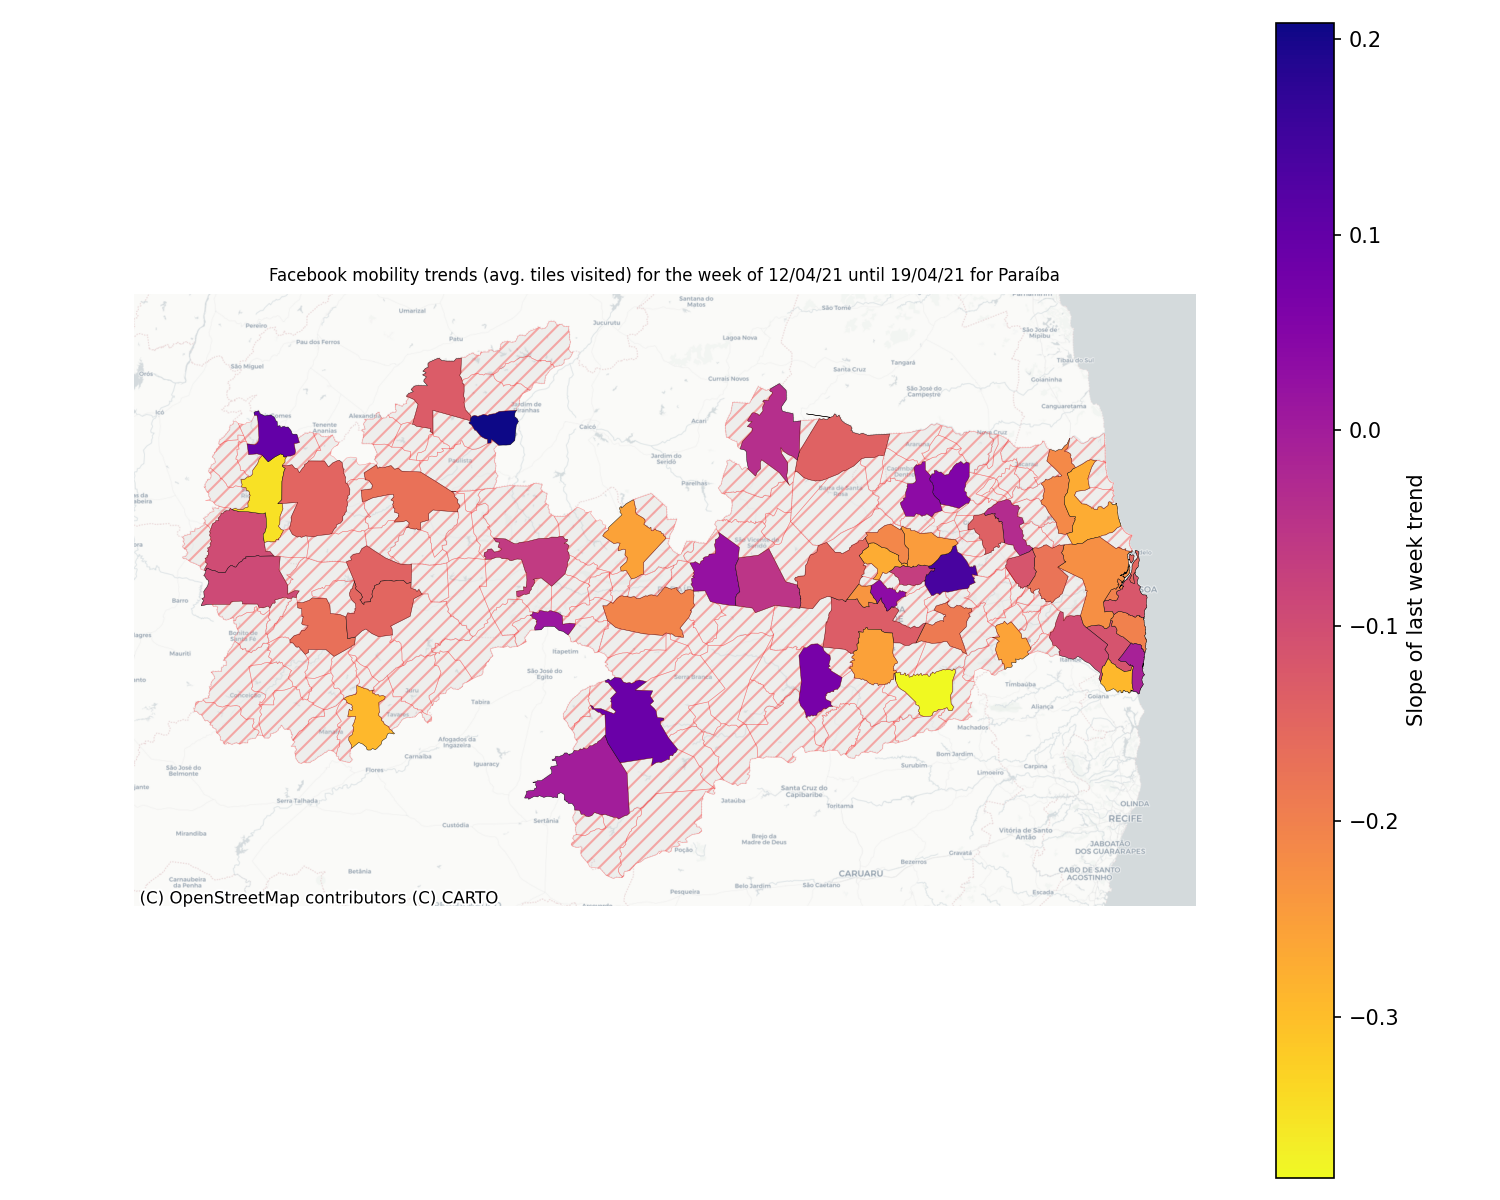
Note
This plot uses official data from Facebook mobility data. This data is released with a Creative Commons Attribution International license.
Mobility data for the state
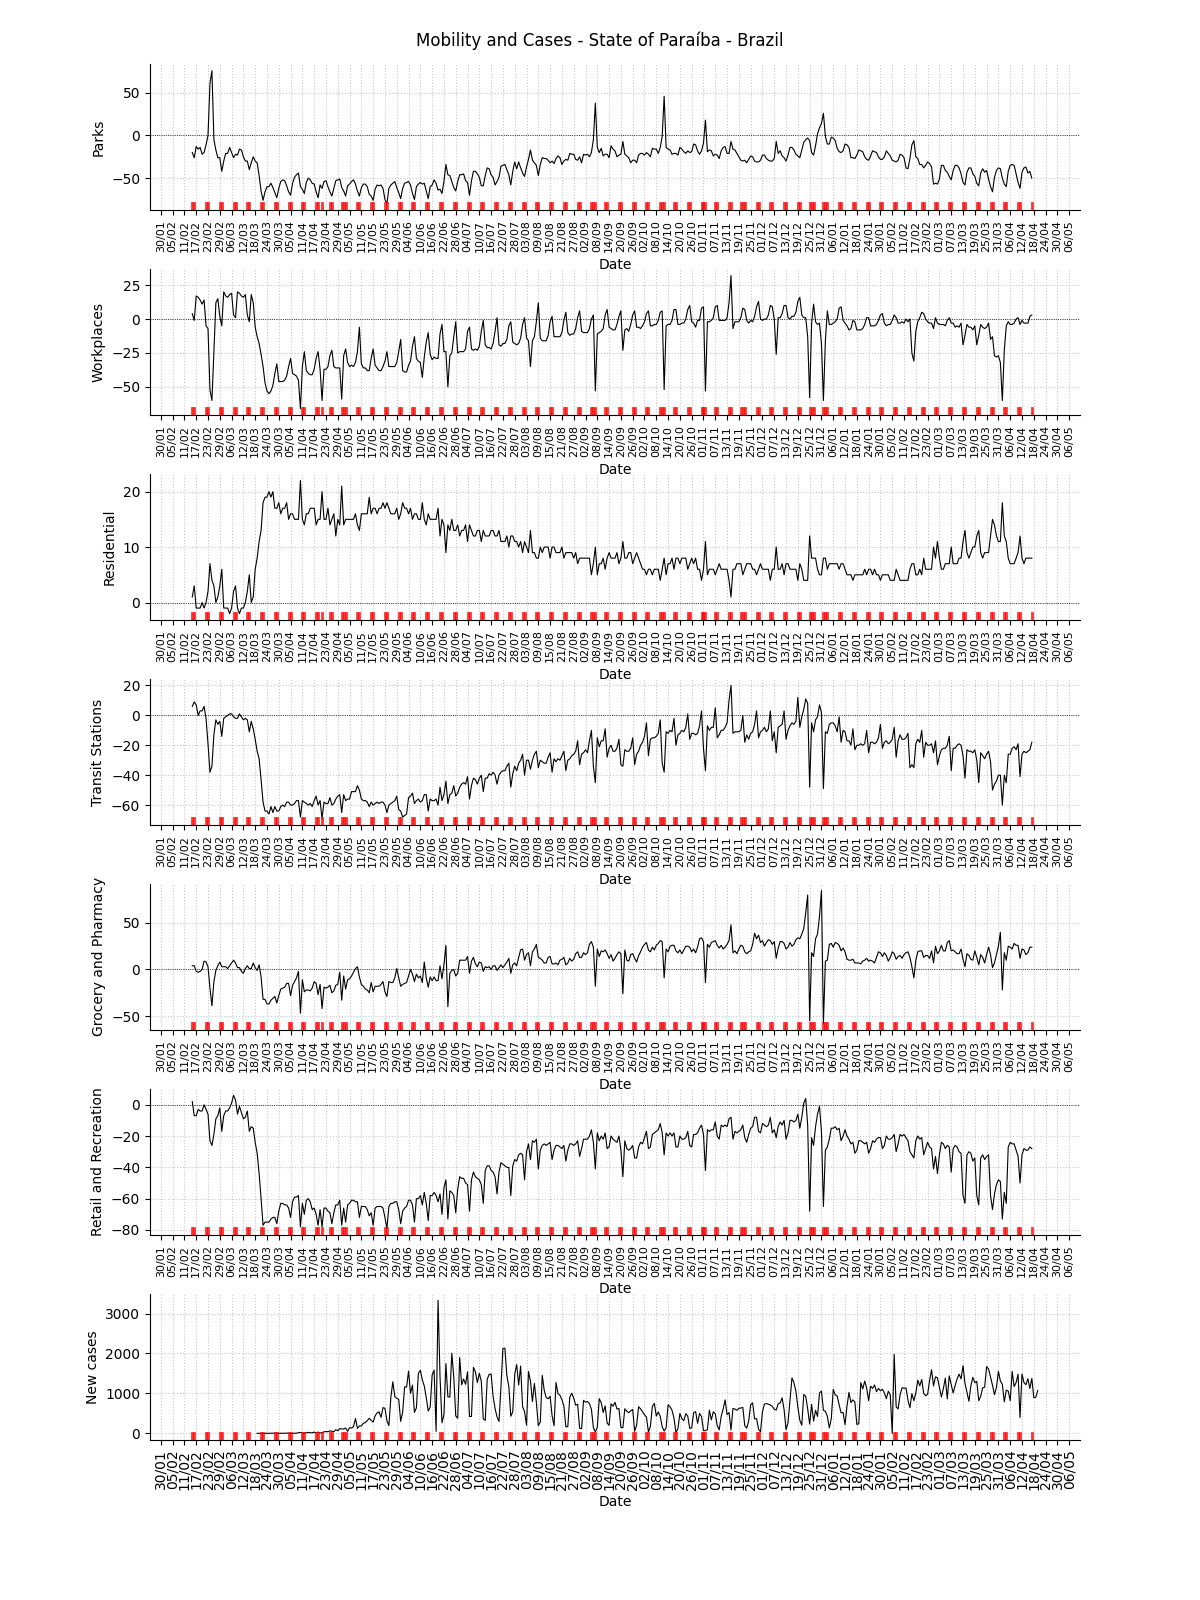
Facebook symptom survey for the state
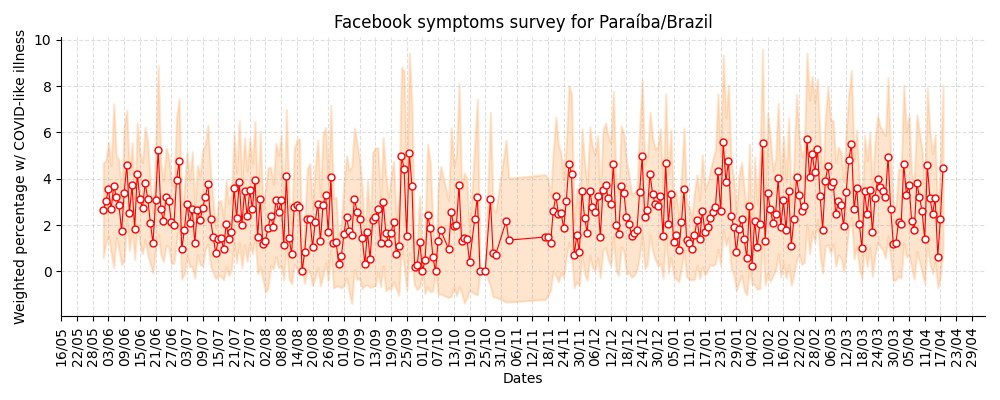
Note
This plot uses official data from Brazilian government as well as mobility data from Google Community Mobility Reports. The red markers on the x-axis are weekends or holidays. This plot also uses data from the Facebook Symptom survey data kindly hosted by University of Maryland.
State: Pernambuco / PE
R(t) estimate, incidence and accumulated cases
![]()

Facebook mobility trend data for the state
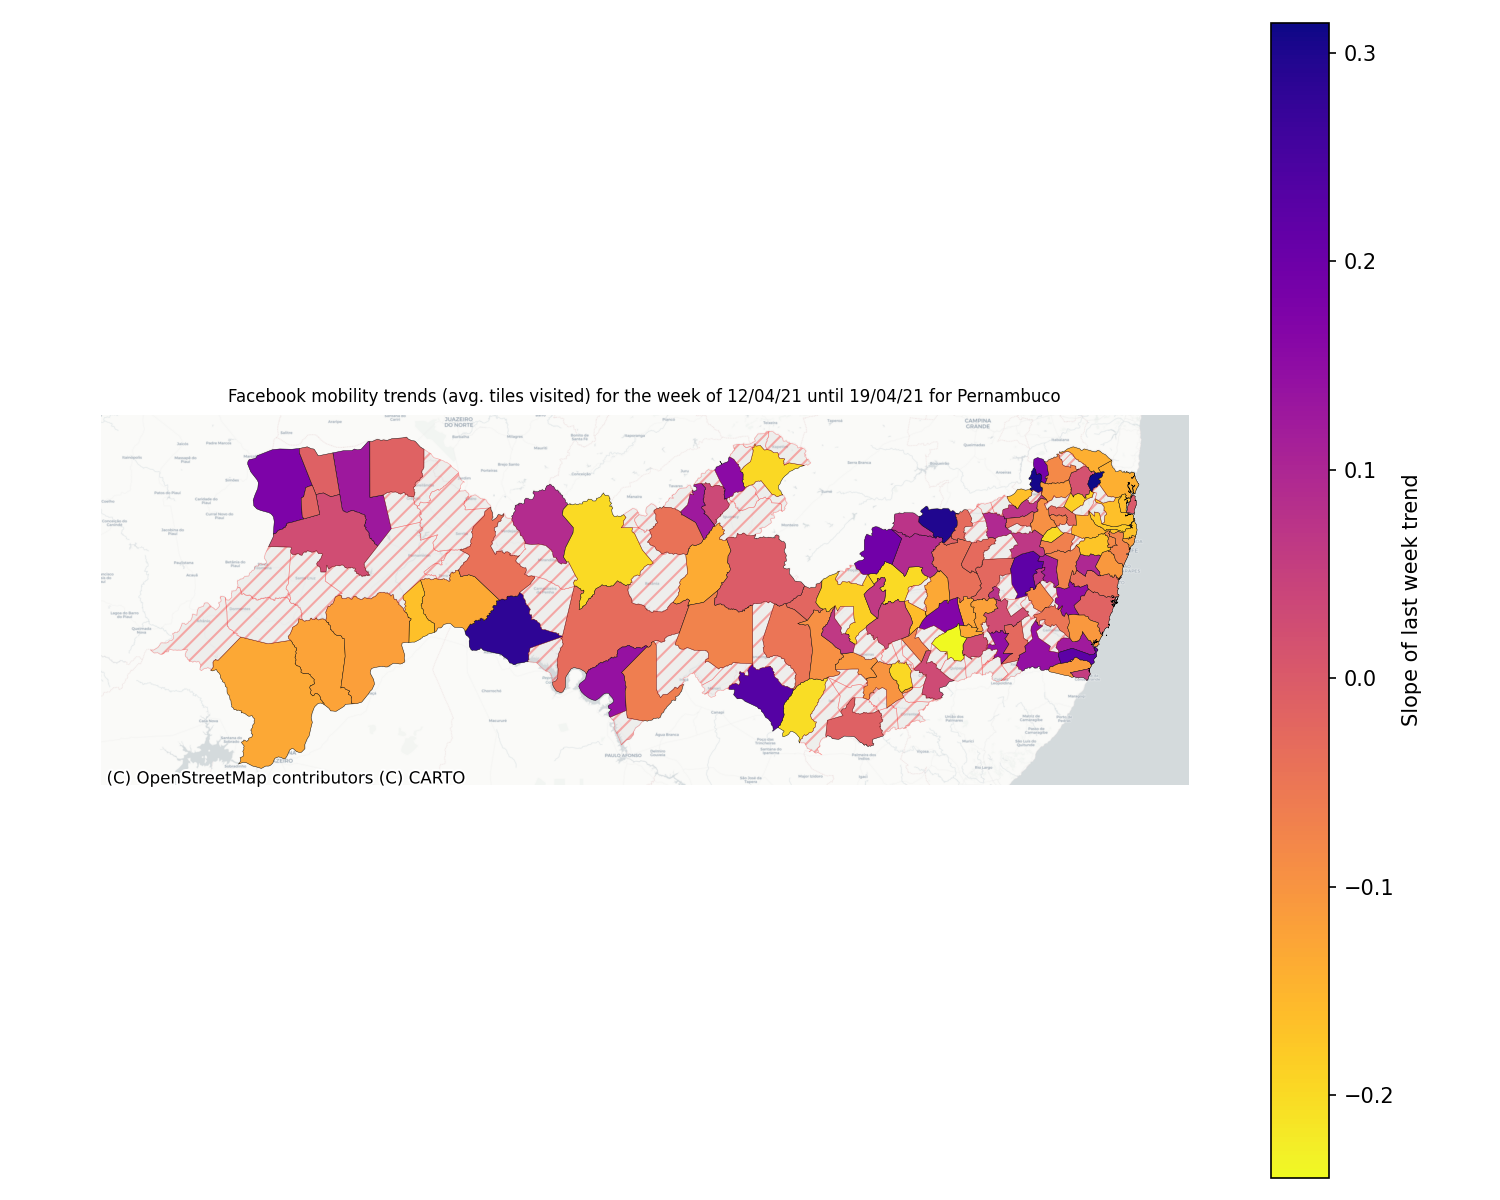
Note
This plot uses official data from Facebook mobility data. This data is released with a Creative Commons Attribution International license.
Mobility data for the state
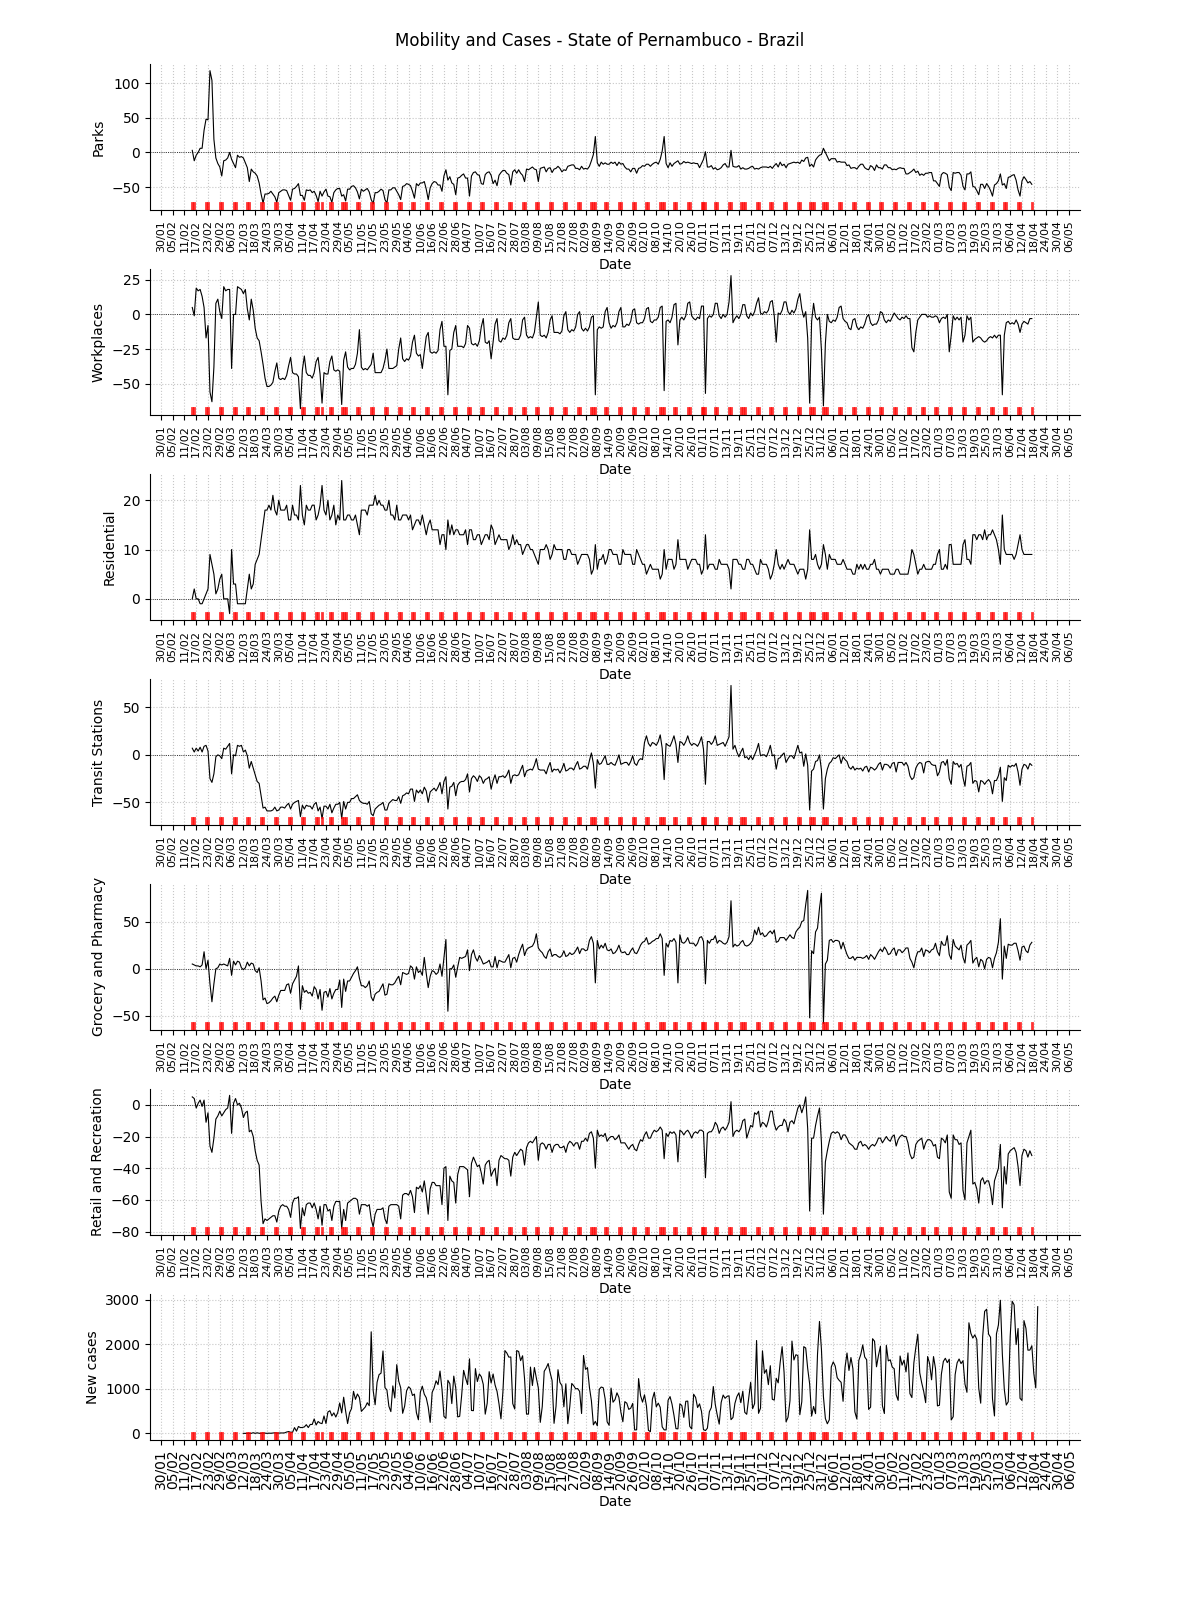
Facebook symptom survey for the state
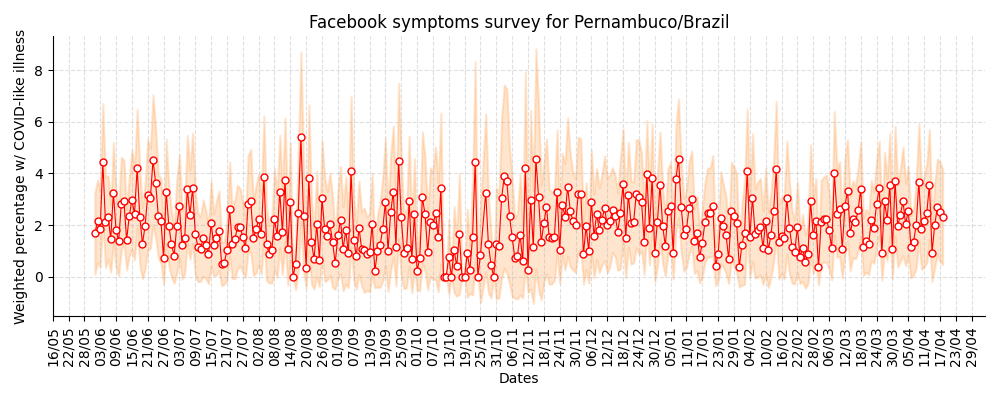
Note
This plot uses official data from Brazilian government as well as mobility data from Google Community Mobility Reports. The red markers on the x-axis are weekends or holidays. This plot also uses data from the Facebook Symptom survey data kindly hosted by University of Maryland.
State: Piauí / PI
R(t) estimate, incidence and accumulated cases
![]()
Facebook mobility trend data for the state

Note
This plot uses official data from Facebook mobility data. This data is released with a Creative Commons Attribution International license.
Mobility data for the state
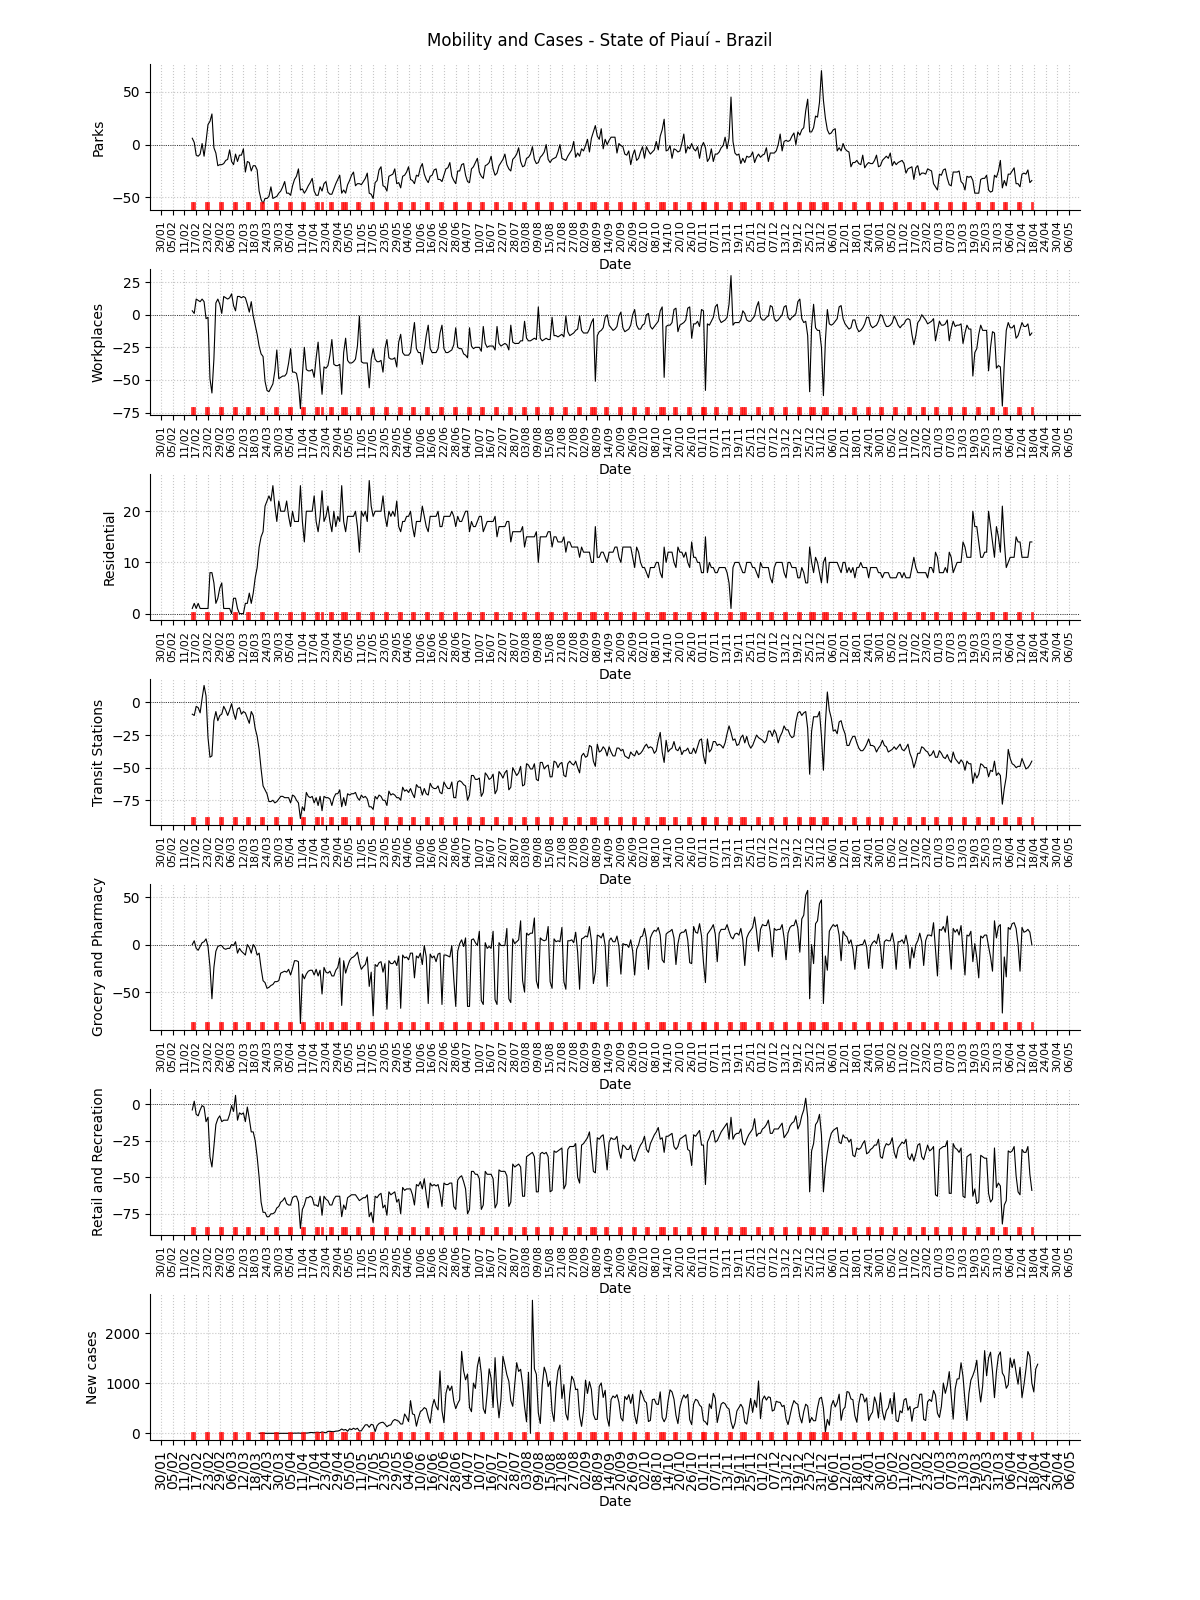
Facebook symptom survey for the state
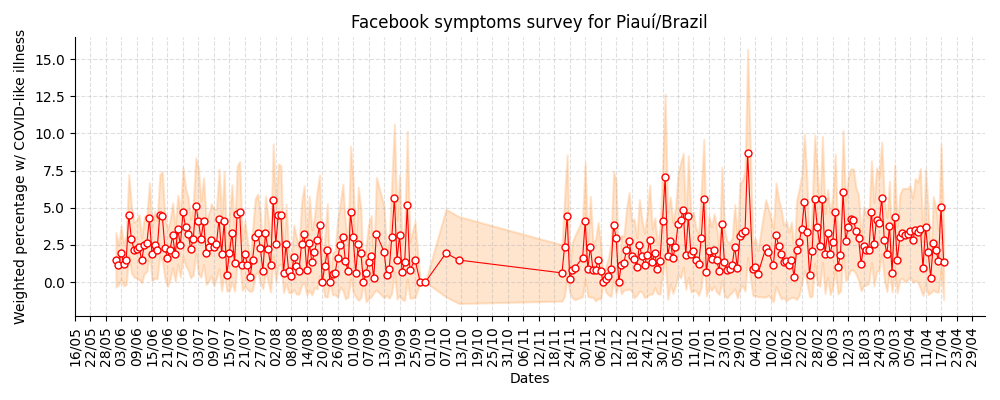
Note
This plot uses official data from Brazilian government as well as mobility data from Google Community Mobility Reports. The red markers on the x-axis are weekends or holidays. This plot also uses data from the Facebook Symptom survey data kindly hosted by University of Maryland.
State: Paraná / PR
R(t) estimate, incidence and accumulated cases
![]()
Facebook mobility trend data for the state
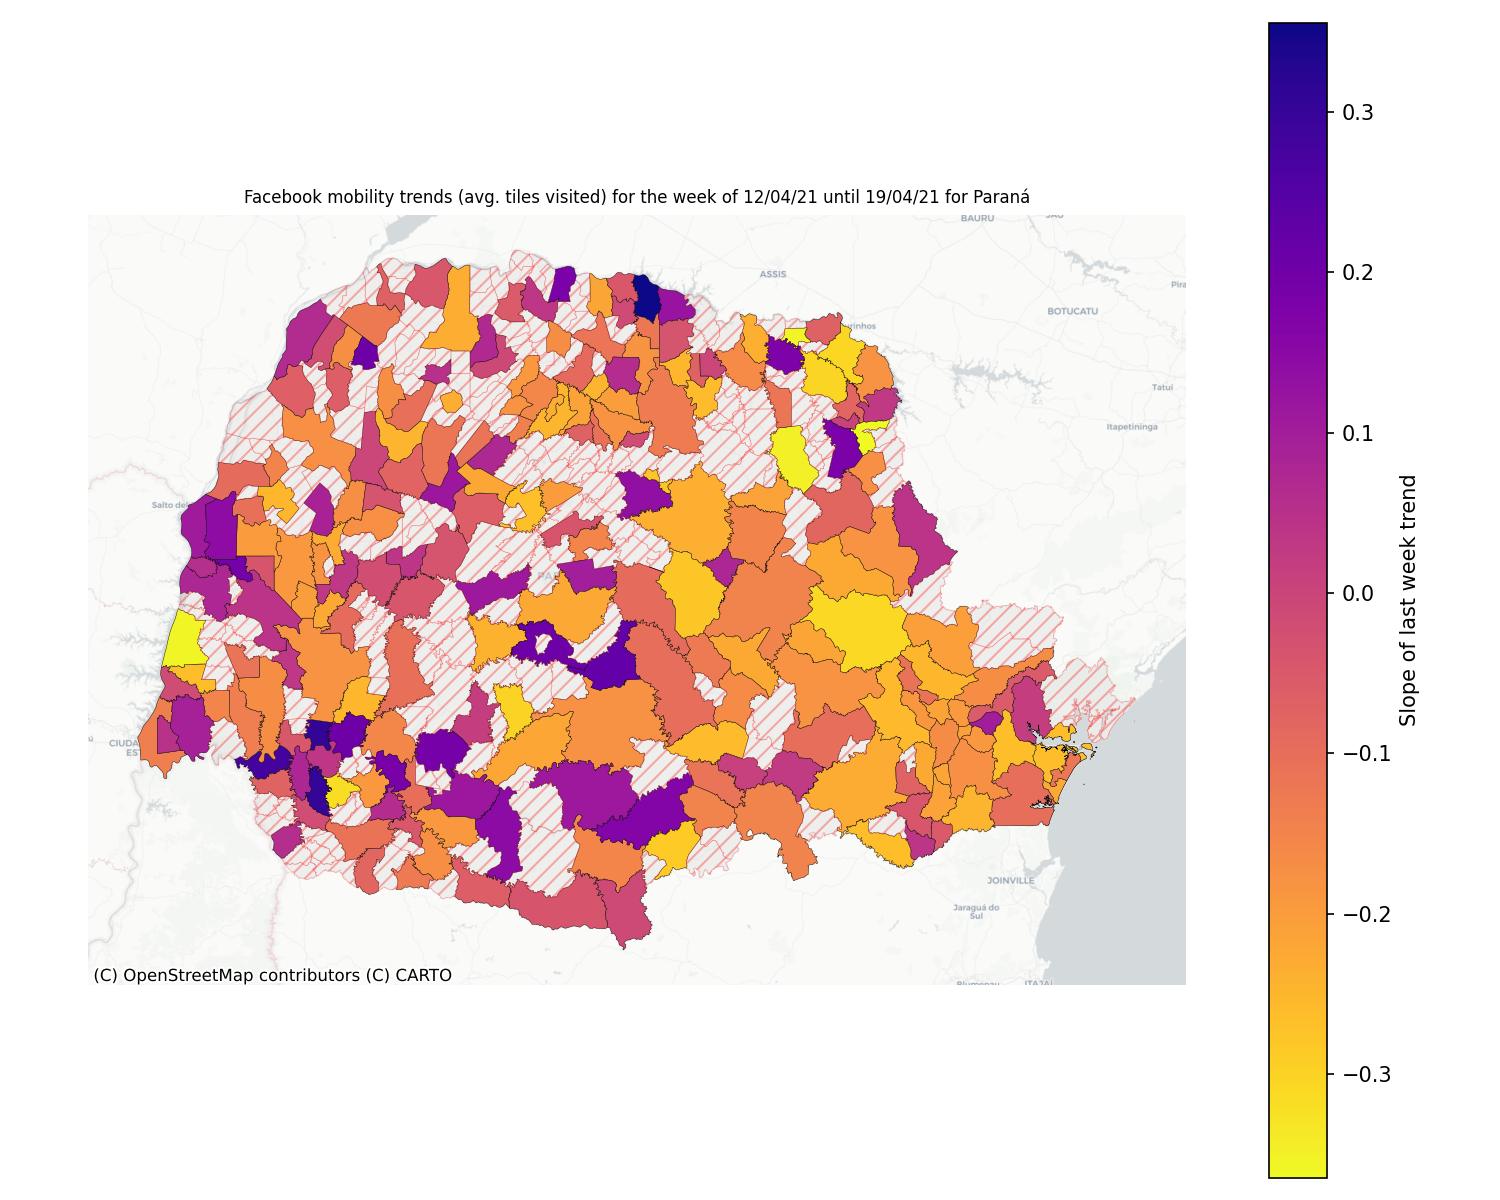
Note
This plot uses official data from Facebook mobility data. This data is released with a Creative Commons Attribution International license.
Mobility data for the state
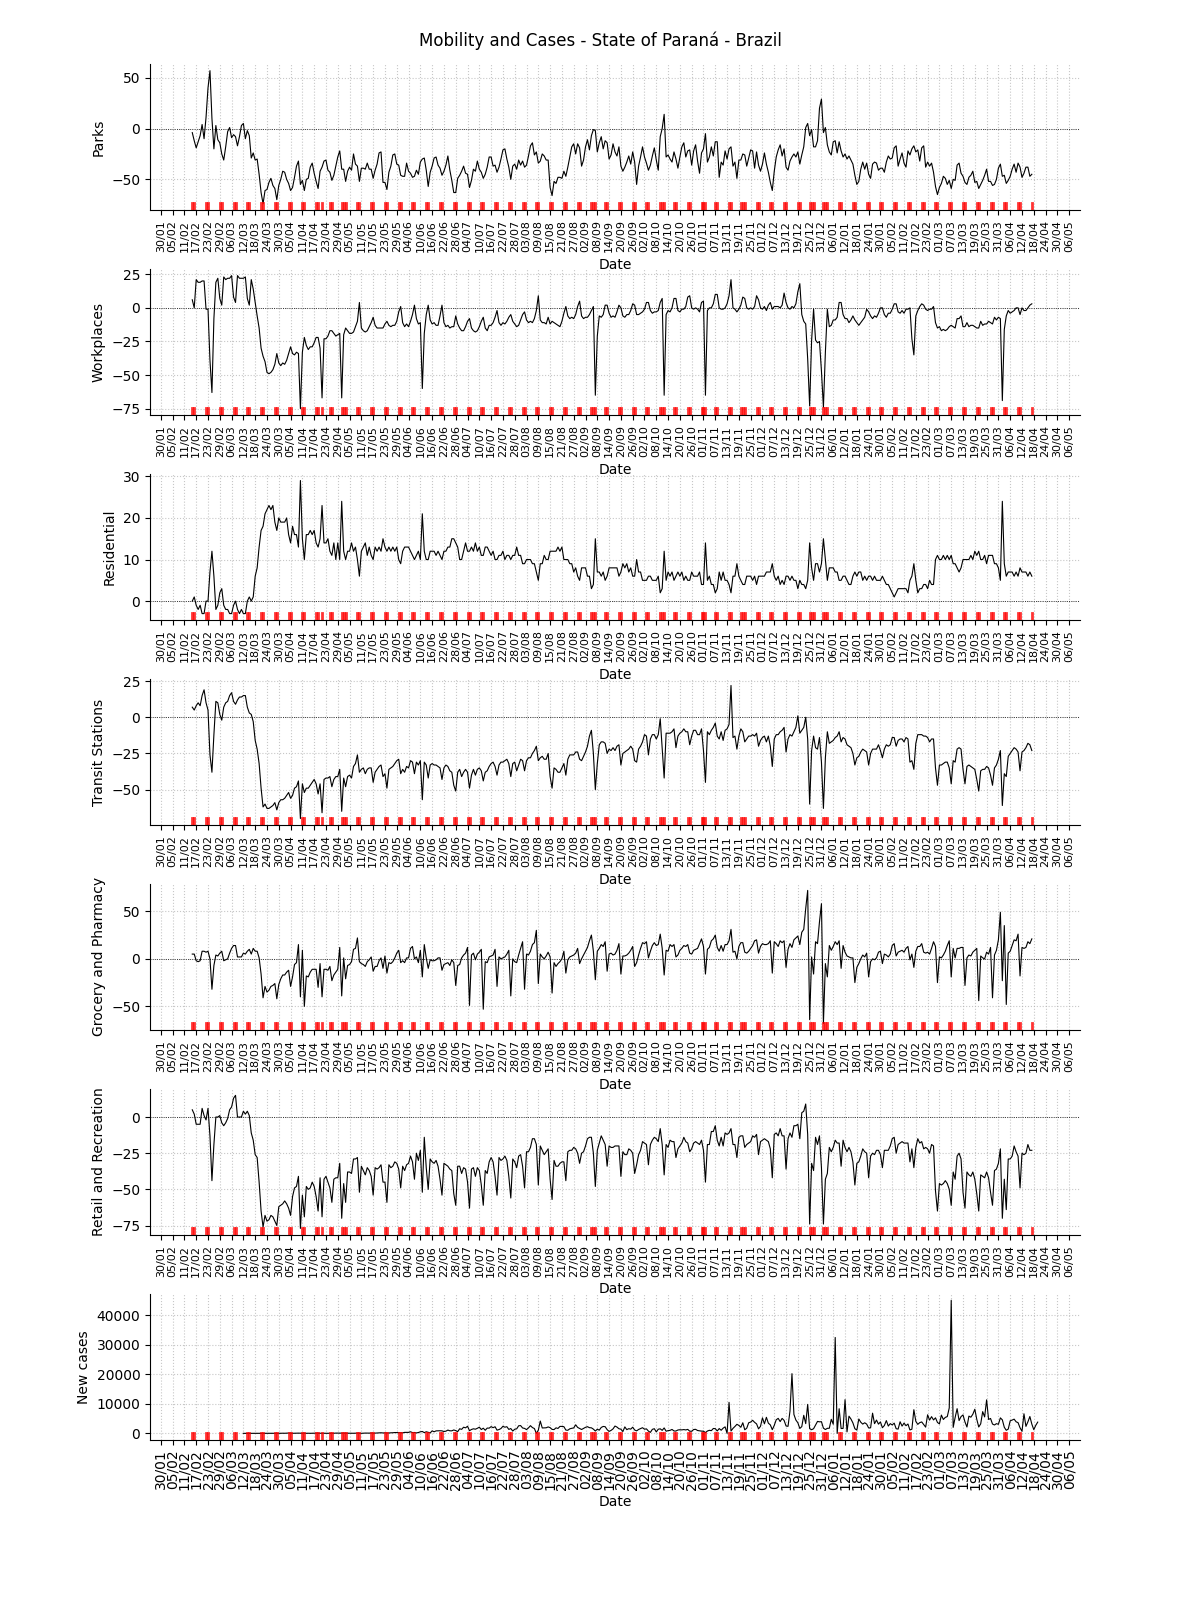
Facebook symptom survey for the state
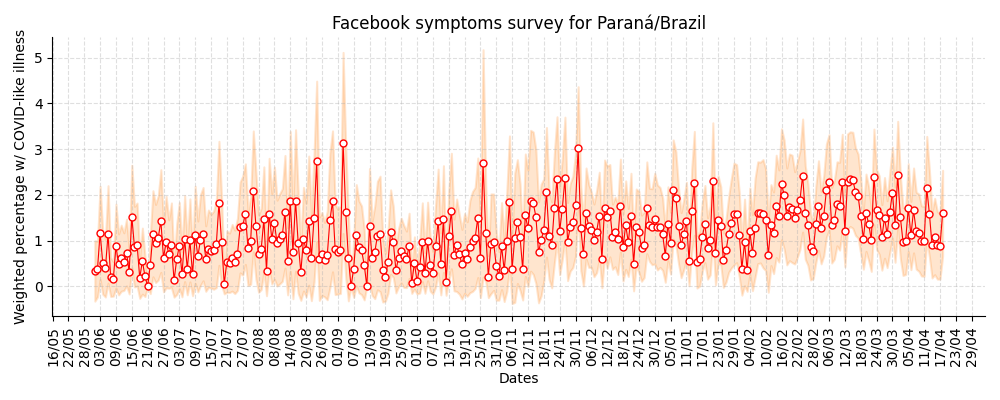
Note
This plot uses official data from Brazilian government as well as mobility data from Google Community Mobility Reports. The red markers on the x-axis are weekends or holidays. This plot also uses data from the Facebook Symptom survey data kindly hosted by University of Maryland.
State: Rio de Janeiro / RJ
R(t) estimate, incidence and accumulated cases
![]()

Facebook mobility trend data for the state
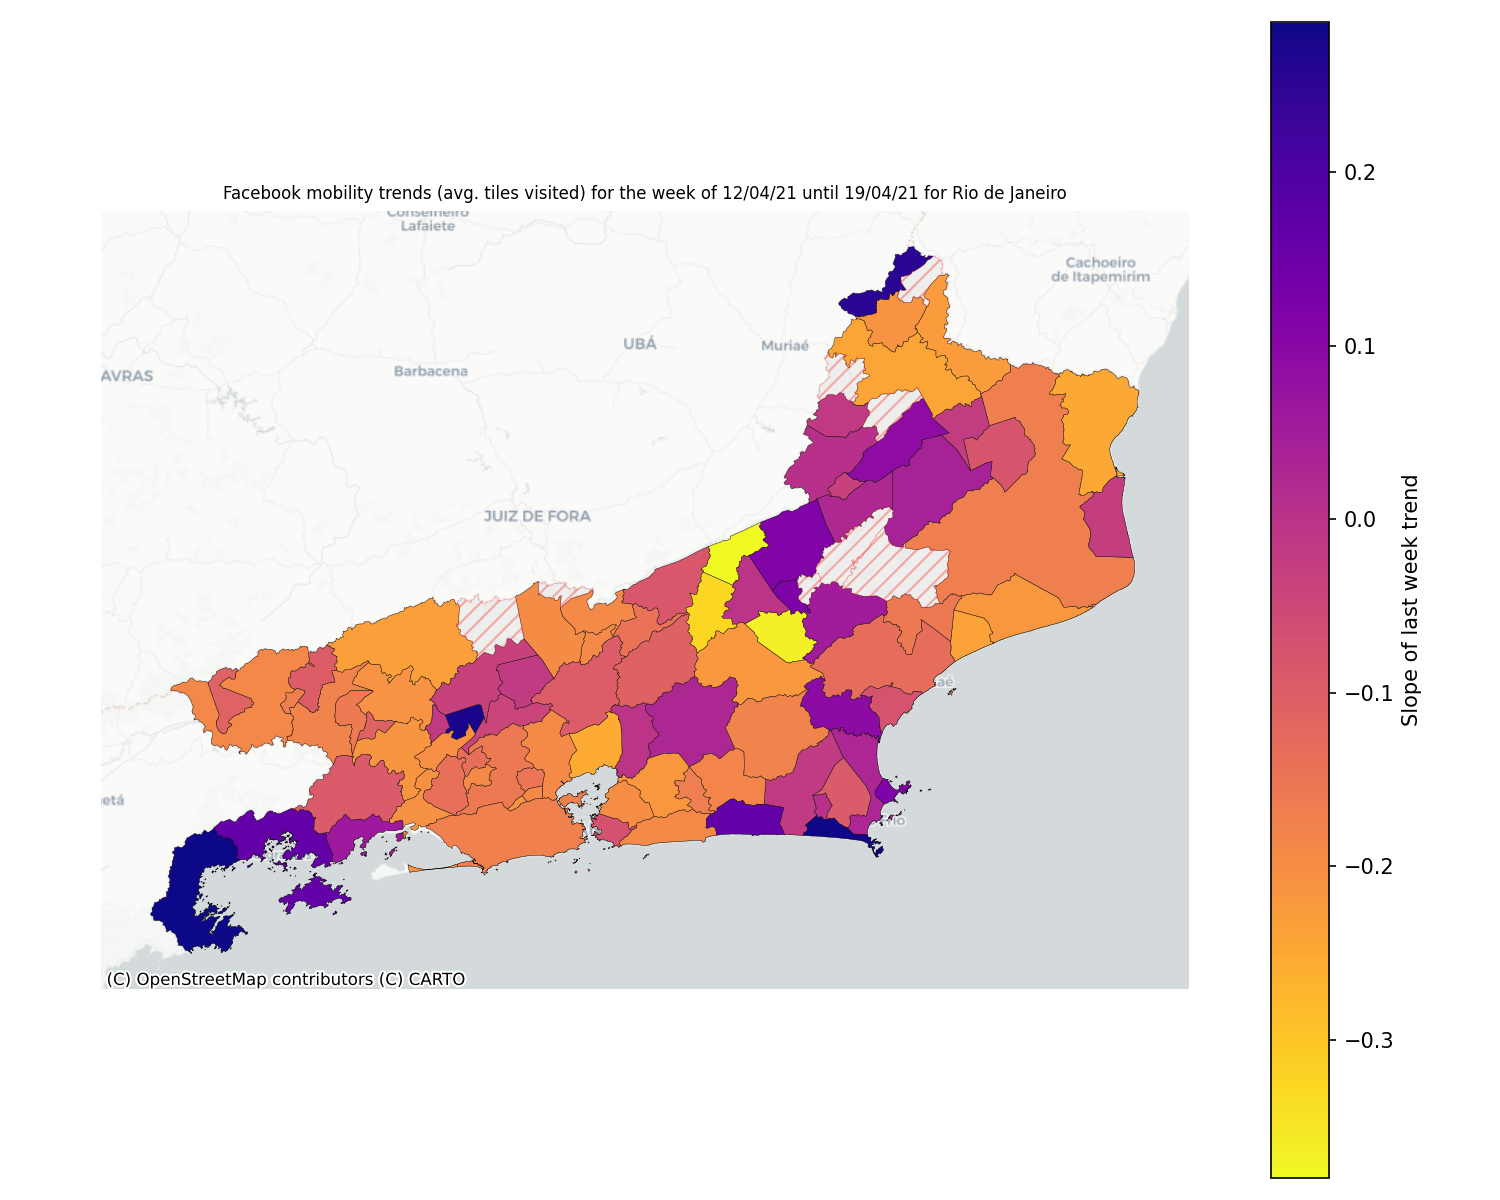
Note
This plot uses official data from Facebook mobility data. This data is released with a Creative Commons Attribution International license.
Mobility data for the state
Facebook symptom survey for the state
Note
This plot uses official data from Brazilian government as well as mobility data from Google Community Mobility Reports. The red markers on the x-axis are weekends or holidays. This plot also uses data from the Facebook Symptom survey data kindly hosted by University of Maryland.
State: Rio Grande do Norte / RN
R(t) estimate, incidence and accumulated cases
![]()
Facebook mobility trend data for the state
Note
This plot uses official data from Facebook mobility data. This data is released with a Creative Commons Attribution International license.
Mobility data for the state
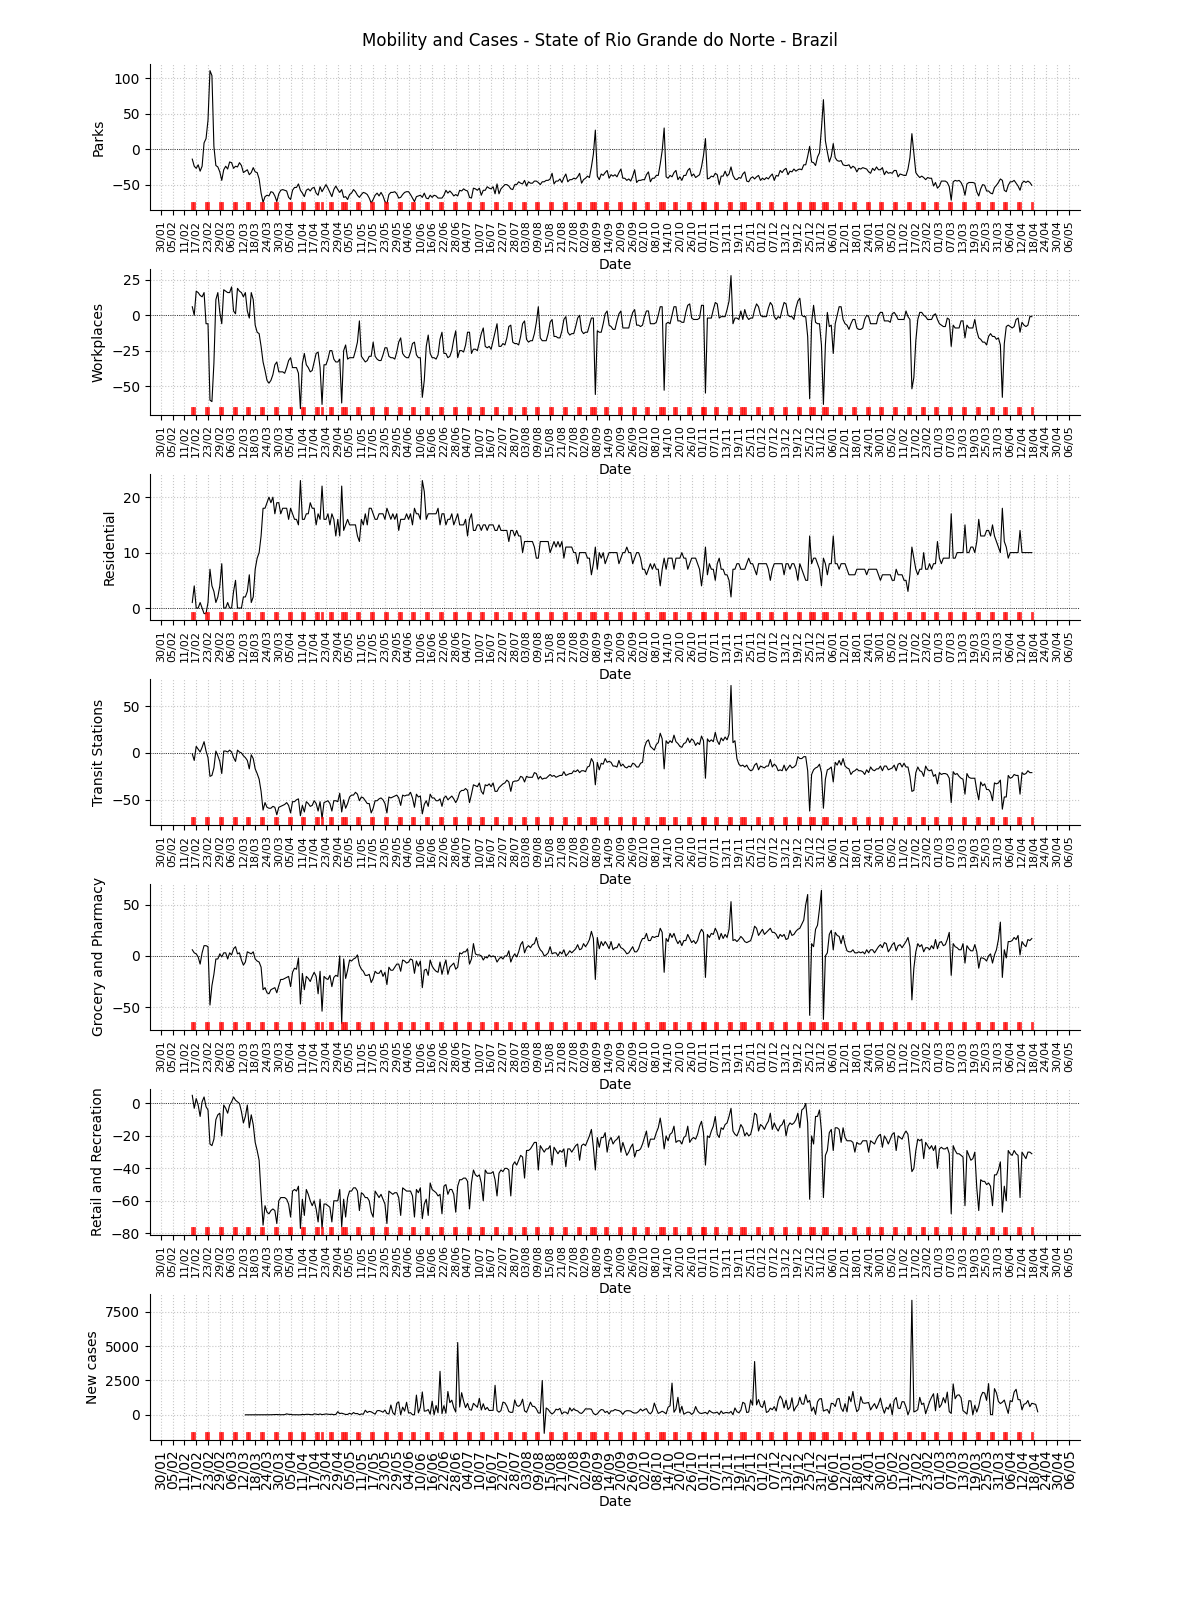
Facebook symptom survey for the state
Note
This plot uses official data from Brazilian government as well as mobility data from Google Community Mobility Reports. The red markers on the x-axis are weekends or holidays. This plot also uses data from the Facebook Symptom survey data kindly hosted by University of Maryland.
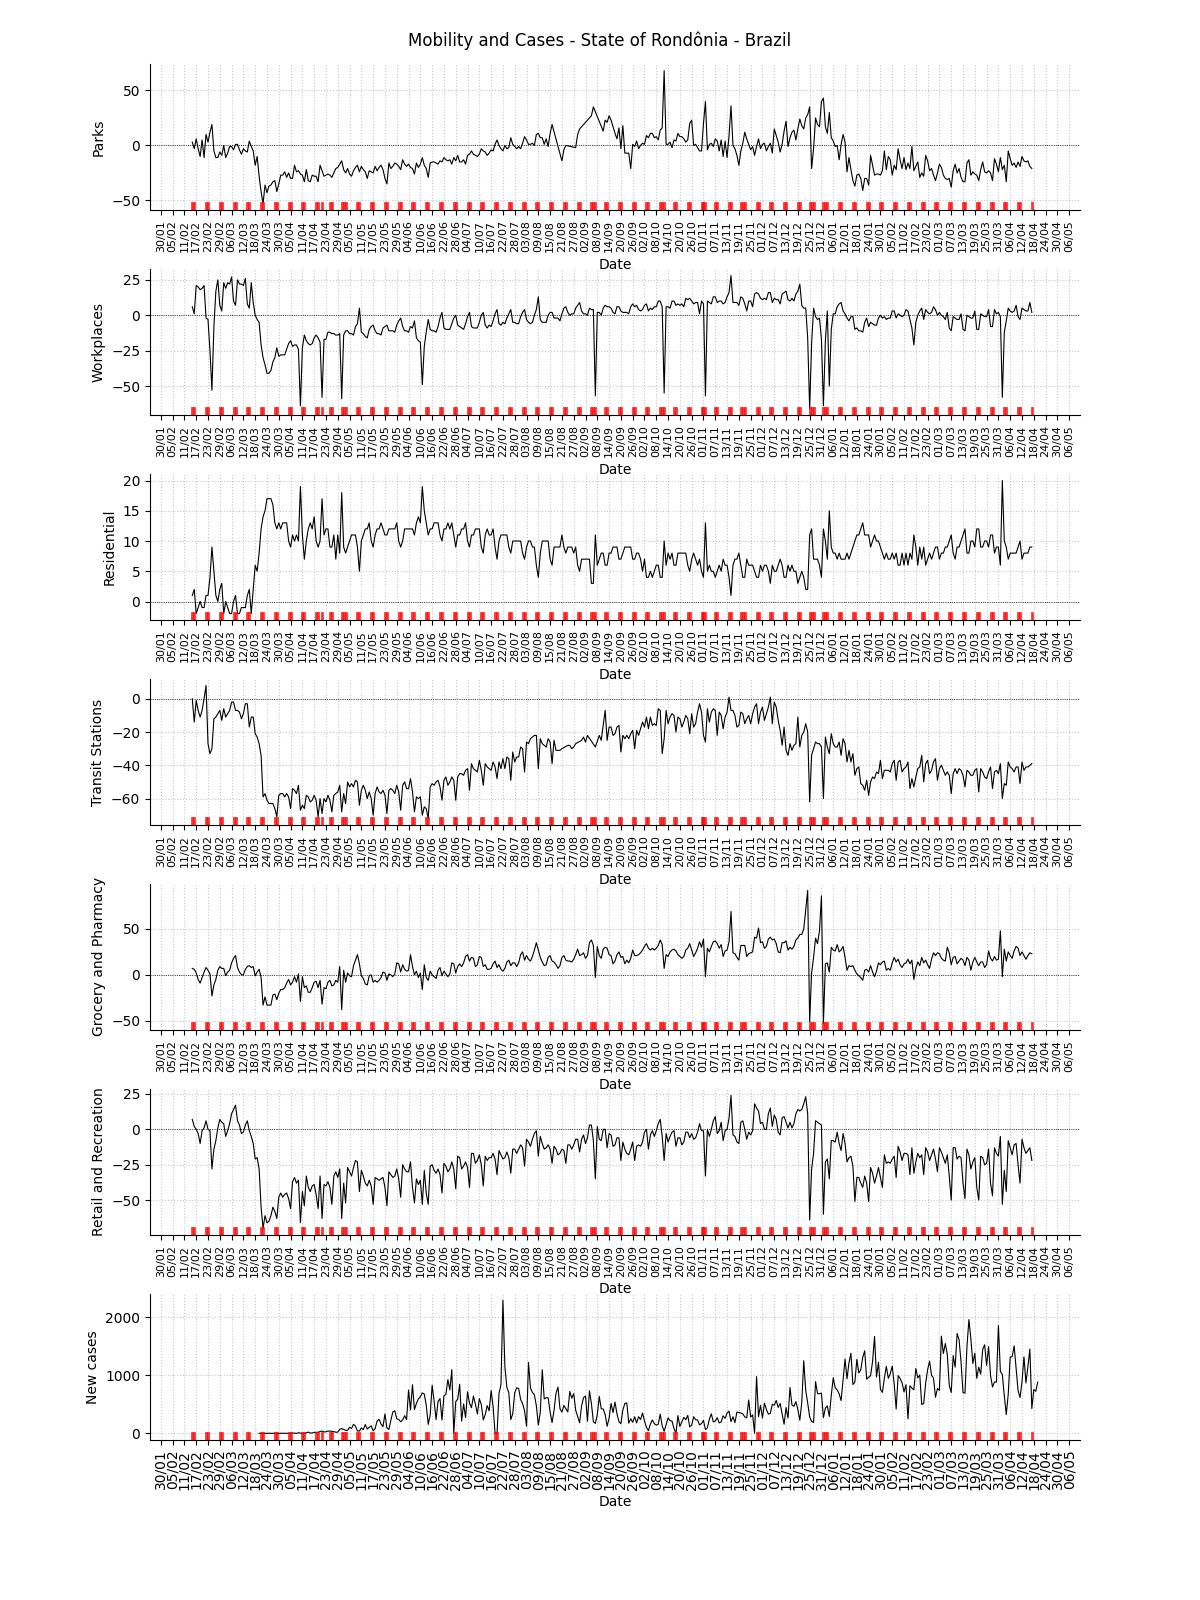
State: Rondônia / RO
R(t) estimate, incidence and accumulated cases
![]()
Facebook mobility trend data for the state

Note
This plot uses official data from Facebook mobility data. This data is released with a Creative Commons Attribution International license.
Mobility data for the state
Facebook symptom survey for the state

Note
This plot uses official data from Brazilian government as well as mobility data from Google Community Mobility Reports. The red markers on the x-axis are weekends or holidays. This plot also uses data from the Facebook Symptom survey data kindly hosted by University of Maryland.
State: Roraima / RR
R(t) estimate, incidence and accumulated cases
![]()
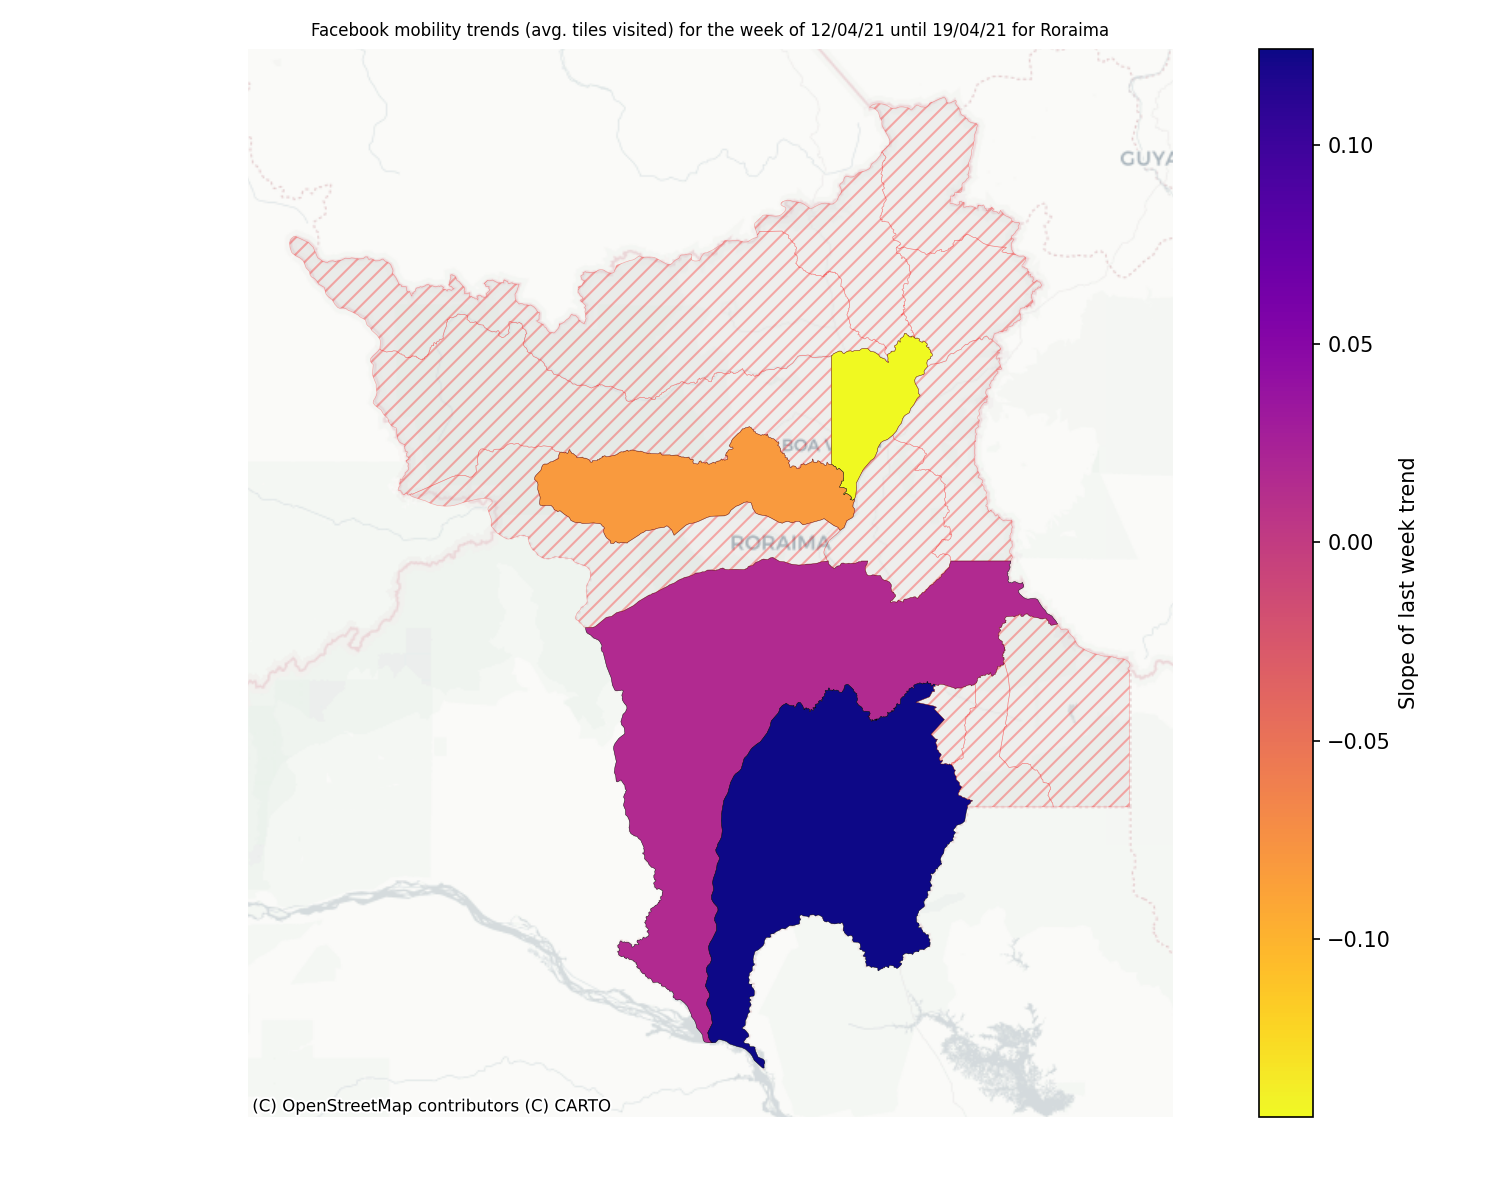
Facebook mobility trend data for the state
Note
This plot uses official data from Facebook mobility data. This data is released with a Creative Commons Attribution International license.
Mobility data for the state

Facebook symptom survey for the state
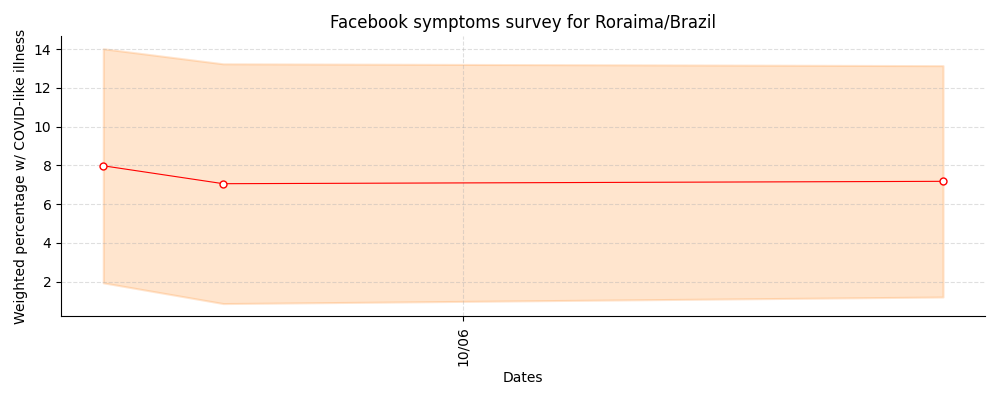
Note
This plot uses official data from Brazilian government as well as mobility data from Google Community Mobility Reports. The red markers on the x-axis are weekends or holidays. This plot also uses data from the Facebook Symptom survey data kindly hosted by University of Maryland.
State: Rio Grande do Sul / RS
R(t) estimate, incidence and accumulated cases
![]()
Facebook mobility trend data for the state
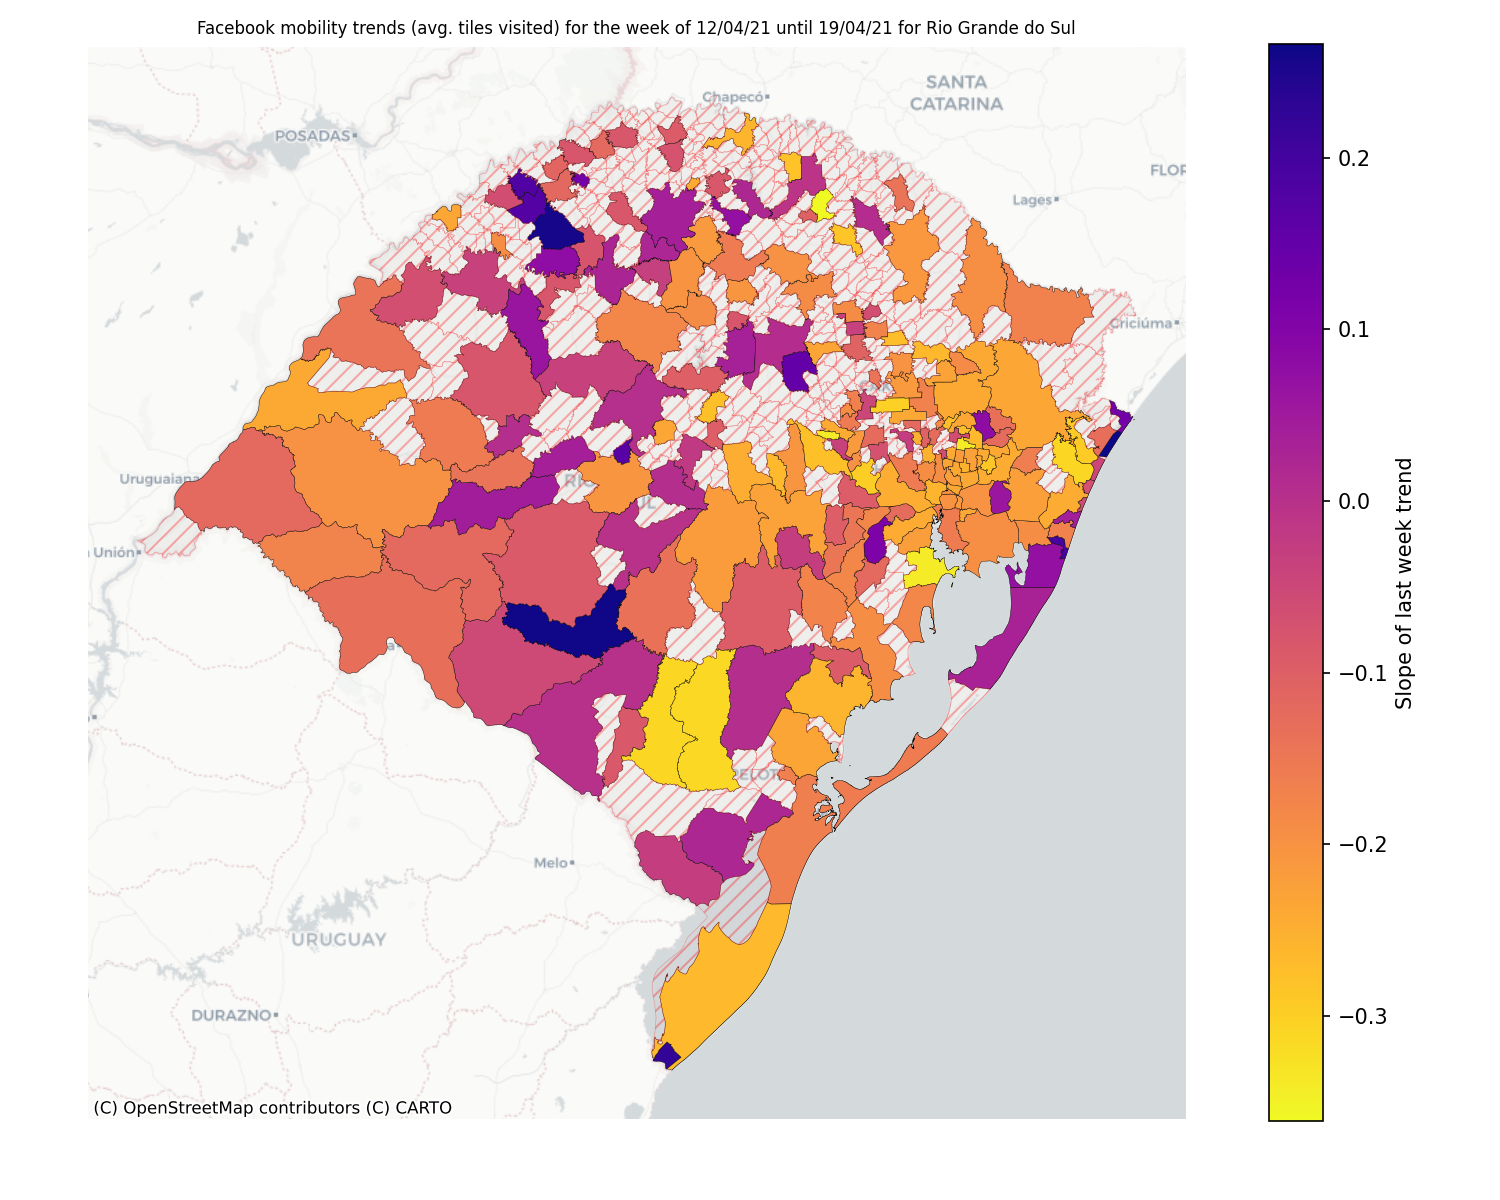
Note
This plot uses official data from Facebook mobility data. This data is released with a Creative Commons Attribution International license.
Mobility data for the state
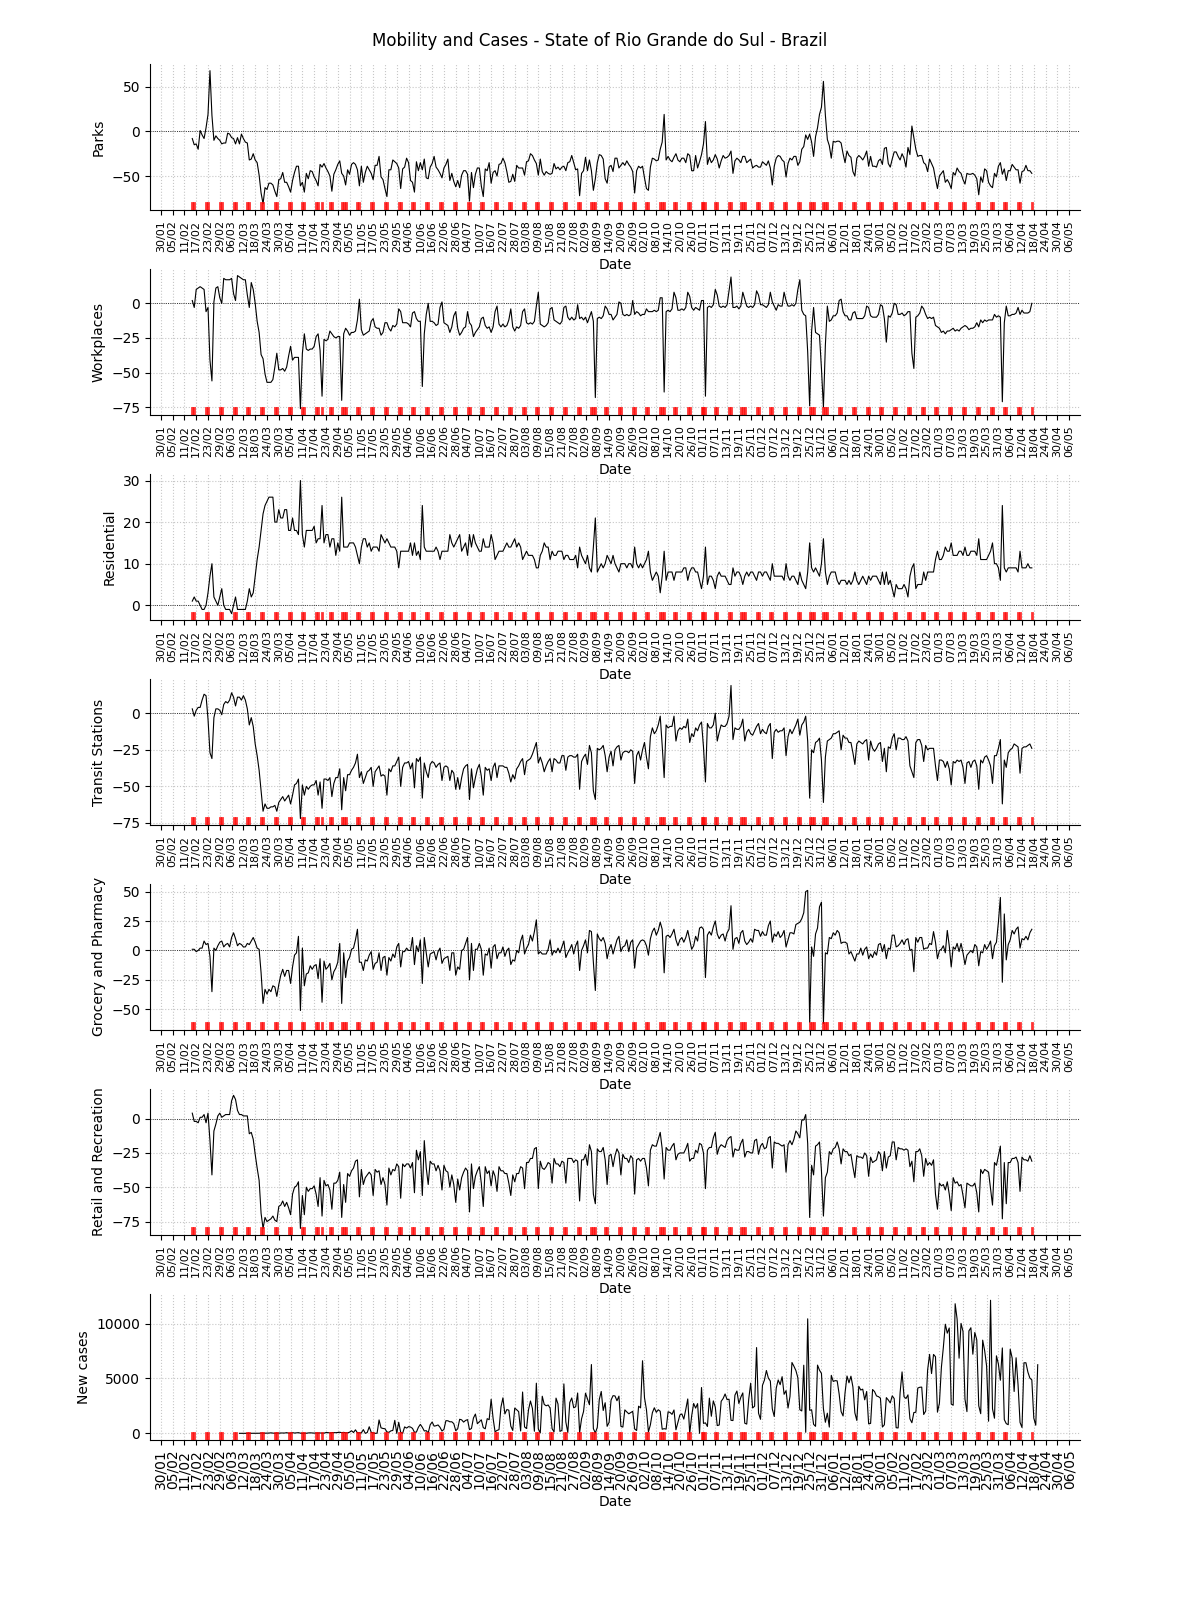
Facebook symptom survey for the state
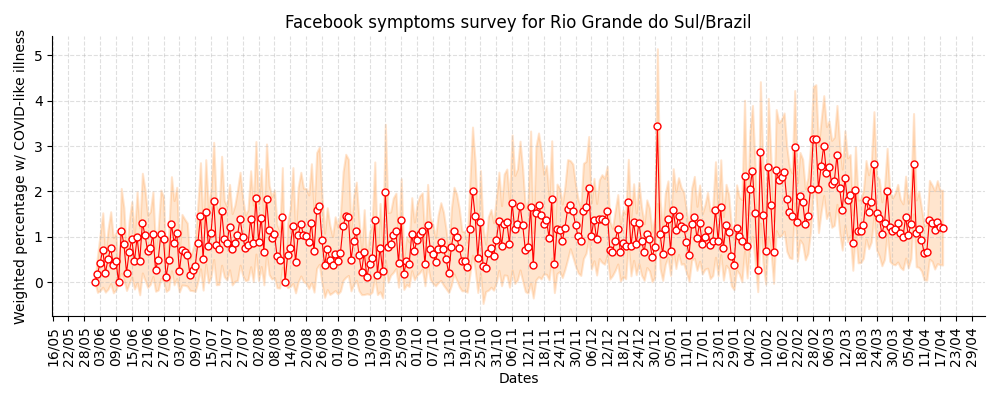
Note
This plot uses official data from Brazilian government as well as mobility data from Google Community Mobility Reports. The red markers on the x-axis are weekends or holidays. This plot also uses data from the Facebook Symptom survey data kindly hosted by University of Maryland.
State: Santa Catarina / SC
R(t) estimate, incidence and accumulated cases
![]()
Facebook mobility trend data for the state
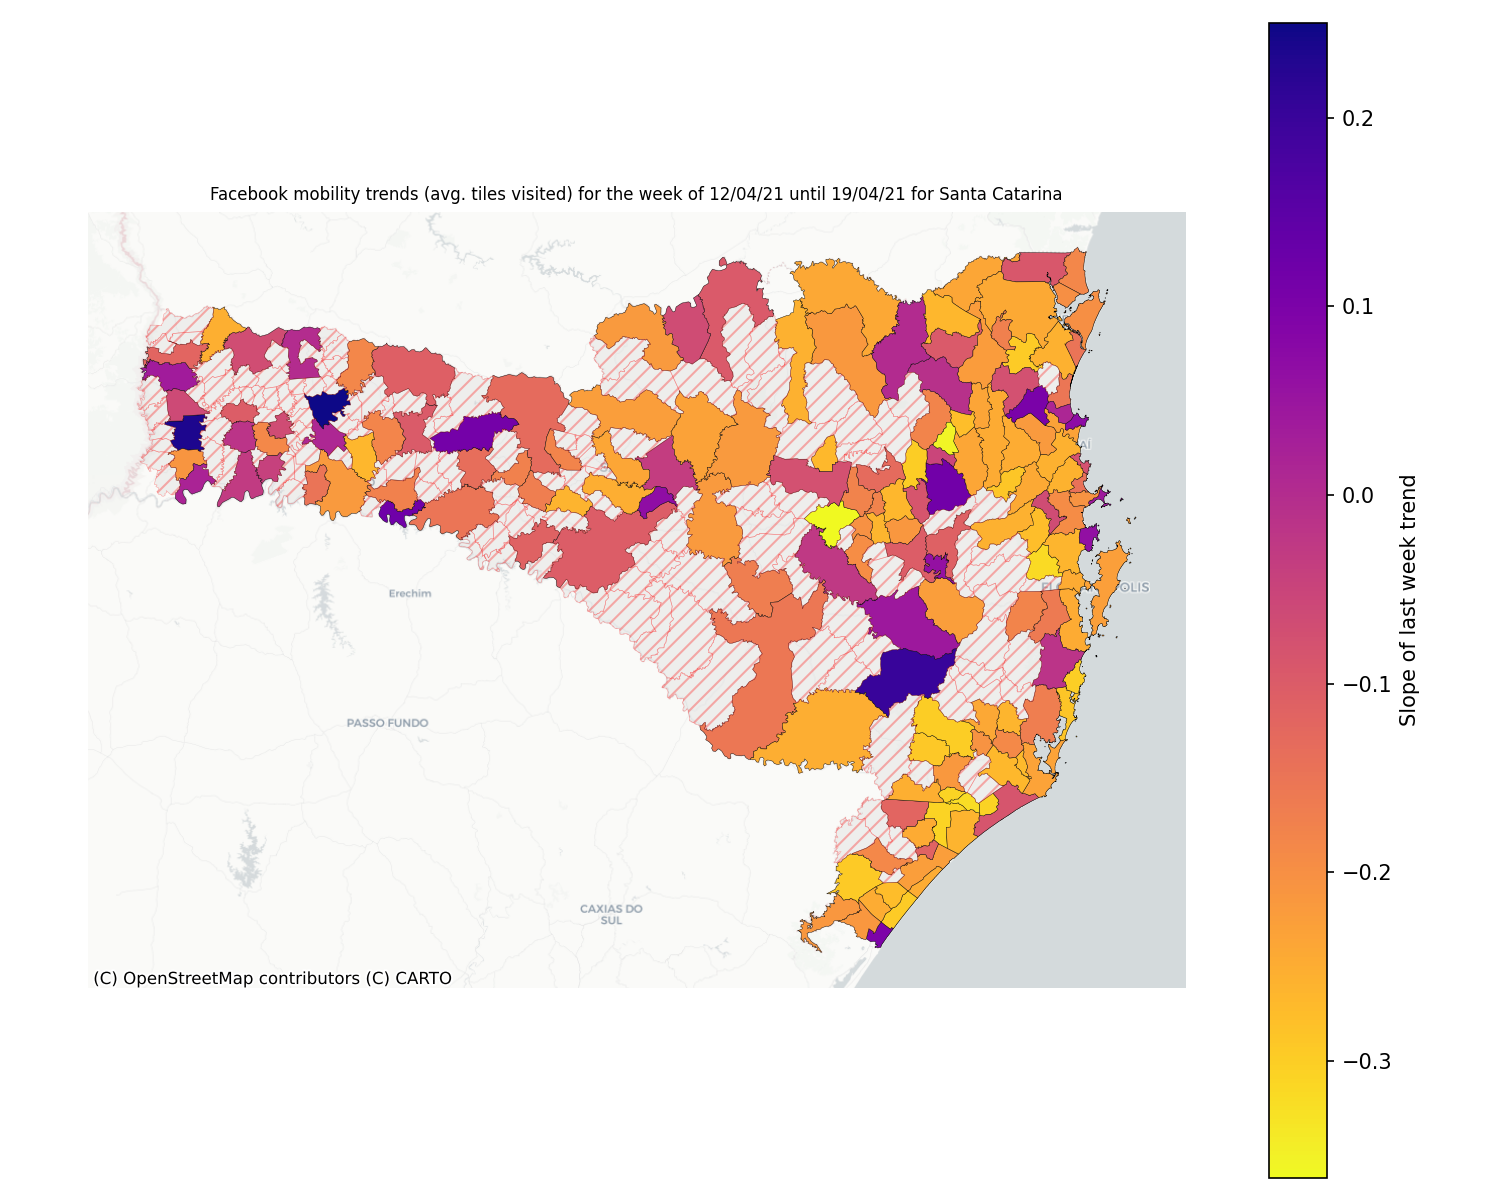
Note
This plot uses official data from Facebook mobility data. This data is released with a Creative Commons Attribution International license.
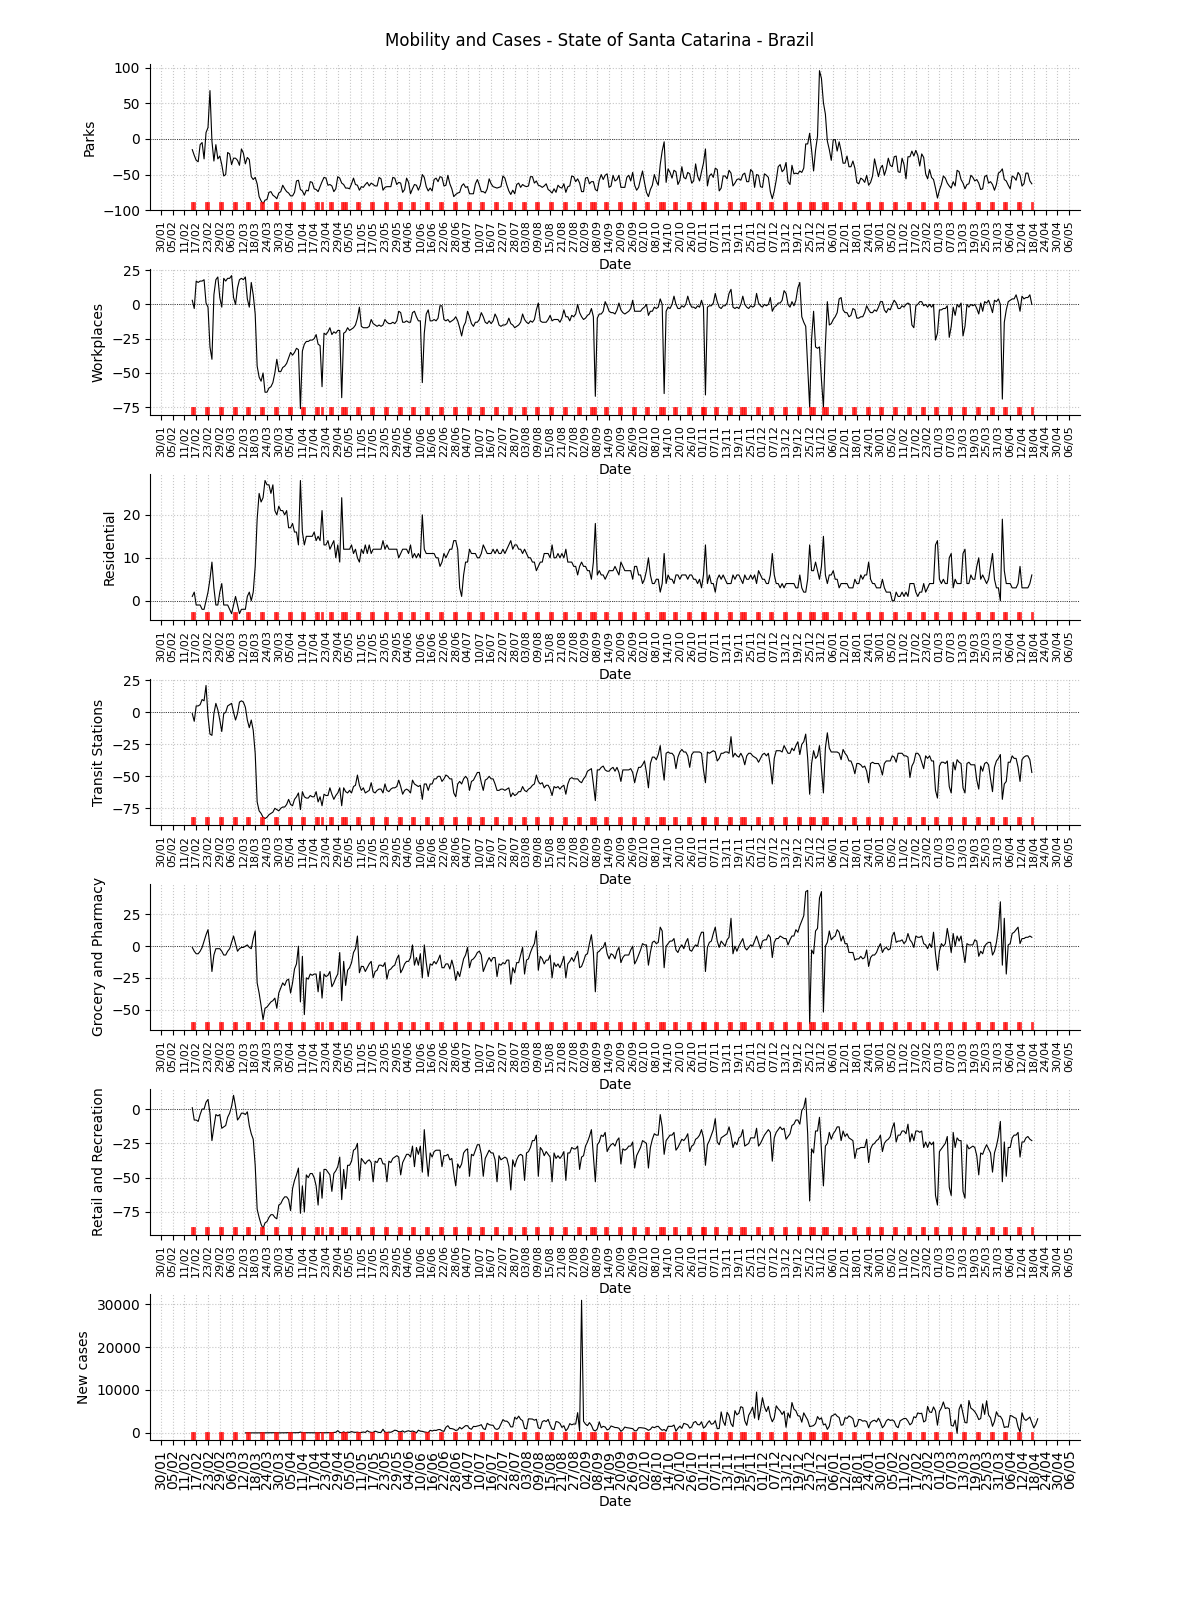
Mobility data for the state
Facebook symptom survey for the state

Note
This plot uses official data from Brazilian government as well as mobility data from Google Community Mobility Reports. The red markers on the x-axis are weekends or holidays. This plot also uses data from the Facebook Symptom survey data kindly hosted by University of Maryland.
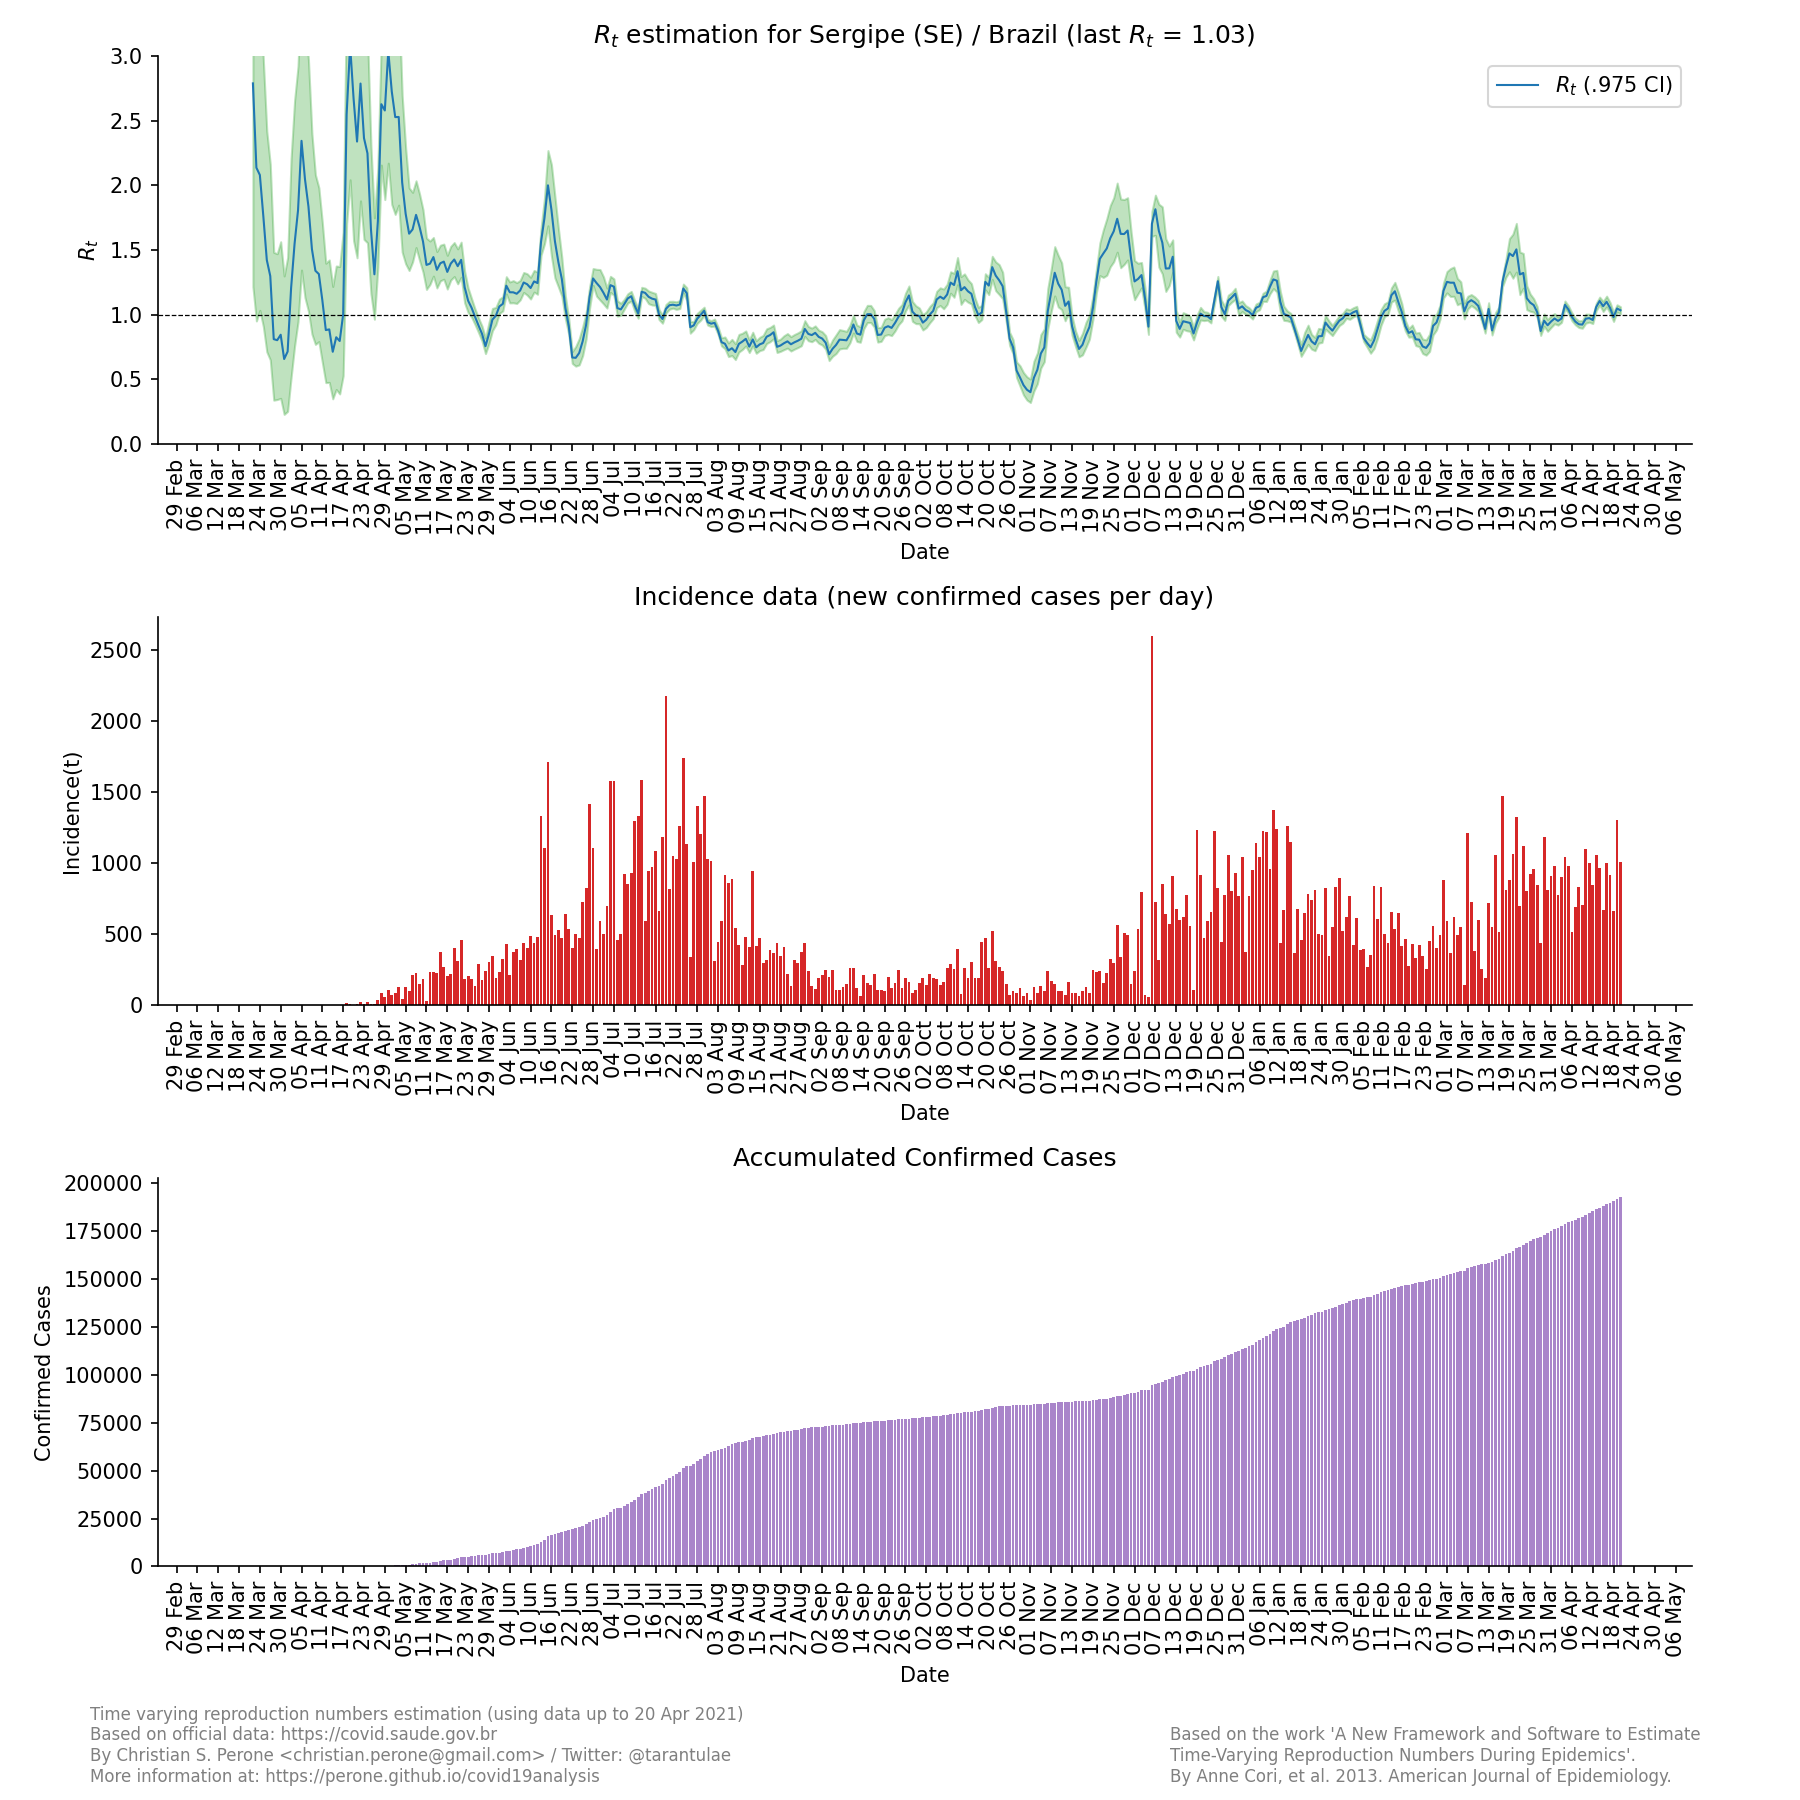
State: Sergipe / SE
R(t) estimate, incidence and accumulated cases
![]()
Facebook mobility trend data for the state

Note
This plot uses official data from Facebook mobility data. This data is released with a Creative Commons Attribution International license.
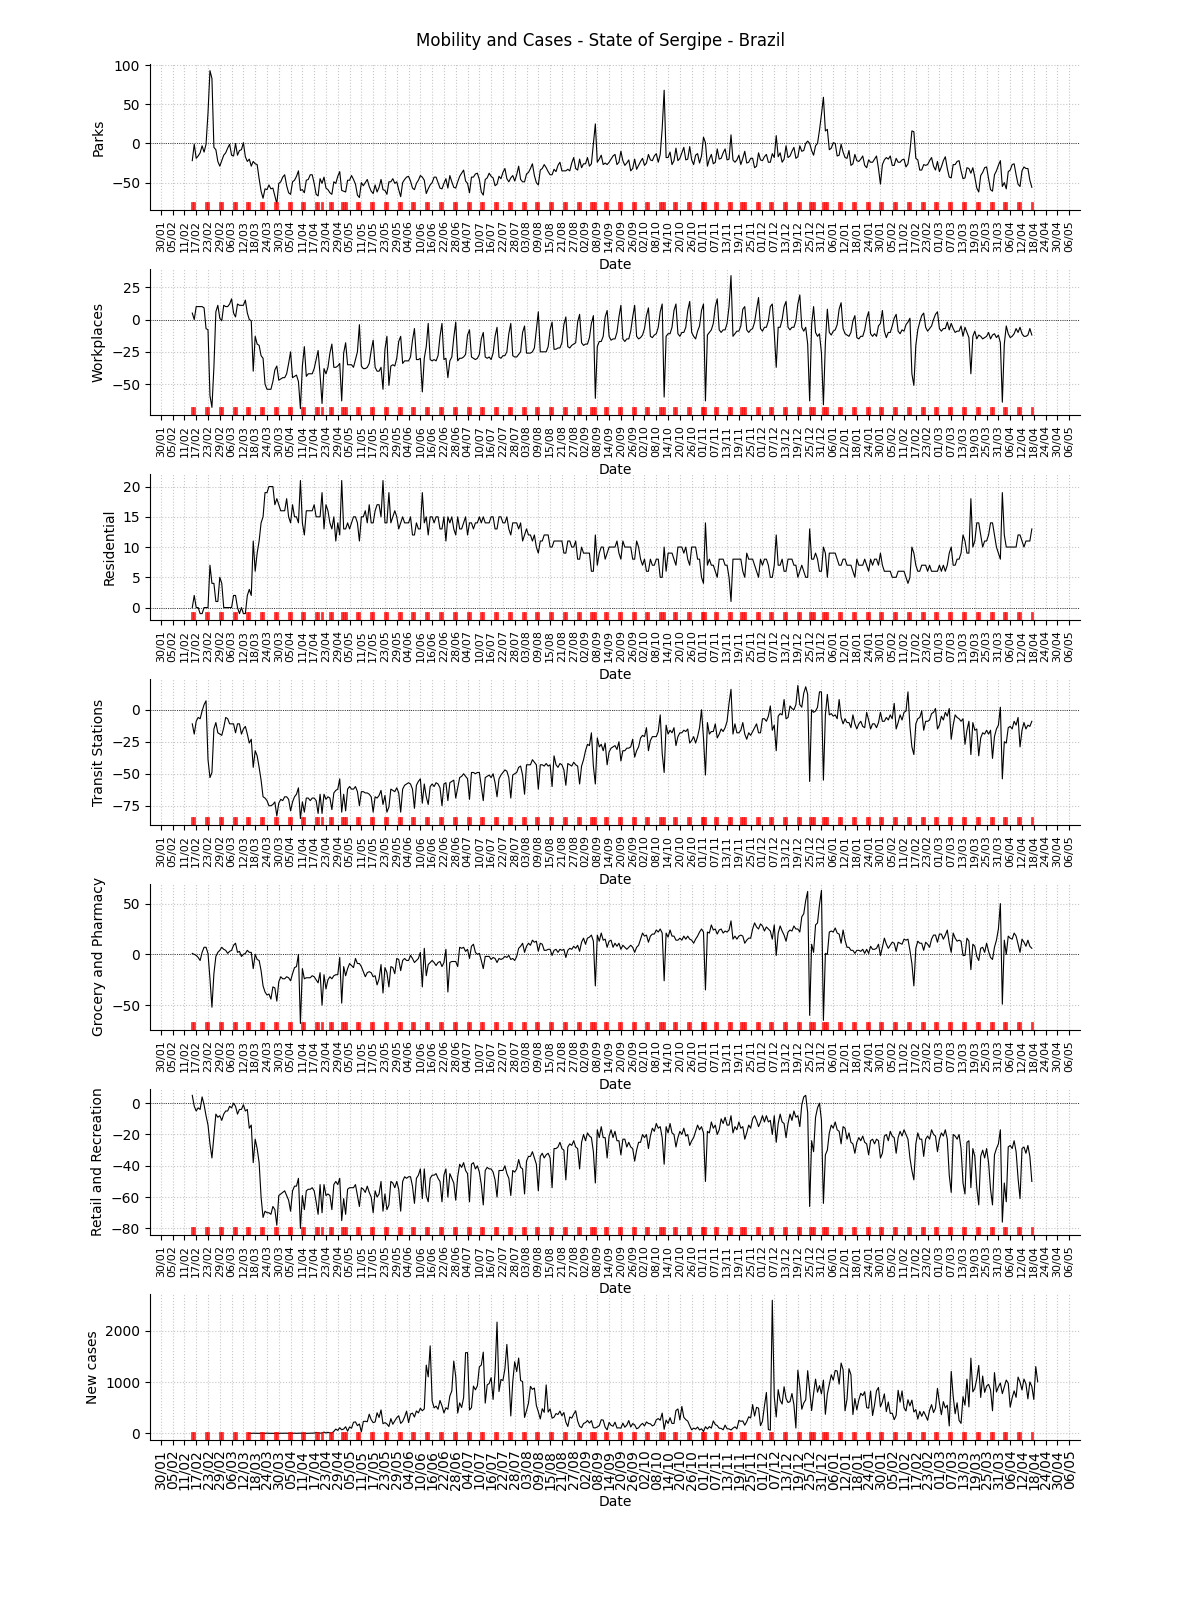
Mobility data for the state
Facebook symptom survey for the state
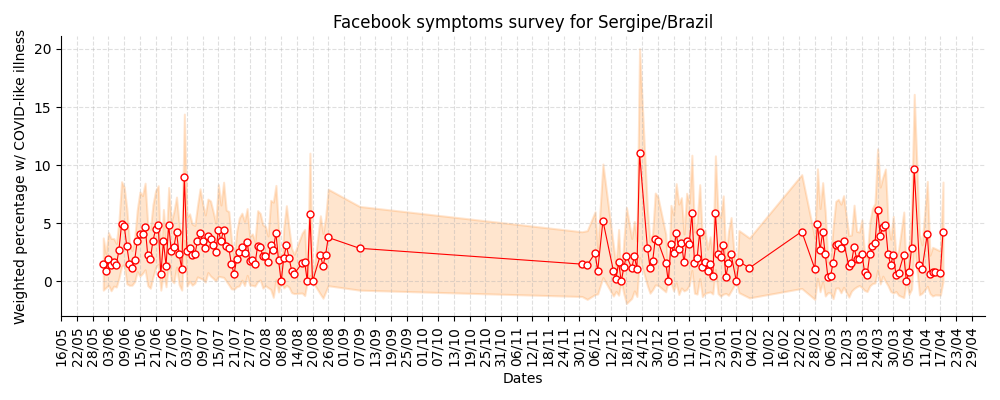
Note
This plot uses official data from Brazilian government as well as mobility data from Google Community Mobility Reports. The red markers on the x-axis are weekends or holidays. This plot also uses data from the Facebook Symptom survey data kindly hosted by University of Maryland.
State: São Paulo / SP
R(t) estimate, incidence and accumulated cases
![]()

Facebook mobility trend data for the state
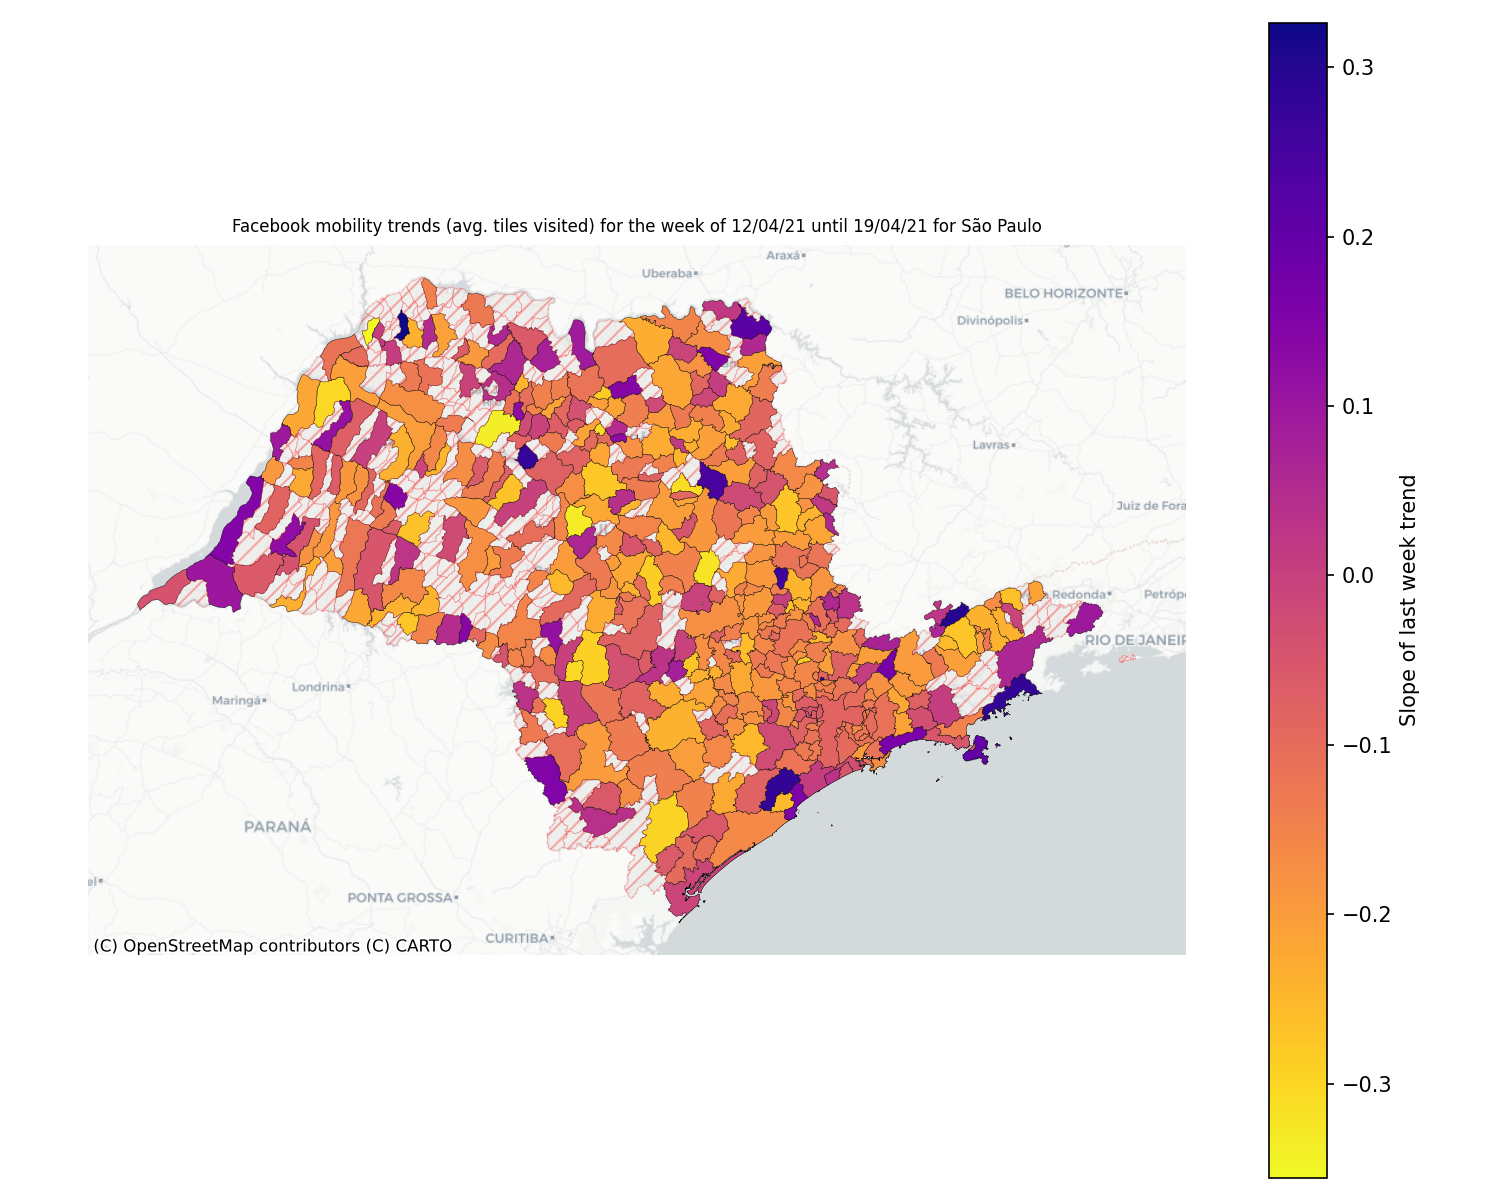
Note
This plot uses official data from Facebook mobility data. This data is released with a Creative Commons Attribution International license.
Mobility data for the state
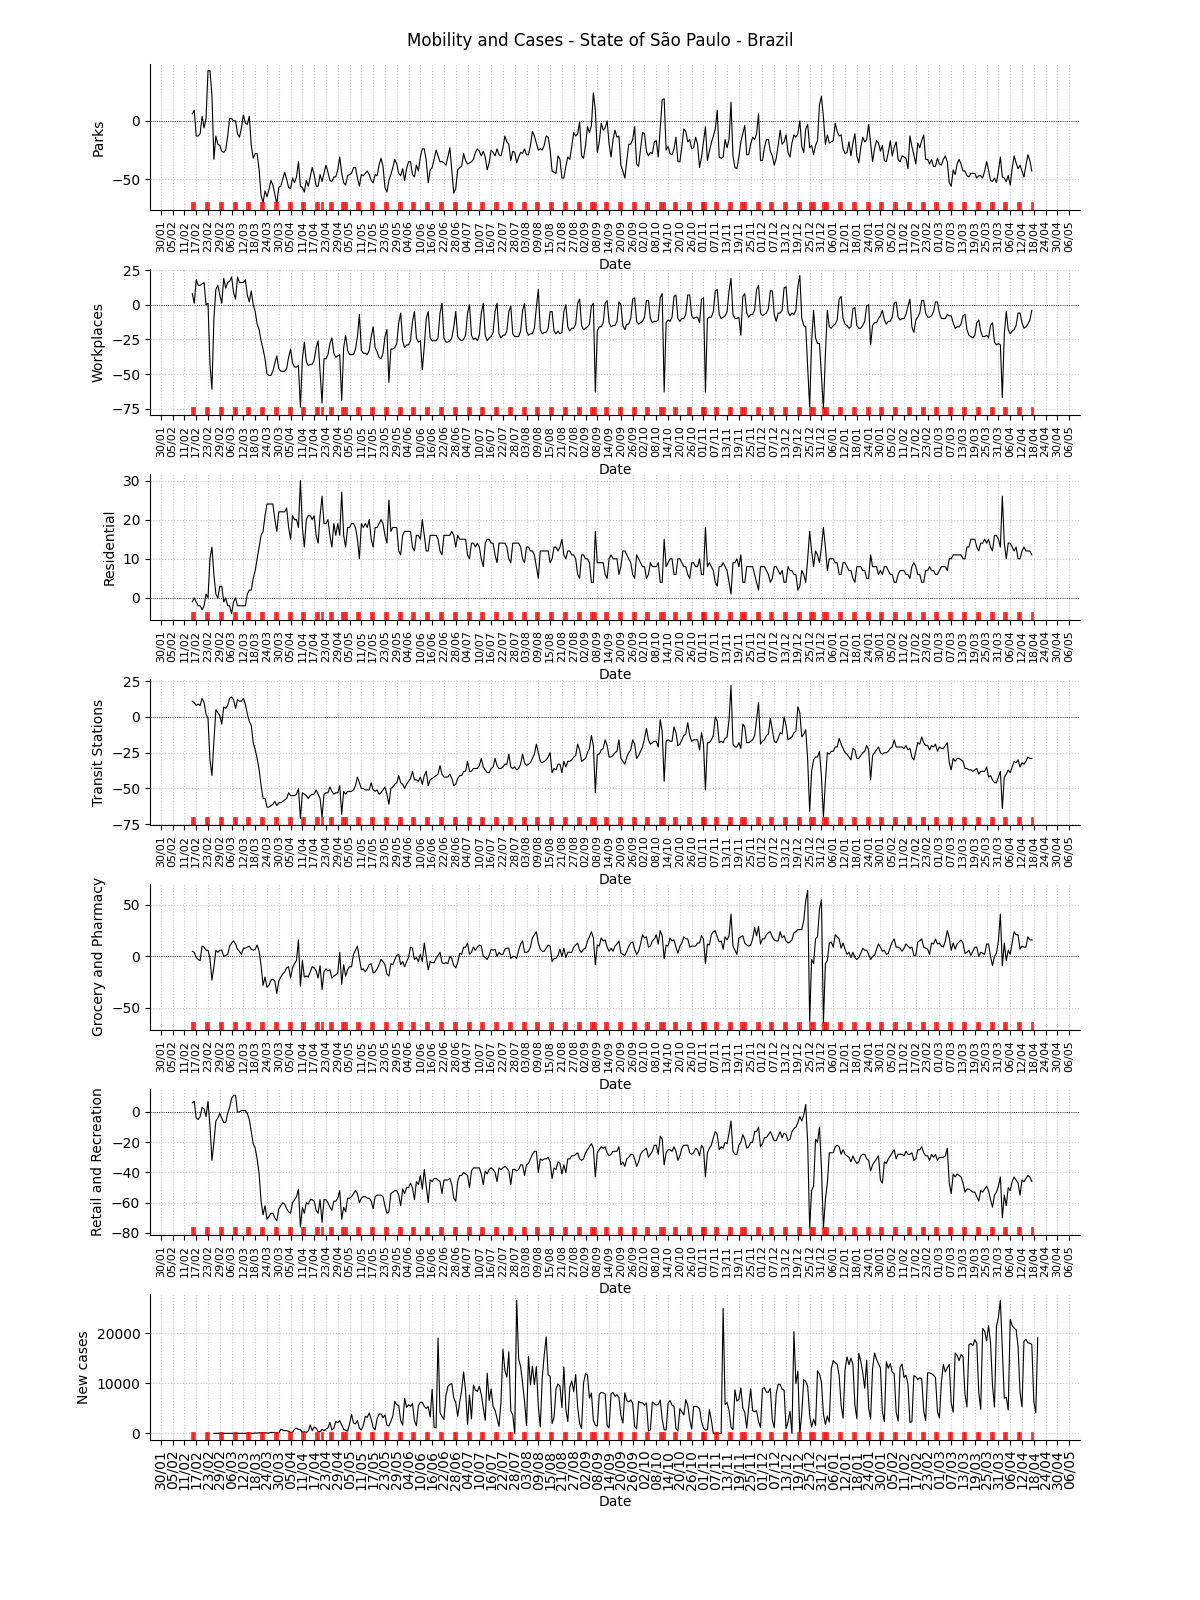
Facebook symptom survey for the state
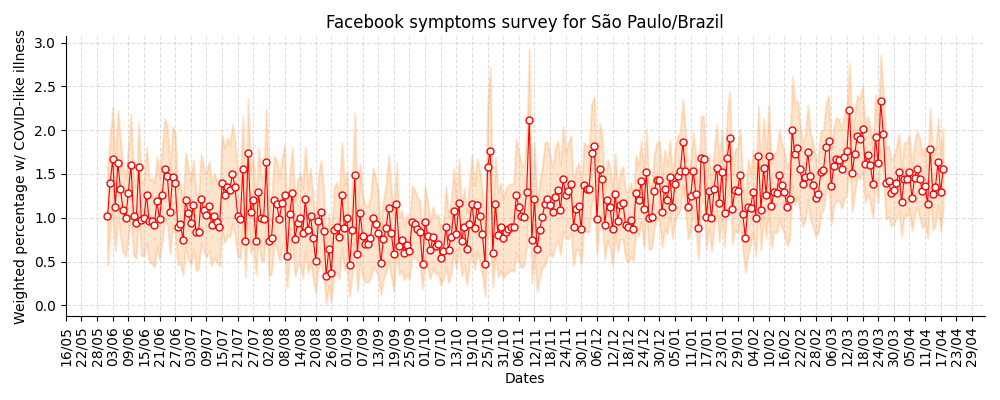
Note
This plot uses official data from Brazilian government as well as mobility data from Google Community Mobility Reports. The red markers on the x-axis are weekends or holidays. This plot also uses data from the Facebook Symptom survey data kindly hosted by University of Maryland.
State: Tocantins / TO
R(t) estimate, incidence and accumulated cases
![]()

Facebook mobility trend data for the state
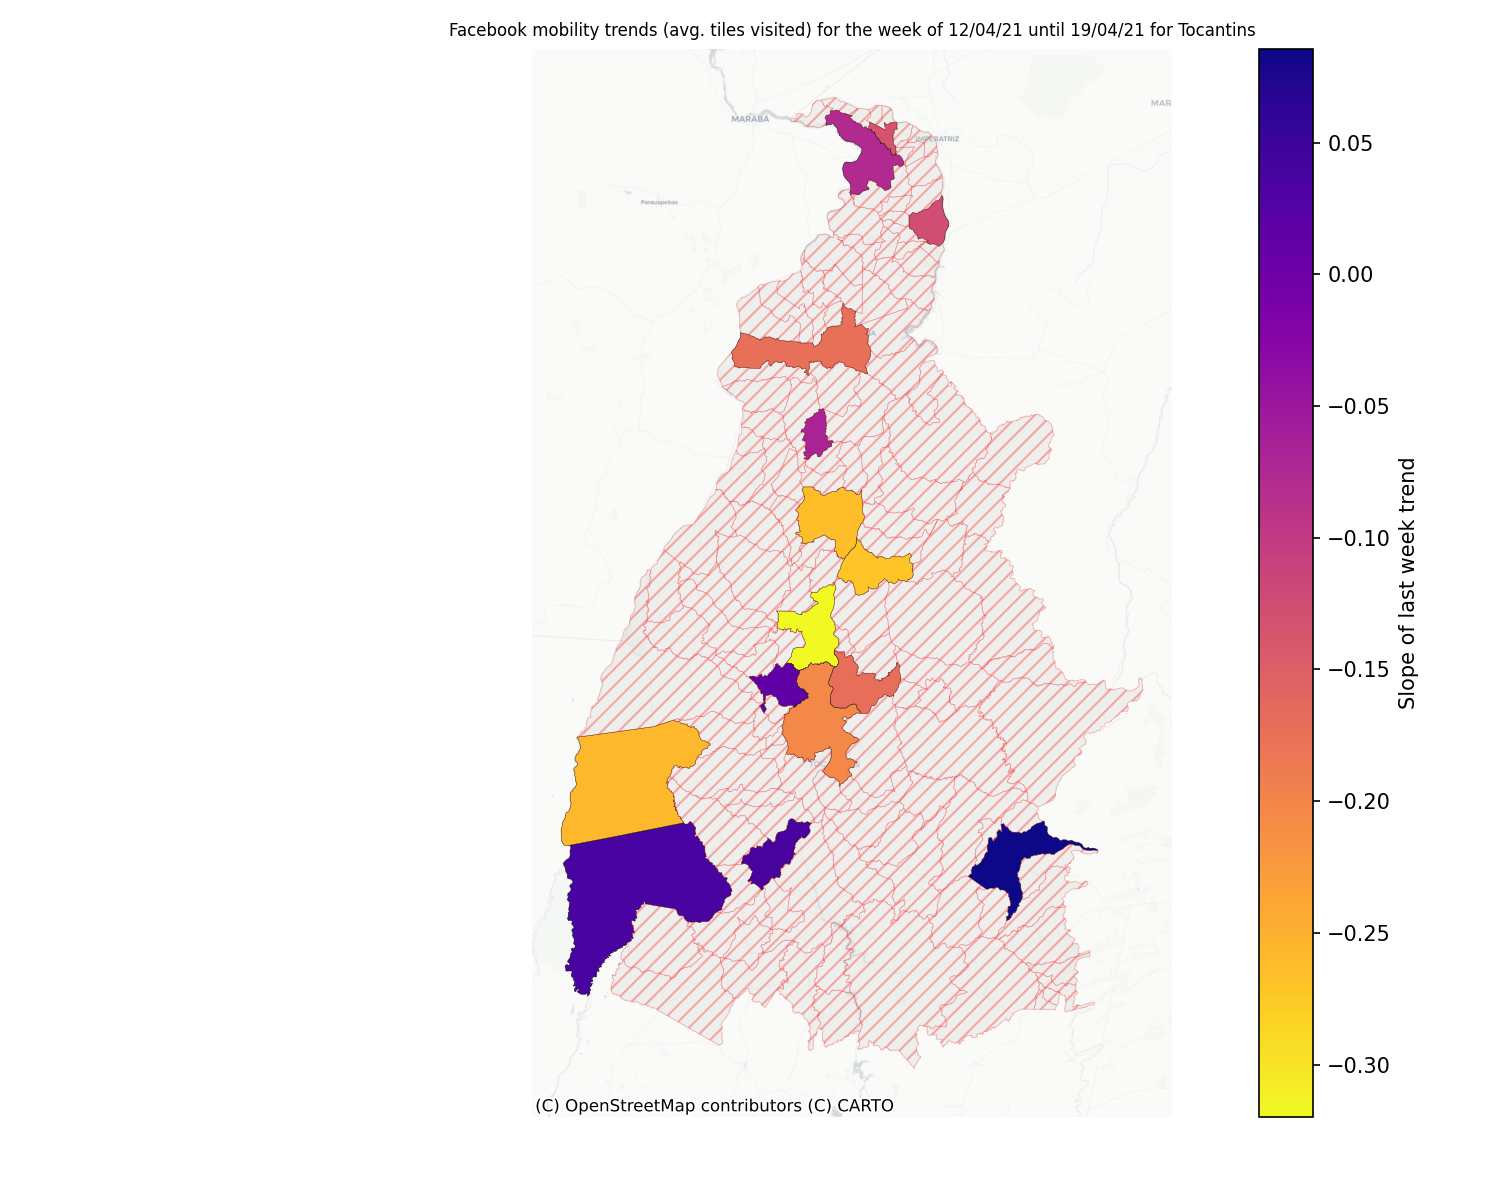
Note
This plot uses official data from Facebook mobility data. This data is released with a Creative Commons Attribution International license.
Mobility data for the state

Facebook symptom survey for the state

Note
This plot uses official data from Brazilian government as well as mobility data from Google Community Mobility Reports. The red markers on the x-axis are weekends or holidays. This plot also uses data from the Facebook Symptom survey data kindly hosted by University of Maryland.