COVID-19 Analysis for Portugal
This section contains analysis done for Portugal.
Portugal: country-wide analysis
Bayesian cases changepoint modelling
The changepoint analysis is basically the same as described in this article, where the switchpoint is modelled by a discrete uniform distribution that parametrizes an early \(\alpha\) and \(\beta\) parameters of an exponential model using a negative binomial likelihood.
The priors of the model are these:
The main idea of the model is that we want to learn a distribution over a discrete switchpoint represented by days to identify where the coefficient of growth changed and what was the early and late coefficient.
05/April – Modelling ICU occupancy in Portugal
This is a short animation showing ICU occupancy forecast for the days before April 5th. After that date, the model started to become misspecified due to potential intervention effects or change of criteria/procedures from the portuguese government.
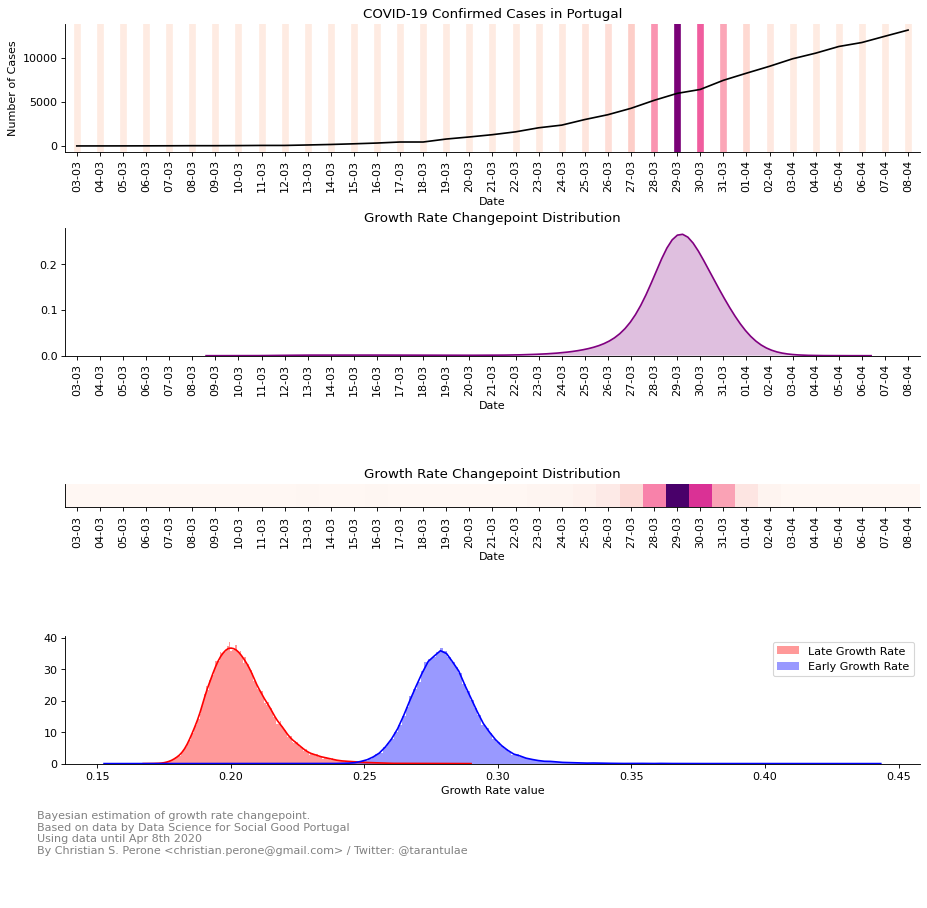
08/April – Changepoint detection for COVID-19 confirmed cases
This is a changepoint analysis done with data up to April 8th. As we know, recently there was a reduction of new cases. All evidence shows that what we’re seeing is effect of interventions, however, the question that this analysis tries to answer is when can we say that we had a change in the growth factor ? It seems that the most likely date that this happened was on March 30th, 14 days after the closure of the schools in Portugal.
See also
This model uses the modelling approach described at Bayesian cases changepoint modelling.
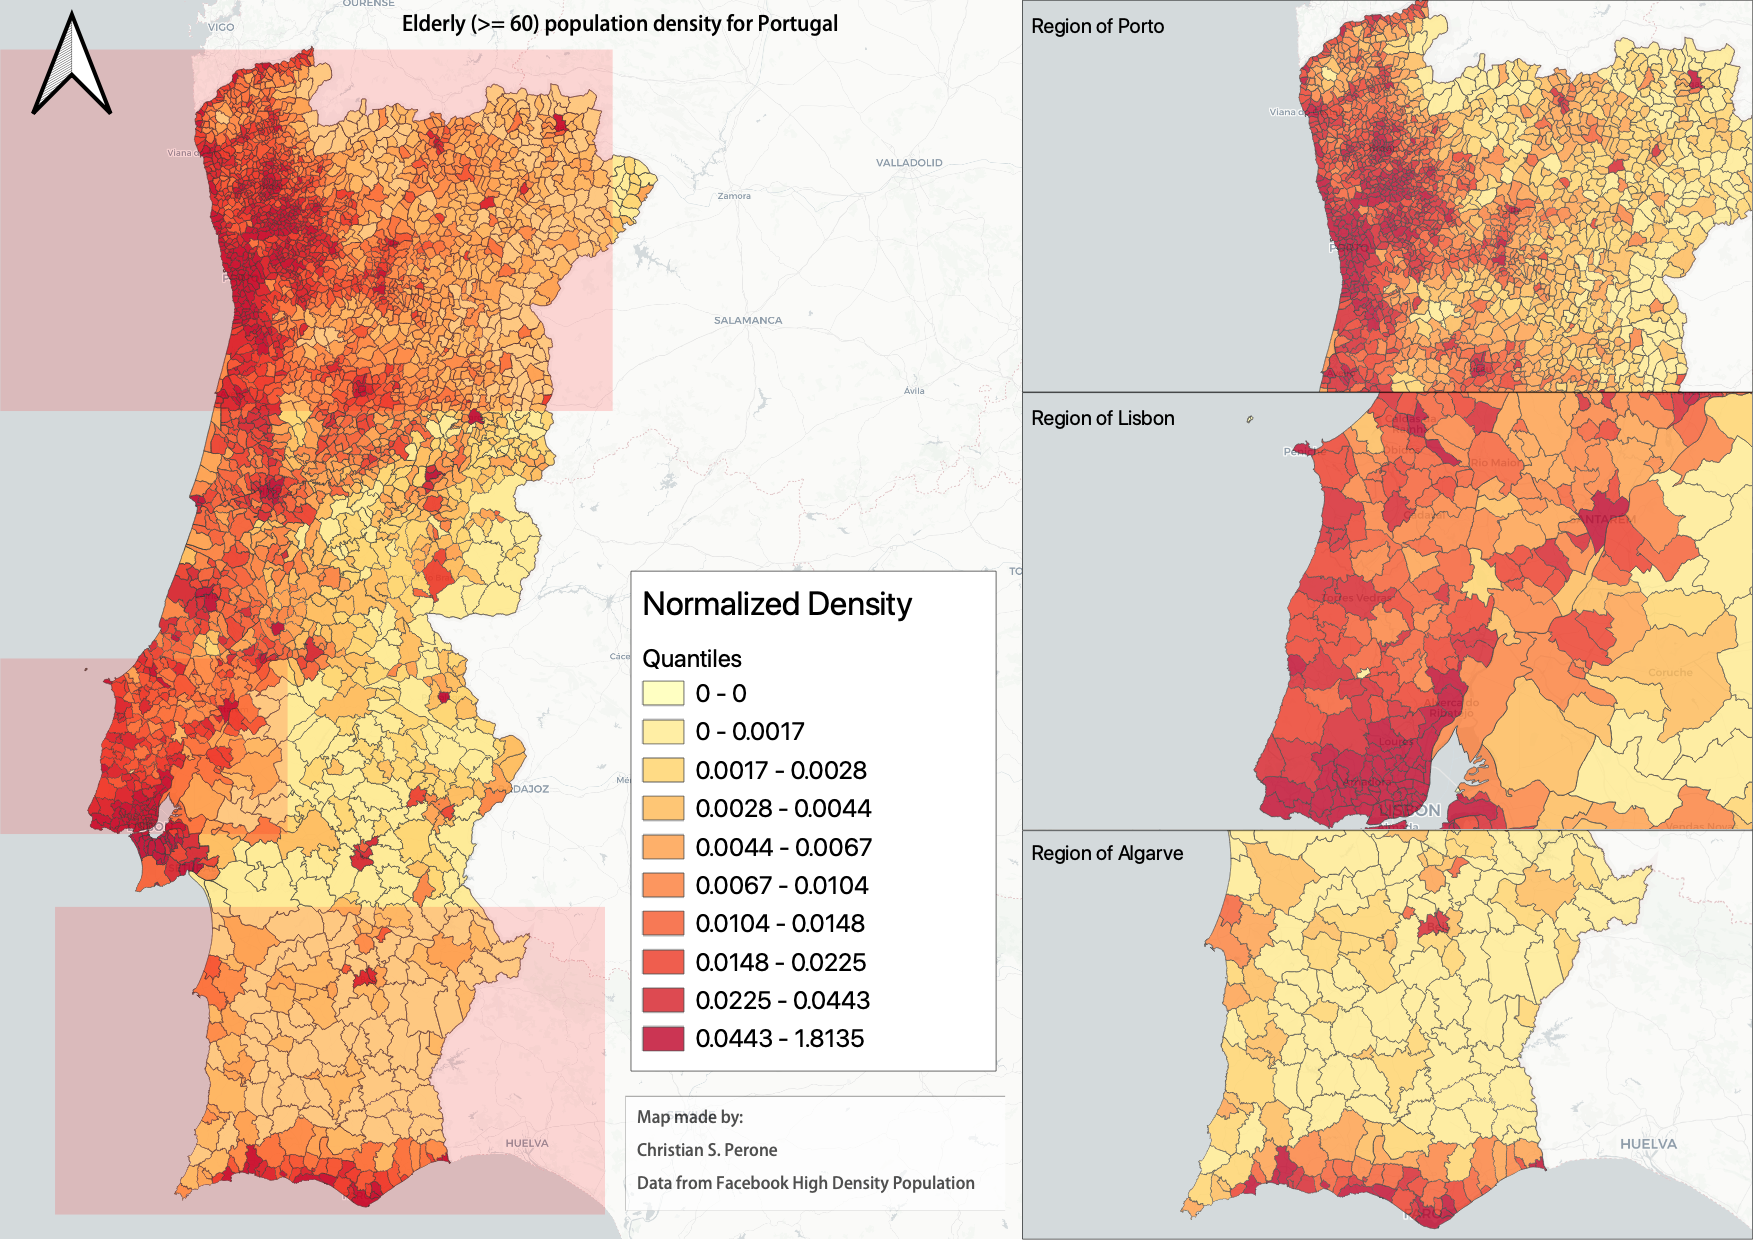
21/April – High-resolution elderly population density in Portugal
Just made a map of the elderly (>=60) population density in Portugal using Facebook’s high-resolution population maps (30 meters level resolution) with population allocation estimation using satellite imagery + machine learning. Working on an interactive version of it.
Click on it for a high-resolution version.