18/May – ICU length of stay (LOS) estimation for states in Brazil
The length of stay (LOS) of confirmed COVID-19 patients in ICUs is an important quantity to estimate, as it shows how long a patient will be allocating resources such as health workers, equipment, ICU beds, etc.
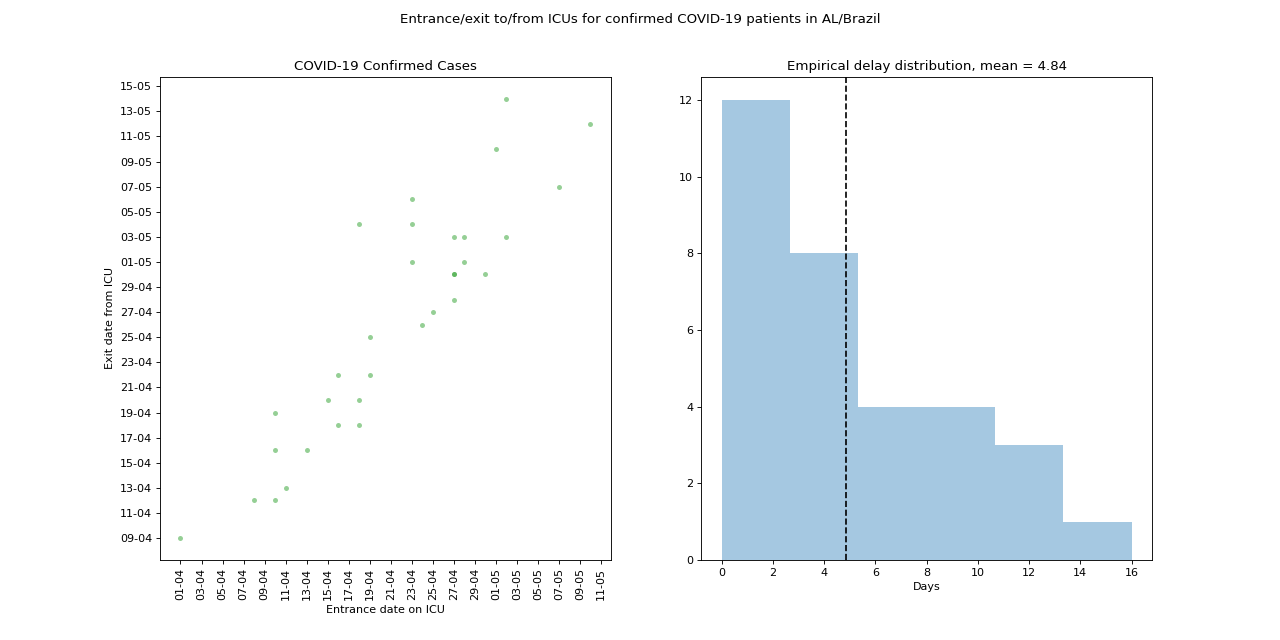
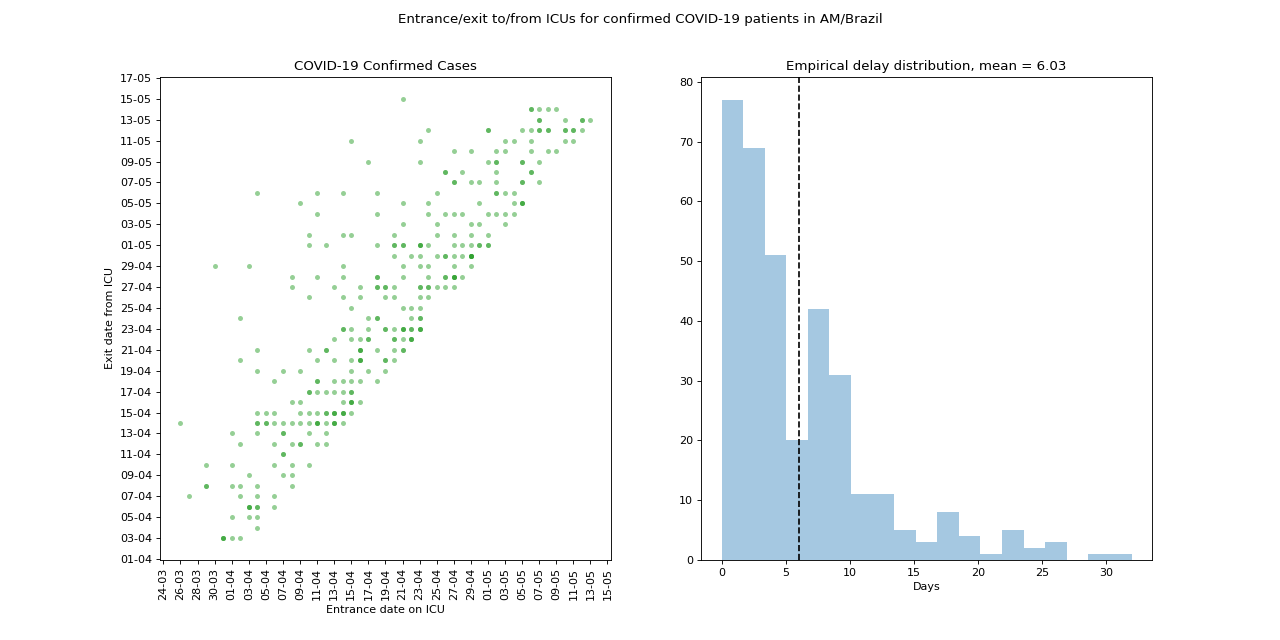
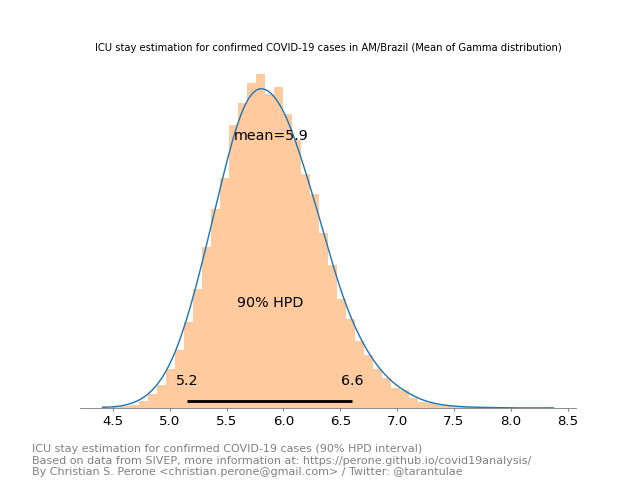
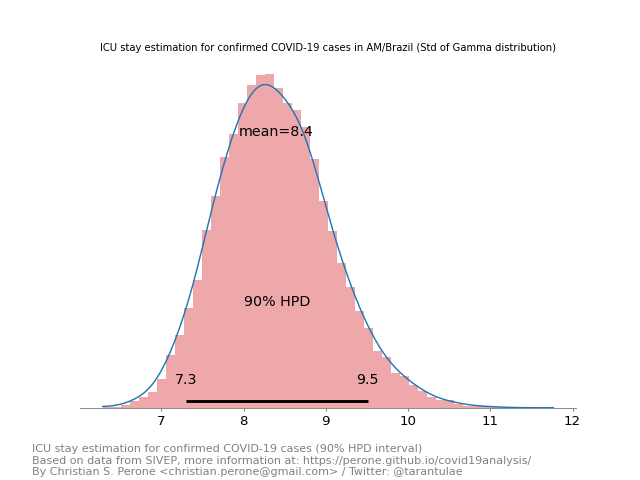
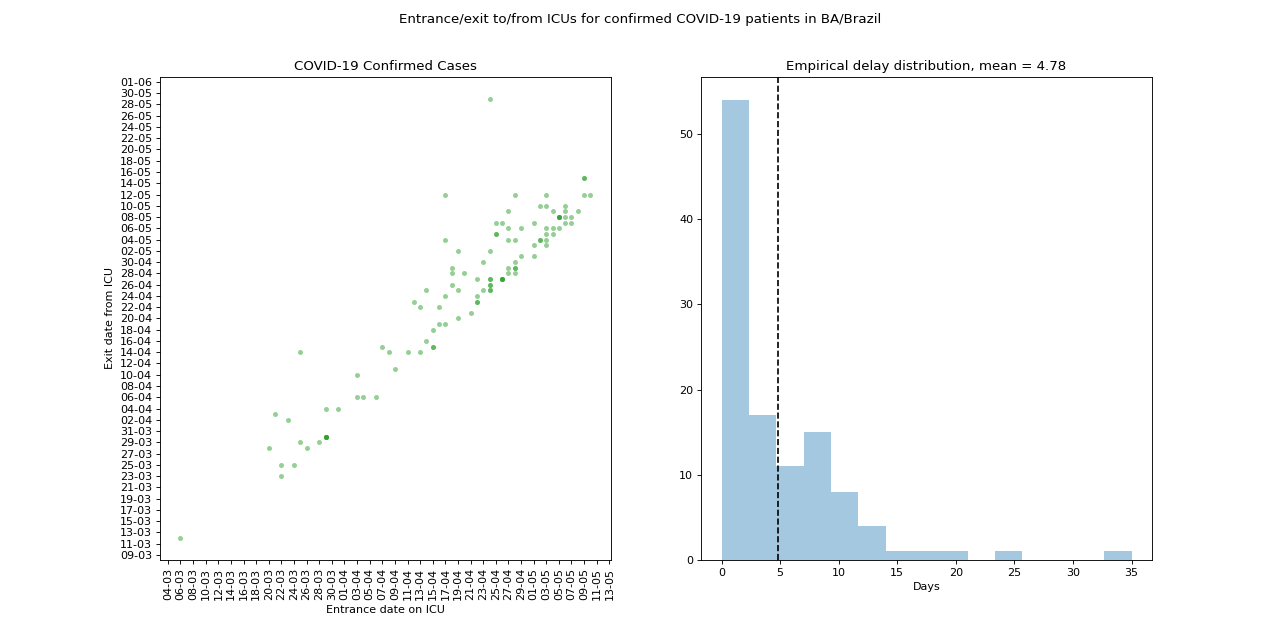
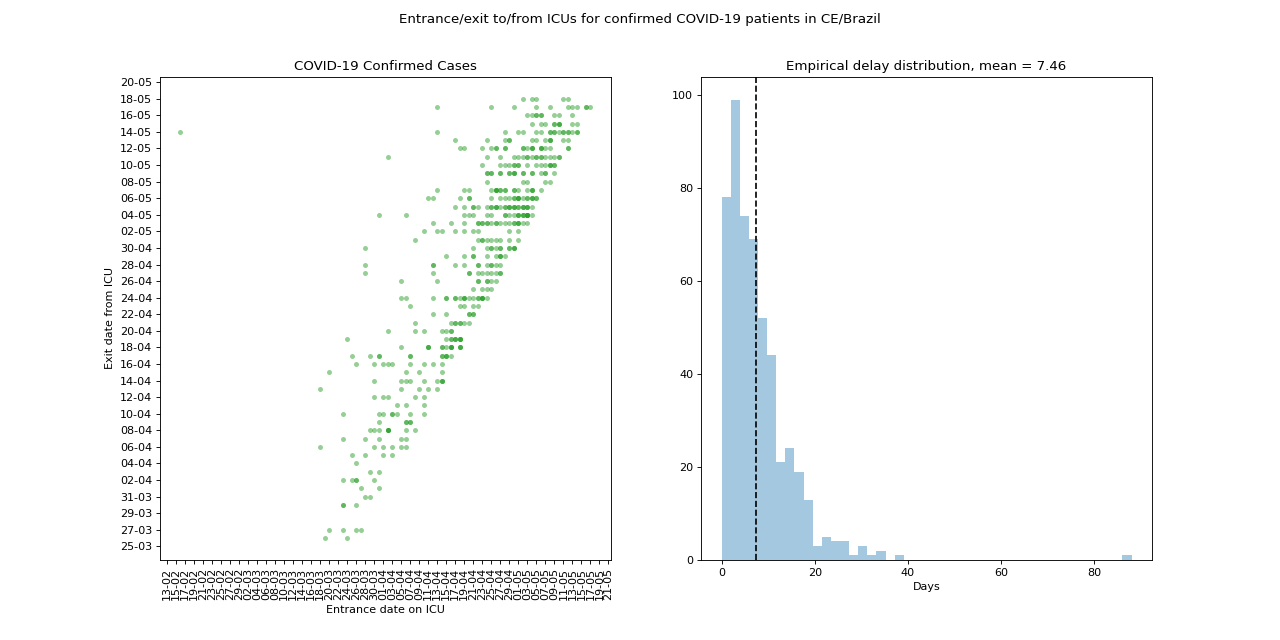
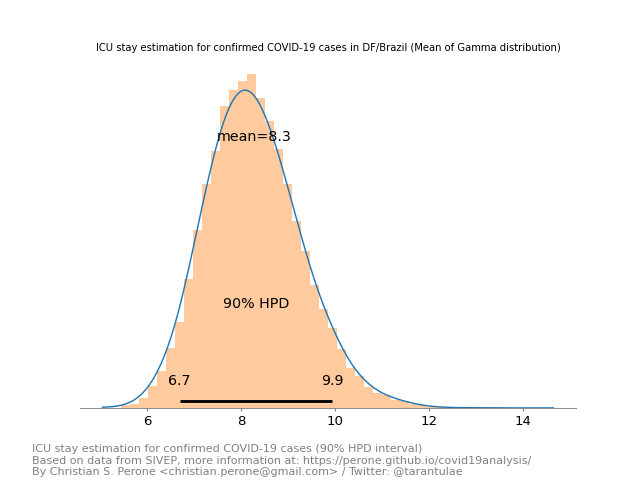
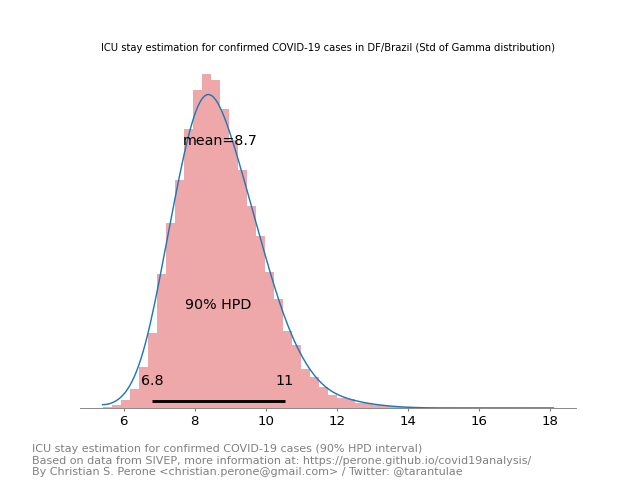
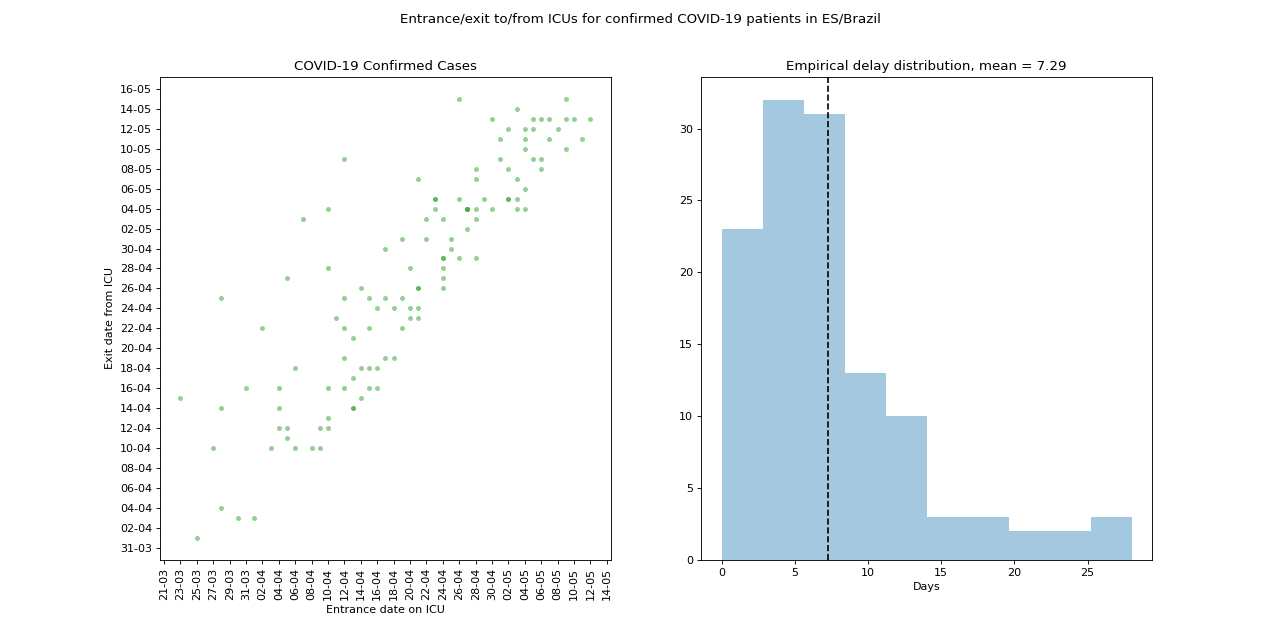
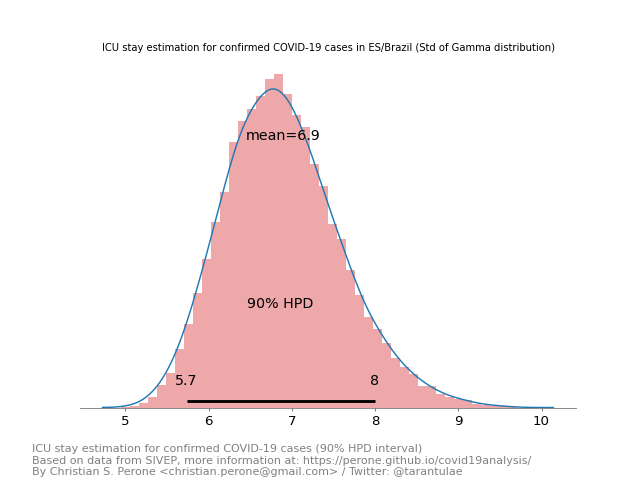
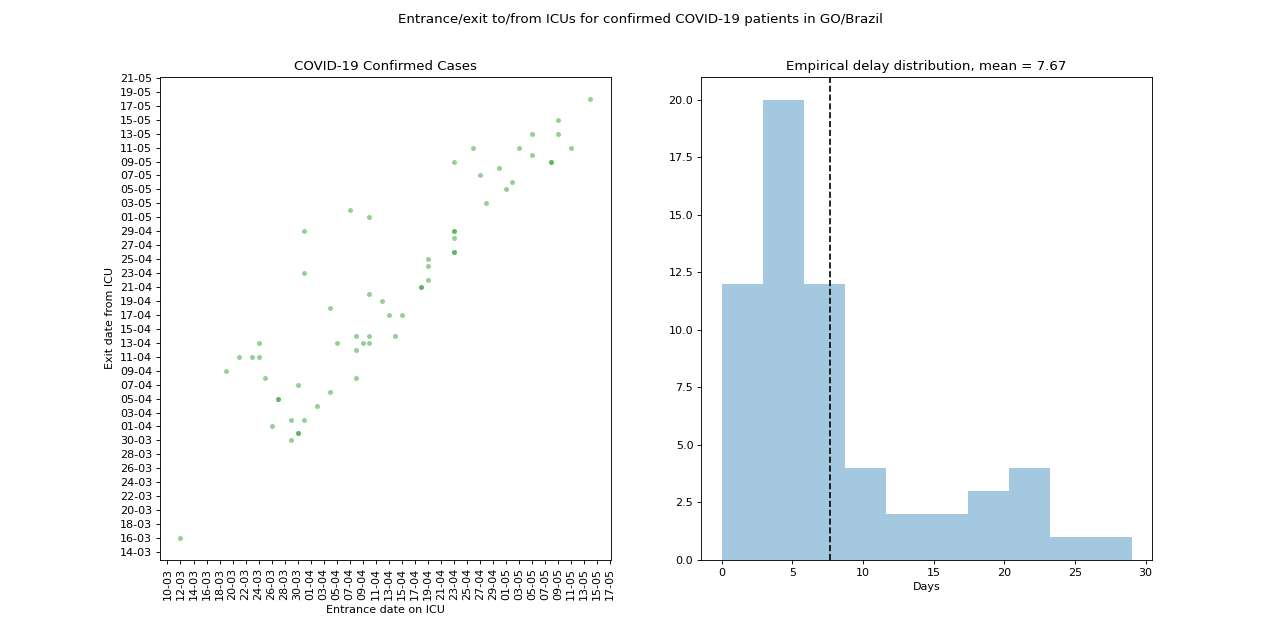
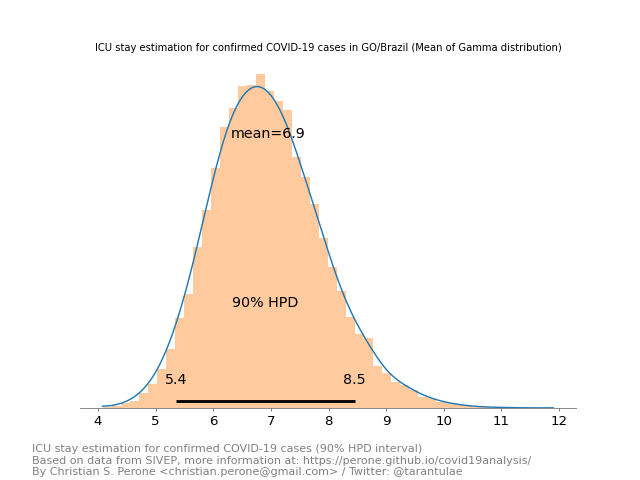
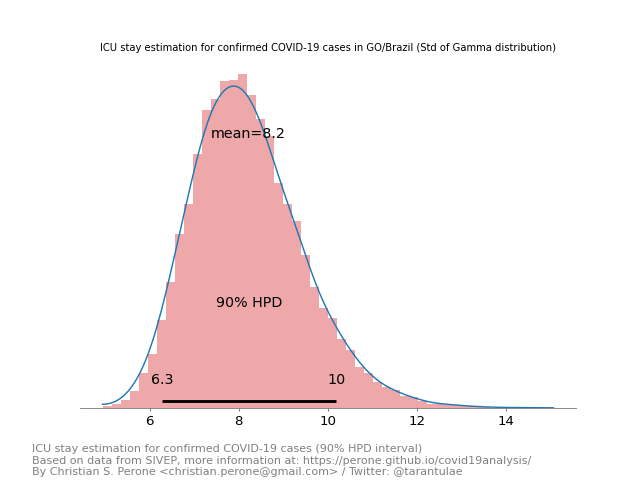
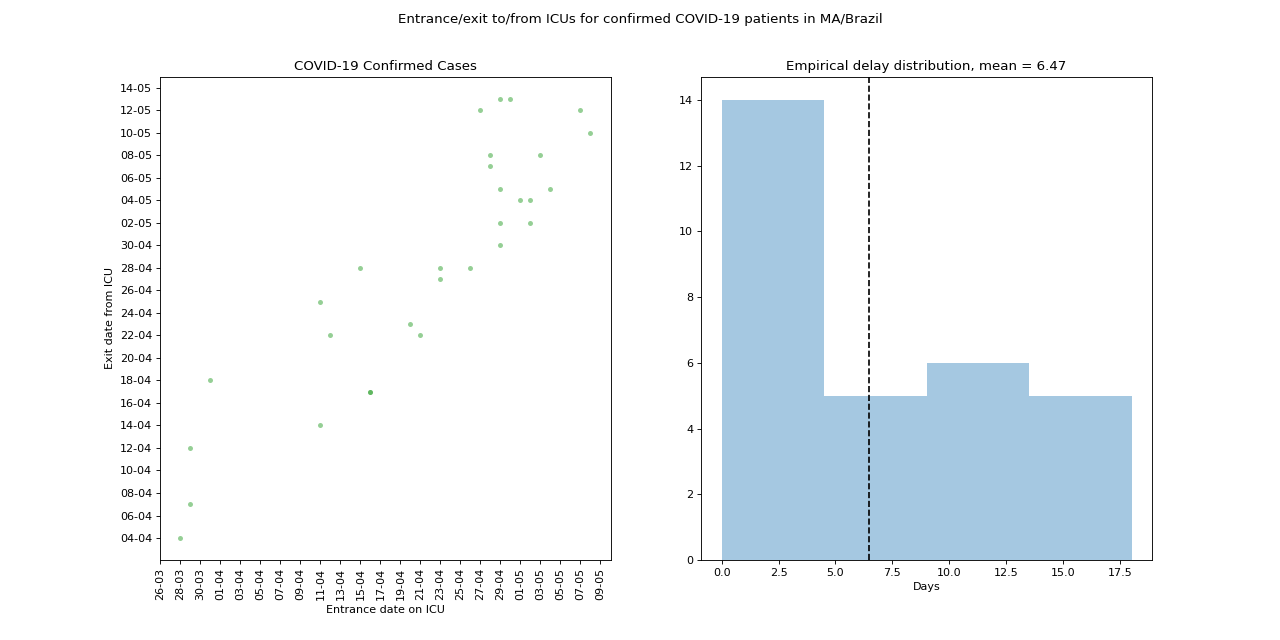
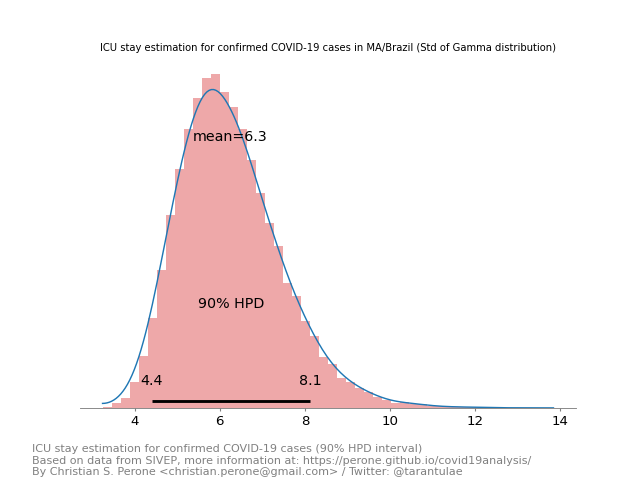
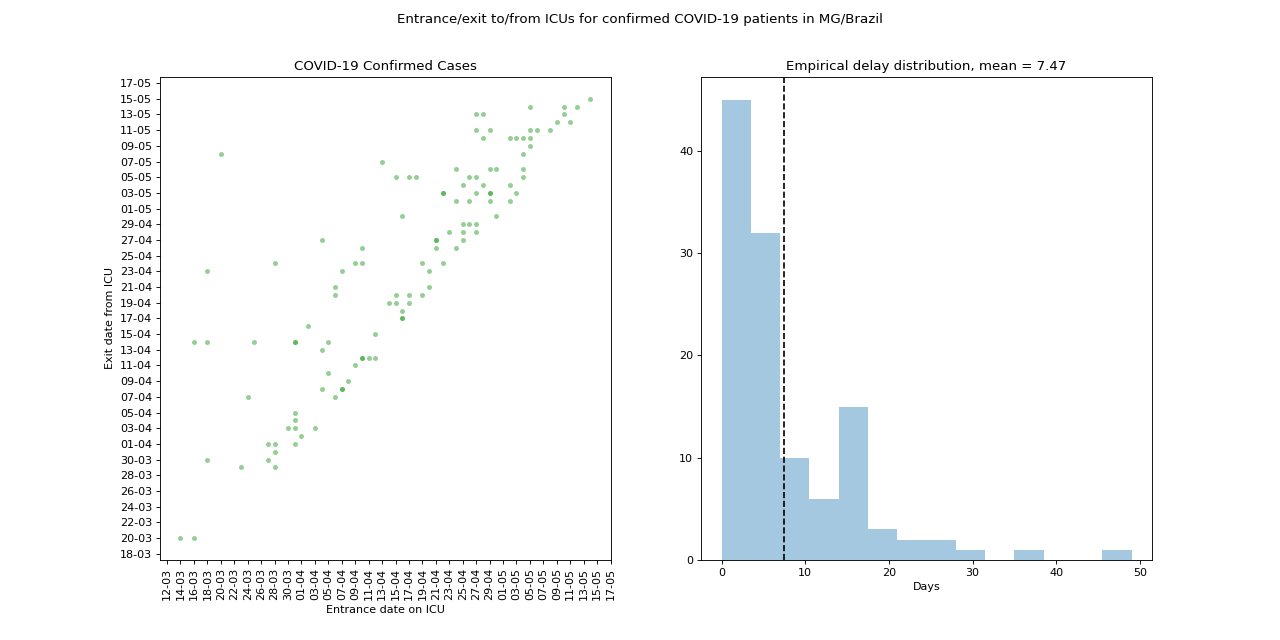
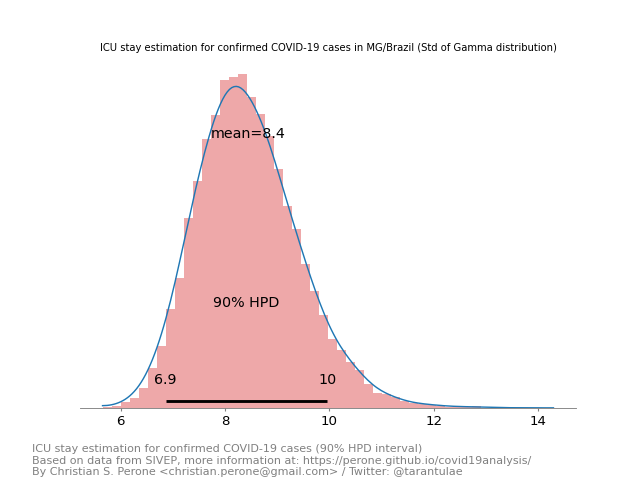
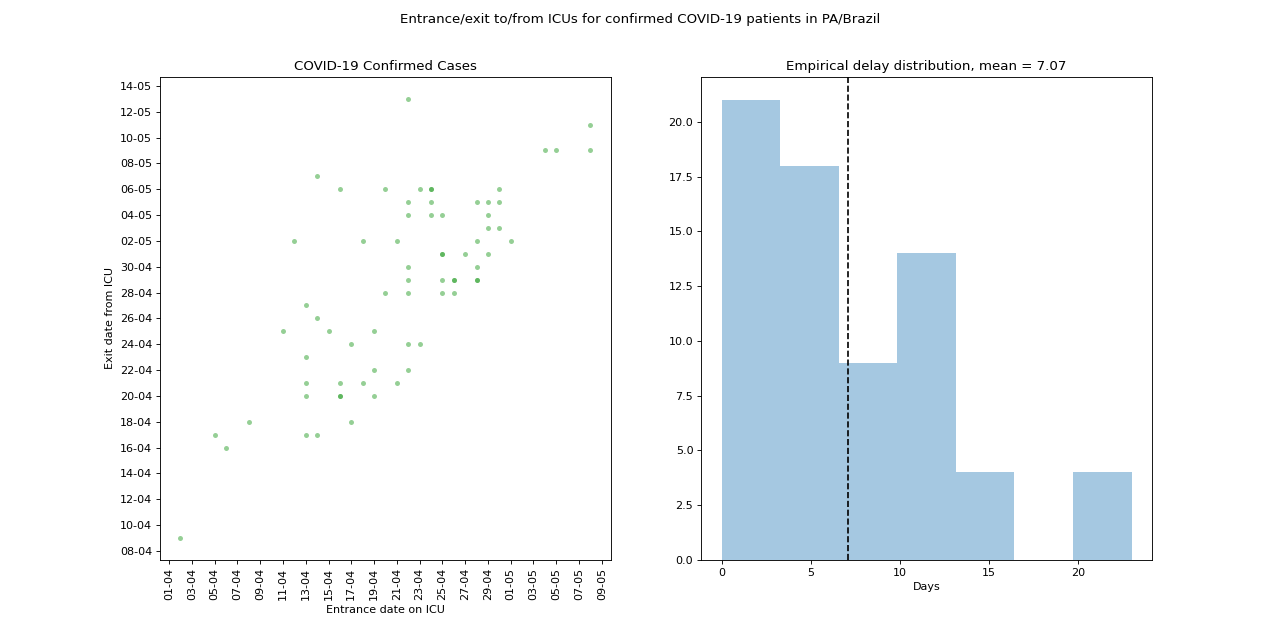
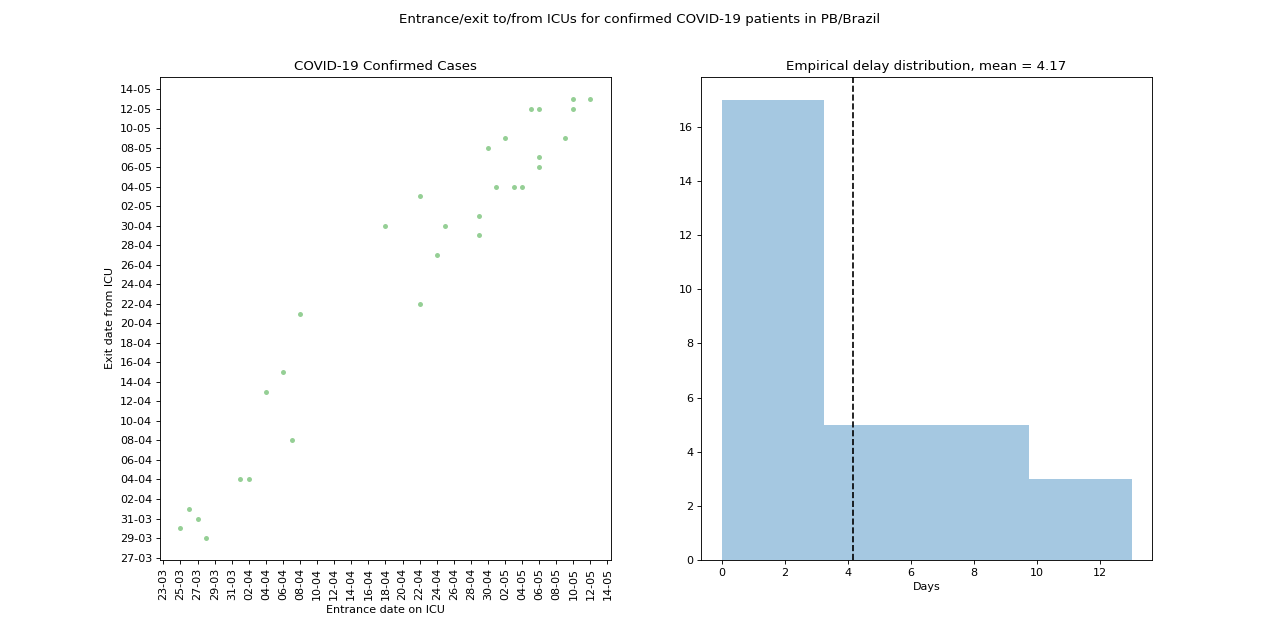
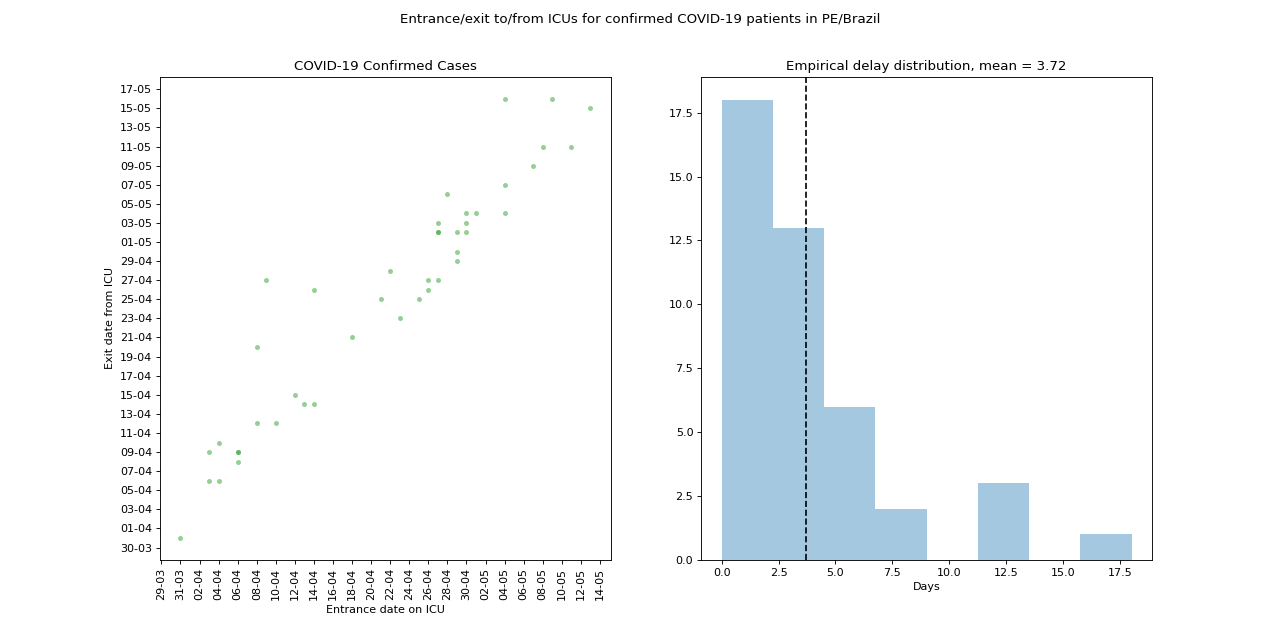
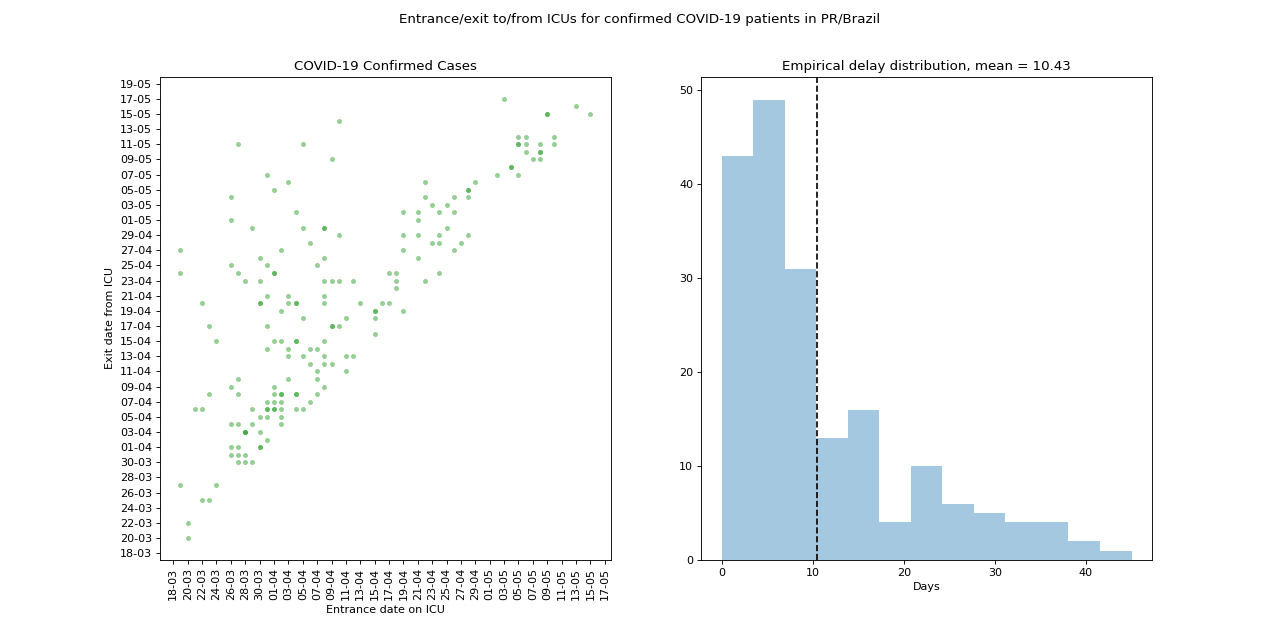
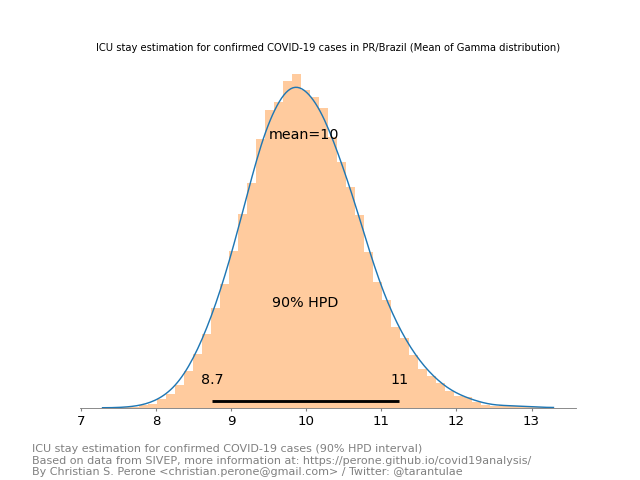
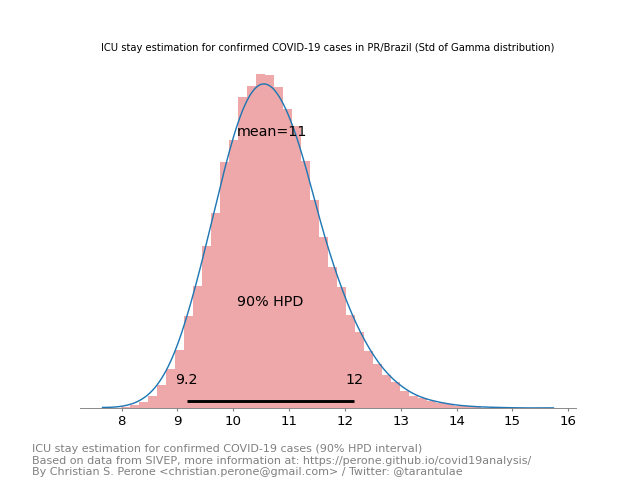
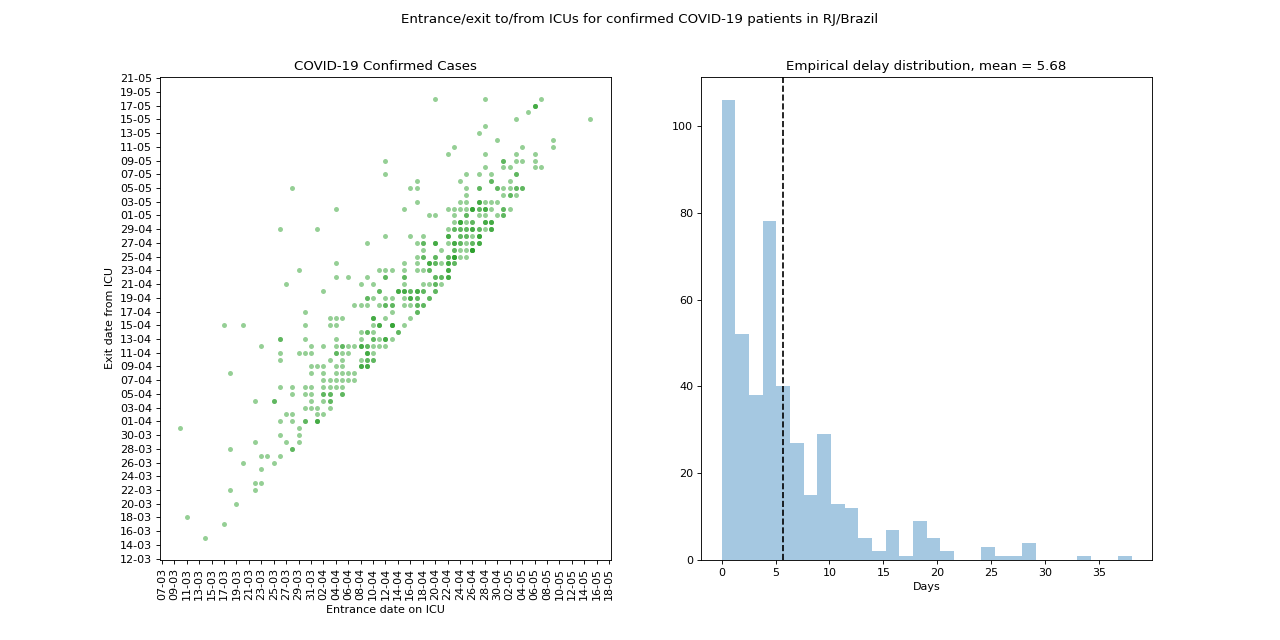
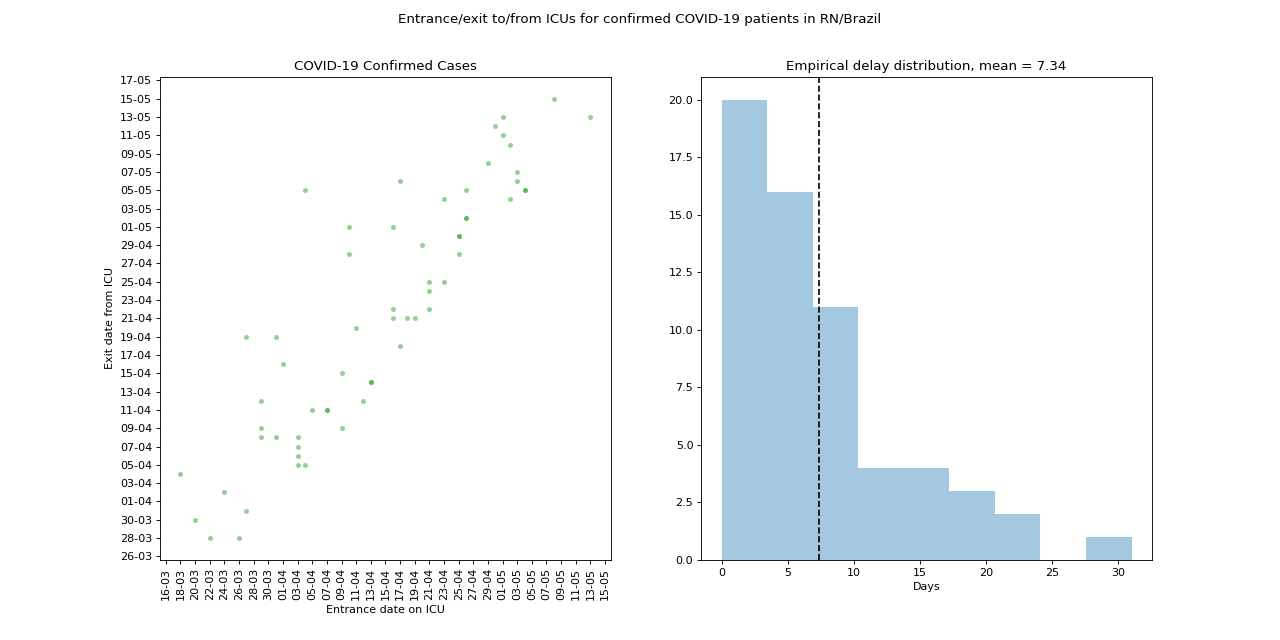
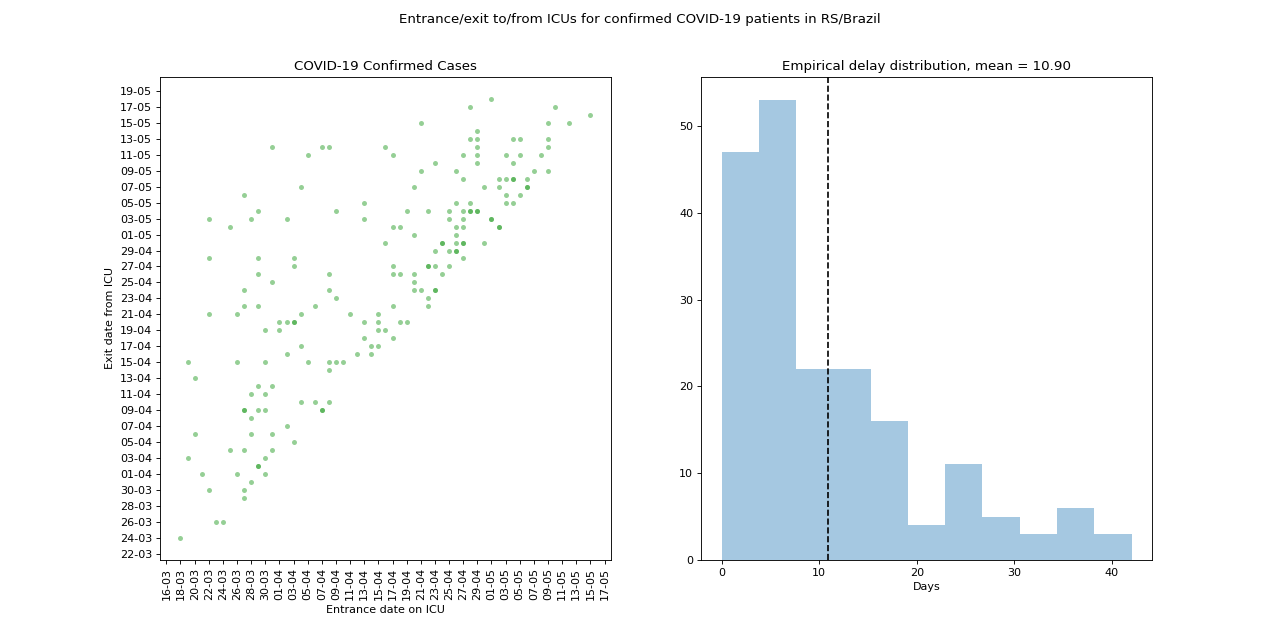
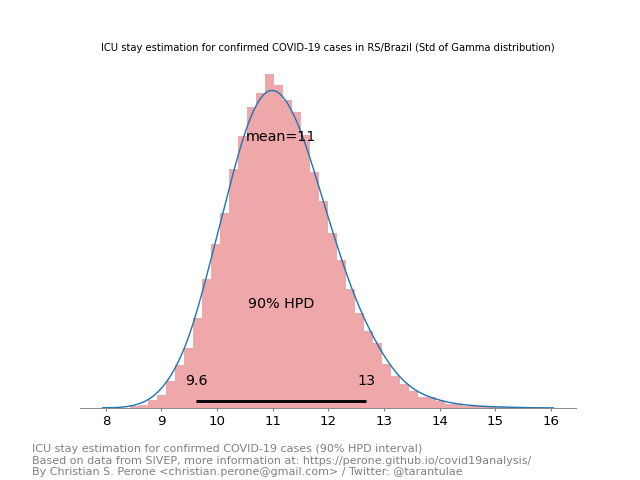
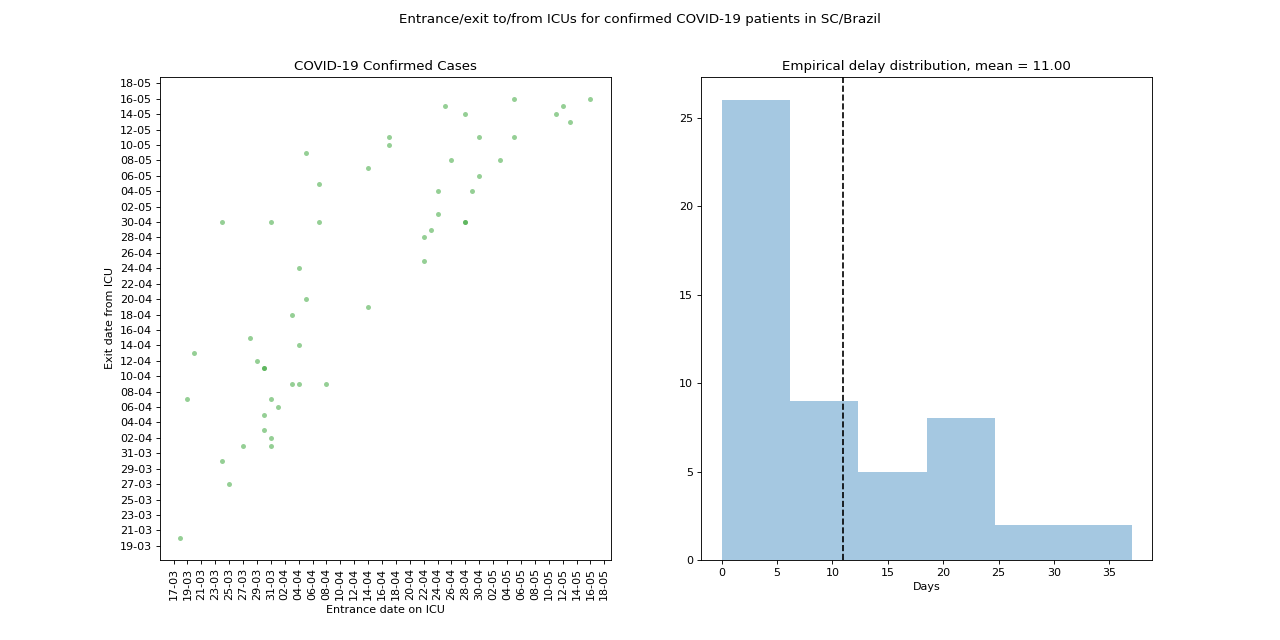
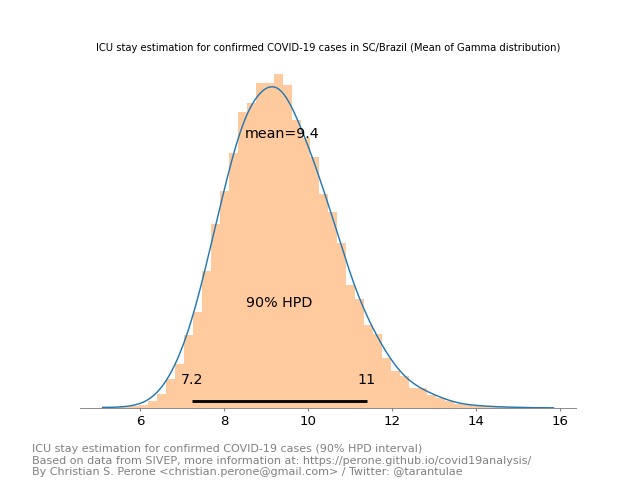
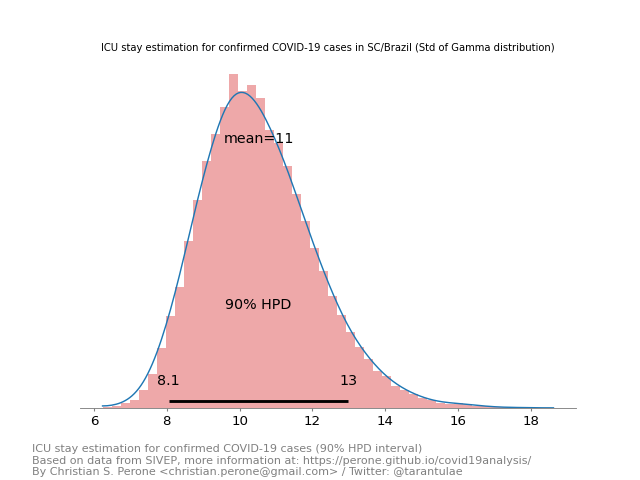
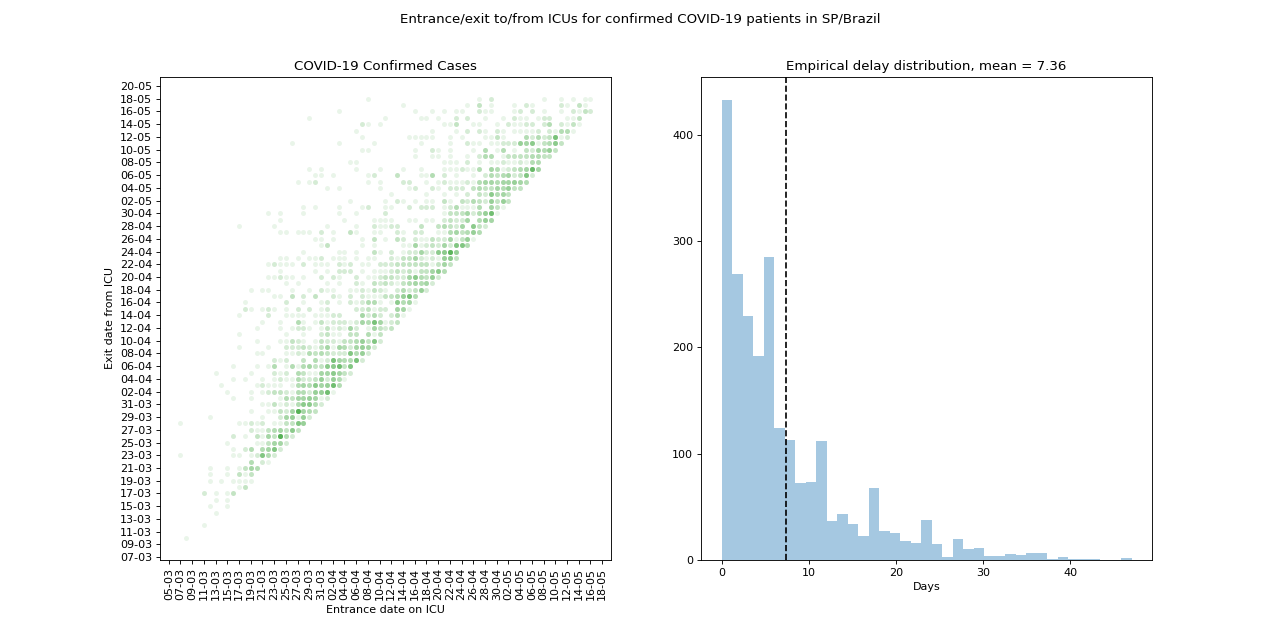
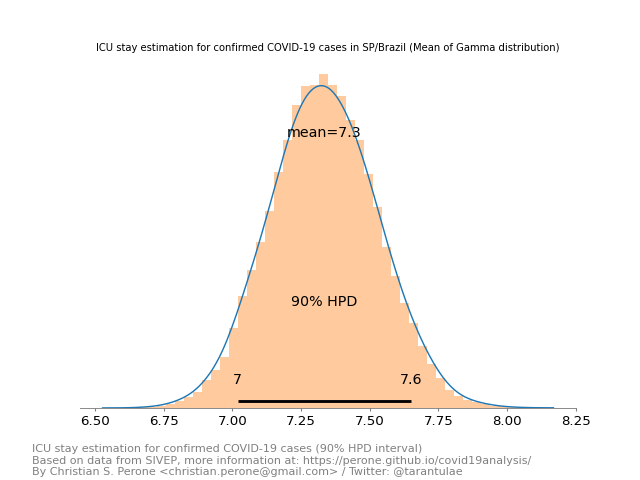
These plots show the estimation of the ICU stay length for each state in Brazil. In the plot with two panels, you will see in the left a plot with green dots, where the darker the dot is the more patients had the same stay interval. On the right panel of this plot we have the empirical histogram distribution of the stays with the mean showed as a dashed black line. Below this plot you have the posterior estimation for the mean and std. dev. of a Gamma distribution and with 90% credibility (HPD).
Some important points:
There is no distinction of non-survivor vs survivor, this analysis includes both cohorts;
I only used data from states where we have more than 30 data points in the SIVEP system, I’m planing to extend to small data regimes but that will require the implementation of evaluations for different distributions;
I’m modelling the data with a Gamma distribution and Exponential priors with \(\lambda = 0.5\) both for the \(\sigma\) and \(\mu\) parametrization of the Gamma distribution;
SIVEP data doesn’t include all testing done for all states and all cities;
The stay interval is defined as the time (in days) between the date of entrance in the ICU (DT_ENTUTI) and the date when the patient exited the ICU (DT_SAIDUTI); I’m not modelling the temporal changes of this delay, so the estimate distribution will end up with larger uncertainty due to this to cover up for these changes;
Note
This plot uses official data from SIVEP system in Brazil, the maximum of the notification date for this data was 18/May.
Summary for the ICU stay estimates
Summary for the Gamma mean estimates
Last date on SIVEP dataset: 18/May

Summary for the Gamma std. dev. estimates
Last date on SIVEP dataset: 18/May

Summary table for the last estimates
| State | Mean estimated of Gamma dist. (90% HPD credibility) | Std. Dev. estimated of Gamma dist. (90% HPD credibility) |
|---|---|---|
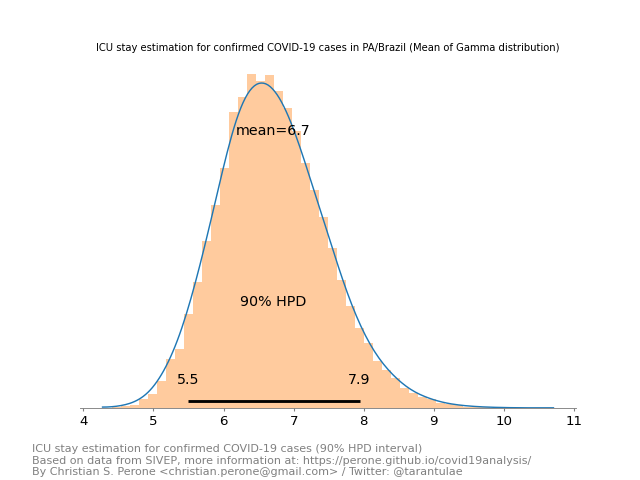
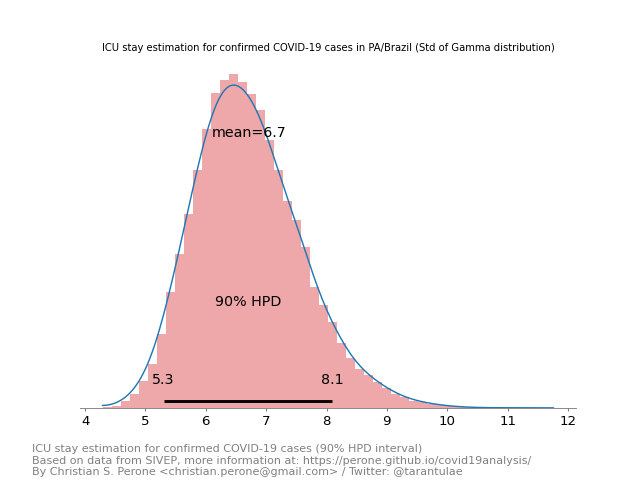
| PA | 6.70 (5.49 - 7.94) | 6.72 (5.30 - 8.10) |
| SC | 9.38 (7.24 - 11.41) | 10.54 (8.06 - 12.99) |
| PR | 9.97 (8.74 - 11.24) | 10.70 (9.16 - 12.17) |
| MG | 7.07 (5.86 - 8.25) | 8.45 (6.86 - 9.96) |
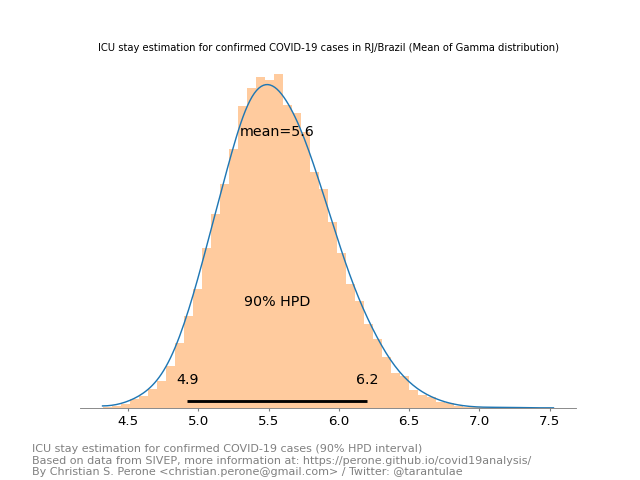
| RJ | 5.56 (4.92 - 6.20) | 8.47 (7.43 - 9.50) |
| DF | 8.27 (6.69 - 9.93) | 8.73 (6.81 - 10.54) |
| RS | 10.42 (9.15 - 11.68) | 11.15 (9.62 - 12.68) |
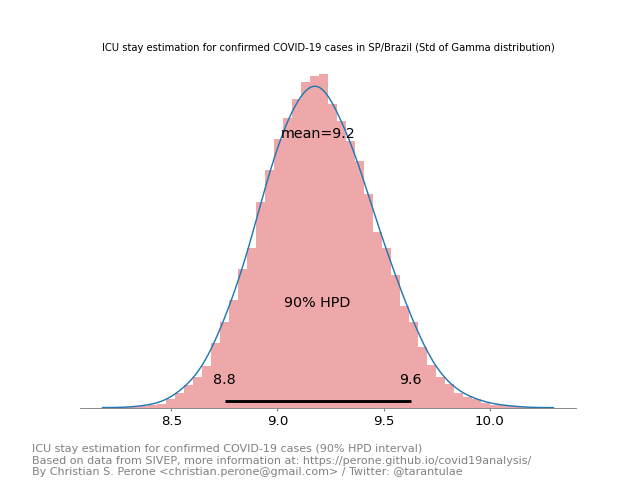
| SP | 7.33 (7.02 - 7.65) | 9.19 (8.75 - 9.63) |
| AM | 5.89 (5.15 - 6.60) | 8.39 (7.30 - 9.51) |
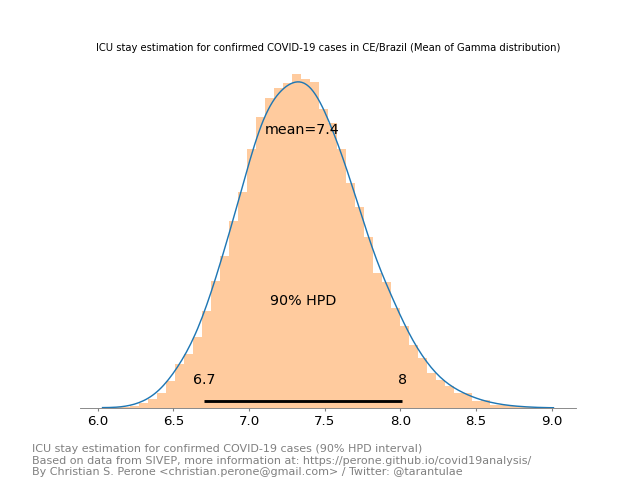
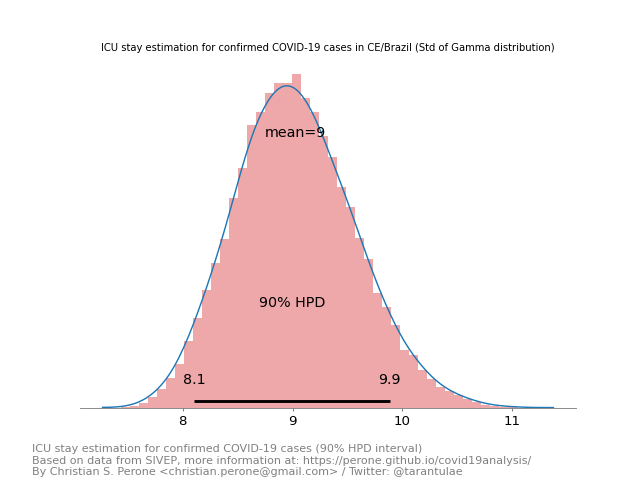
| CE | 7.35 (6.71 - 8.01) | 9.03 (8.11 - 9.88) |
| BA | 4.61 (3.69 - 5.51) | 6.12 (4.81 - 7.41) |
| MA | 5.71 (4.06 - 7.26) | 6.25 (4.40 - 8.12) |
| GO | 6.95 (5.35 - 8.45) | 8.21 (6.27 - 10.19) |
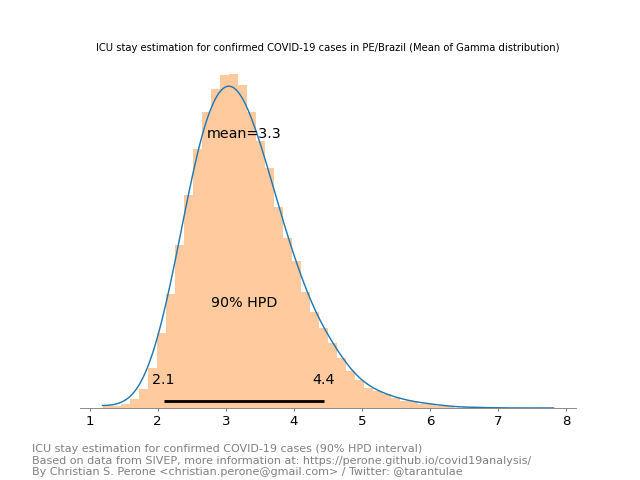
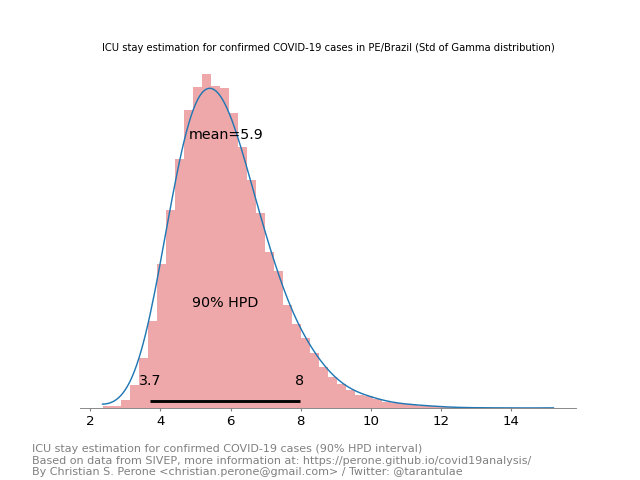
| PE | 3.26 (2.09 - 4.44) | 5.87 (3.70 - 7.97) |
| ES | 7.06 (6.07 - 8.07) | 6.90 (5.74 - 8.00) |
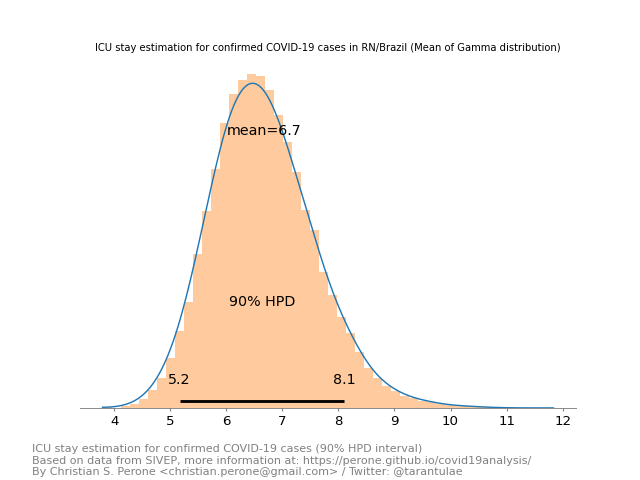
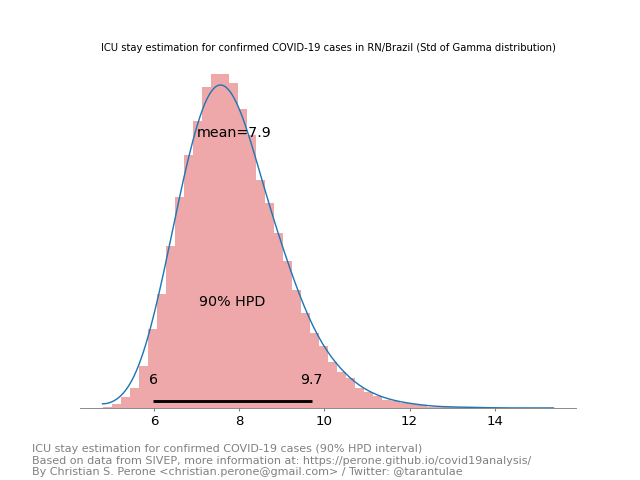
| RN | 6.67 (5.17 - 8.10) | 7.88 (5.98 - 9.70) |
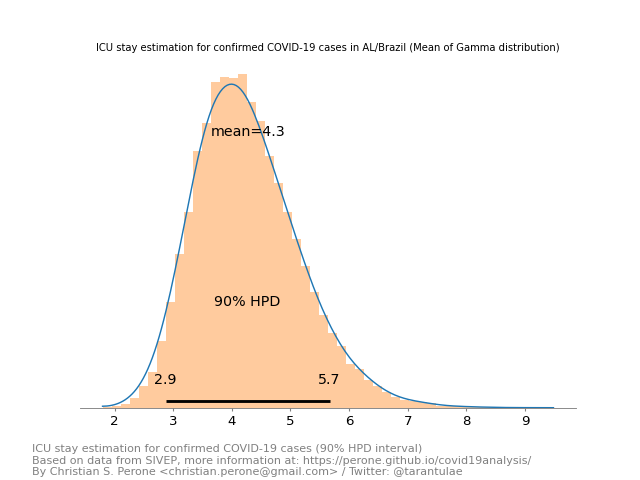
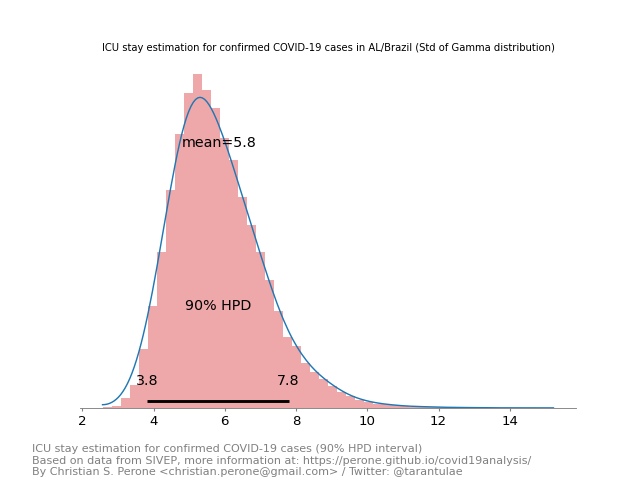
| AL | 4.27 (2.87 - 5.67) | 5.83 (3.83 - 7.79) |
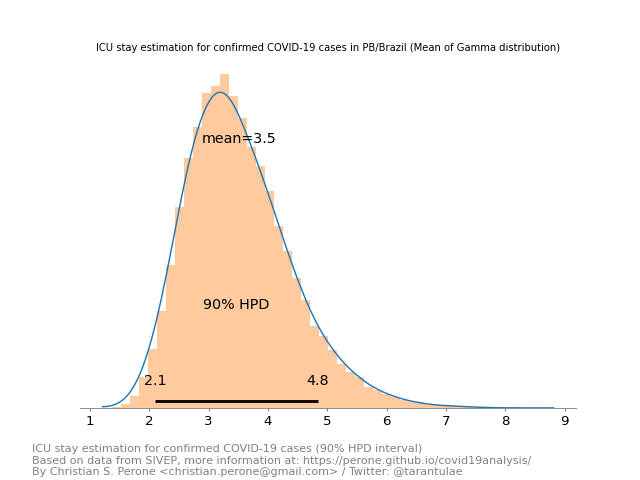
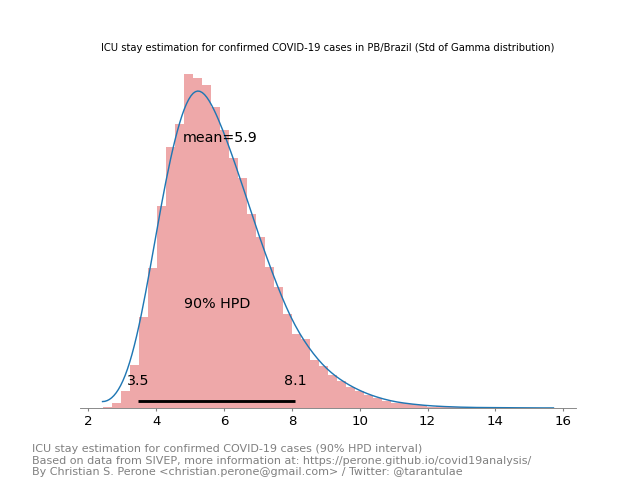
| PB | 3.52 (2.09 - 4.84) | 5.90 (3.48 - 8.10) |
State: Alagoas / AL
Scatter plot of symptom onset vs confirmation and empirical distribution
Posterior distribution for the mean of the Gamma distribution
Posterior distribution for the std. dev. of the Gamma distribution
State: Amazonas / AM
Scatter plot of symptom onset vs confirmation and empirical distribution
Posterior distribution for the mean of the Gamma distribution
Posterior distribution for the std. dev. of the Gamma distribution
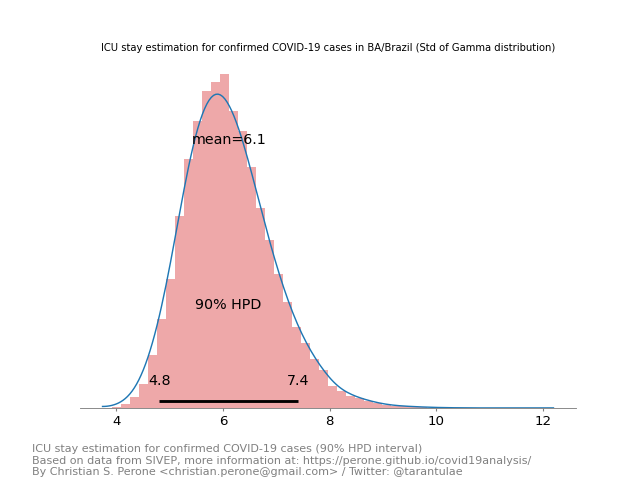
State: Bahia / BA
Scatter plot of symptom onset vs confirmation and empirical distribution
Posterior distribution for the mean of the Gamma distribution

Posterior distribution for the std. dev. of the Gamma distribution
State: Ceará / CE
Scatter plot of symptom onset vs confirmation and empirical distribution
Posterior distribution for the mean of the Gamma distribution
Posterior distribution for the std. dev. of the Gamma distribution
State: Distrito Federal / DF
Scatter plot of symptom onset vs confirmation and empirical distribution

Posterior distribution for the mean of the Gamma distribution
Posterior distribution for the std. dev. of the Gamma distribution
State: Espírito Santo / ES
Scatter plot of symptom onset vs confirmation and empirical distribution
Posterior distribution for the mean of the Gamma distribution

Posterior distribution for the std. dev. of the Gamma distribution
State: Goiás / GO
Scatter plot of symptom onset vs confirmation and empirical distribution
Posterior distribution for the mean of the Gamma distribution
Posterior distribution for the std. dev. of the Gamma distribution
State: Maranhão / MA
Scatter plot of symptom onset vs confirmation and empirical distribution
Posterior distribution for the mean of the Gamma distribution

Posterior distribution for the std. dev. of the Gamma distribution
State: Minas Gerais / MG
Scatter plot of symptom onset vs confirmation and empirical distribution
Posterior distribution for the mean of the Gamma distribution

Posterior distribution for the std. dev. of the Gamma distribution
State: Pará / PA
Scatter plot of symptom onset vs confirmation and empirical distribution
Posterior distribution for the mean of the Gamma distribution
Posterior distribution for the std. dev. of the Gamma distribution
State: Paraíba / PB
Scatter plot of symptom onset vs confirmation and empirical distribution
Posterior distribution for the mean of the Gamma distribution
Posterior distribution for the std. dev. of the Gamma distribution
State: Pernambuco / PE
Scatter plot of symptom onset vs confirmation and empirical distribution
Posterior distribution for the mean of the Gamma distribution
Posterior distribution for the std. dev. of the Gamma distribution
State: Paraná / PR
Scatter plot of symptom onset vs confirmation and empirical distribution
Posterior distribution for the mean of the Gamma distribution
Posterior distribution for the std. dev. of the Gamma distribution
State: Rio de Janeiro / RJ
Scatter plot of symptom onset vs confirmation and empirical distribution
Posterior distribution for the mean of the Gamma distribution
Posterior distribution for the std. dev. of the Gamma distribution

State: Rio Grande do Norte / RN
Scatter plot of symptom onset vs confirmation and empirical distribution
Posterior distribution for the mean of the Gamma distribution
Posterior distribution for the std. dev. of the Gamma distribution
State: Rio Grande do Sul / RS
Scatter plot of symptom onset vs confirmation and empirical distribution
Posterior distribution for the mean of the Gamma distribution

Posterior distribution for the std. dev. of the Gamma distribution
State: Santa Catarina / SC
Scatter plot of symptom onset vs confirmation and empirical distribution
Posterior distribution for the mean of the Gamma distribution
Posterior distribution for the std. dev. of the Gamma distribution
State: São Paulo / SP
Scatter plot of symptom onset vs confirmation and empirical distribution
Posterior distribution for the mean of the Gamma distribution
Posterior distribution for the std. dev. of the Gamma distribution