Mobility: Facebook Movement Range Maps
This section describes how to use the Facebook Movement Range Maps client
from Episuite. The main class used to download and parse the Facebook
Symptom survey data is the FacebookMovementRange.
See also
- Facebook: Data for good - Movement Range Maps
Documentation of the Movement Range Maps.
- Module
episuite.mobility.facebook Documentation of the
episuite.mobility.facebookmodule.
[1]:
from matplotlib import pyplot as plt
from episuite.mobility import facebook
Load Movement Range Maps data
The Episuite API for the Facebook Movement Range Maps allows you to download the entire range maps data or to filter by a single country by using a country code. We will here just download data from Brazil using the BRA country code.
The movement range maps are increasing in size every day, that’s why filtering by your country code is highly recommended. If you specify the country_code while calling the load_movement_range(), Episuite will filter the dataset without loading it entirely to memory.
[2]:
client = facebook.FacebookMovementRange()
[3]:
mrange_data = client.load_movement_range(country_code="BRA")
[4]:
mrange_data.tail(8)
[4]:
| ds | country | polygon_source | polygon_id | polygon_name | all_day_bing_tiles_visited_relative_change | all_day_ratio_single_tile_users | baseline_name | baseline_type | |
|---|---|---|---|---|---|---|---|---|---|
| 1525975 | 2021-03-12 | BRA | GADM | BRA.9.98_1 | Guapó | -0.19013 | 0.25627 | full_february | DAY_OF_WEEK |
| 1525976 | 2021-03-13 | BRA | GADM | BRA.9.98_1 | Guapó | -0.25377 | 0.26759 | full_february | DAY_OF_WEEK |
| 1525977 | 2021-03-14 | BRA | GADM | BRA.9.98_1 | Guapó | -0.27125 | 0.31333 | full_february | DAY_OF_WEEK |
| 1525978 | 2021-03-15 | BRA | GADM | BRA.9.98_1 | Guapó | -0.11685 | 0.25014 | full_february | DAY_OF_WEEK |
| 1525979 | 2021-03-16 | BRA | GADM | BRA.9.98_1 | Guapó | -0.09969 | 0.28633 | full_february | DAY_OF_WEEK |
| 1525980 | 2021-03-17 | BRA | GADM | BRA.9.98_1 | Guapó | -0.12332 | 0.26972 | full_february | DAY_OF_WEEK |
| 1525981 | 2021-03-18 | BRA | GADM | BRA.9.98_1 | Guapó | -0.20530 | 0.28424 | full_february | DAY_OF_WEEK |
| 1525982 | 2021-03-19 | BRA | GADM | BRA.9.98_1 | Guapó | -0.17599 | 0.25957 | full_february | DAY_OF_WEEK |
The Movement Range Maps uses the country codes and geographical data from GADM. So you will have to download it to be able to plot geographical data. You can also filter by a specific ID or polygon name such as in the example below.
[5]:
porto_alegre = mrange_data.query("polygon_name == 'Porto Alegre'")
[6]:
porto_alegre = porto_alegre.set_index("ds")
[7]:
porto_alegre.tail()
[7]:
| country | polygon_source | polygon_id | polygon_name | all_day_bing_tiles_visited_relative_change | all_day_ratio_single_tile_users | baseline_name | baseline_type | |
|---|---|---|---|---|---|---|---|---|
| ds | ||||||||
| 2021-03-15 | BRA | GADM | BRA.21.305_1 | Porto Alegre | -0.33384 | 0.33542 | full_february | DAY_OF_WEEK |
| 2021-03-16 | BRA | GADM | BRA.21.305_1 | Porto Alegre | -0.31585 | 0.34260 | full_february | DAY_OF_WEEK |
| 2021-03-17 | BRA | GADM | BRA.21.305_1 | Porto Alegre | -0.33439 | 0.34322 | full_february | DAY_OF_WEEK |
| 2021-03-18 | BRA | GADM | BRA.21.305_1 | Porto Alegre | -0.32333 | 0.33894 | full_february | DAY_OF_WEEK |
| 2021-03-19 | BRA | GADM | BRA.21.305_1 | Porto Alegre | -0.31862 | 0.31925 | full_february | DAY_OF_WEEK |
Visualization
[8]:
fig = plt.figure(figsize=(10, 6))
porto_alegre["all_day_bing_tiles_visited_relative_change"].plot()
plt.xlabel("Date")
plt.ylabel("all_day_bing_tiles_visited_relative_change")
plt.show()
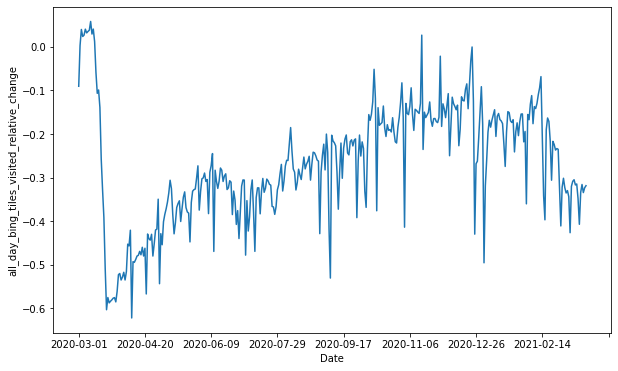
We can see in this case a major reduction of mobility during the early months of the pandemic in Porto Alegre/Rio Grande do Sul/Brazil, followed by a slow rise in mobility with a downward trend after February due to the surge of cases in the city (after new mobility restrictions were deployed by the government).